Landslides Monitoring with a Squint Angle Based on GBSAR
Zelong Shao1, 2, Xiangkun Zhang1, 2, *, and Yingsong Li1, 3
Abstract—GBSAR has been widely used in landslides monitoring for its high precision in deformation monitoring and portable characteristic in natural environments. When monitor slides in mountainous areas, GBSAR cannot only work in positive mode, and its antennas may be directed to the target with a large squint angle. Unfortunately, normal range doppler imaging algorithm is not used well in such applications. Thus, a correction method of RD algorithm for SAR imaging with a squint angle has been proposed in the paper.
Because the monitoring target may be far away from the view center of the GBSAR, echo of the target may be side lobe resided, when it is received by the radar’s sensor. Simultaneously, distance between the sensor and imaging target changes with the azimuth time. Therefore, target in the SAR image would not be focused in one range bin if no range correction method was used. Thus, phase correction methods were used in the paper. The phase error was corrected in range domain and azimuth domain, respectively. It avoids 2D FFT processing. Thus, it may use few time and work. In this way, the GBSAR would have real time processing ability in the future. In the paper, a GBSAR was designed and used in slide monitoring applications in western mountains of Beijing. The experiment result shows that the system can measure target’s micro deformation in mm levels with a high precision.
1. INTRODUCTION
The ground based synthetic aperture radar (GBSAR) is normally used as a deformation monitoring system in lots of regions [1]. Simultaneously, the system is designed based on SAR imaging methods and interference methods, to be used in micro-deformation monitoring regions such as open pit mines, large dams, landslides, and important artificial structures for disaster alarming [2, 3]. Especially, it can be used in land slide monitoring with a long time [4, 5].
Because the system uses interferometric method and is designed with a wide-band frequency modulated continuous wave (FMCW) signal, it has high micro-deformation measure ability with a high precision in um levels [6, 7]. Normally, FMCW signal is used in SAR imaging with range compression method’s change. When FMCW signal is used, the range compression methods are realized by deramp [8, 9]. And the phase error caused by a squint angle is corrected in range doppler domain.
In addition, the range doppler SAR imaging algorithm is changed by range migration correction when the GBSAR system’s sensor is directed to the target with a squint angle [10]. In [11], conventional range doppler SAR imaging method was modified to solve the problem of image skew when the radar was directed to target with a slant angle. Thus, a phase correction method was proposed in the paper. In [12], modified doppler parameters estimation methods were proposed. In practice, the doppler parameters are important for the imaging result. Without doppler center frequency correction, the SAR image will defocus. Thus, a doppler center frequency correction method is proposed in the paper.
Received 22 January 2019, Accepted 14 March 2019, Scheduled 1 April 2019
* Corresponding author: Xiangkun Zhang (zhangxiangkun@mirslab.cn).
The rest of this paper is organized as follows. Section 2 briefly reviews the basic phase correction method when the GBSAR is used in imaging with a squint angle. In Section 3, a target imaging algorithms is given to acquire SAR image of the landslide. In Section 4, SAR images are acquired by using the proposed algorithm in landslide monitoring. In Section 5, micro-deformation of the effective scatter of landslide is acquired by retrieving from the interferometric phase of the chosen scatter between two SAR images. In Section 6, a short summary of this paper is given.
2. PRINCIPLE OF GBSAR 2.1. General Description
When the GBSAR is used to monitor a land-slide, the monitored target region may not be in the right front of the system’s radar sensor. If an effective scatter is in the left side of the radar system as shown in Fig. 1, the radar antenna should be directed to the target with a slant angle φ.
θ
y P
Rail
A
O C
D
φ
x
B
Figure 1. Diagram of displacement correction scheme.
In Fig. 1, the rail guide of the GBSAR system is 2.1 meters in length, and its center is at point O. In one SAR imaging period, the radar sensor moves from point A to point B. The scatter is at the position of P. As shown in the figure, the range direction is the vertical direction, and the horizontal direction is the azimuth direction.
In real experiments, the scatter P is far from the center of the rail with a distanceRaround 170 m in line of sight. In addition, the slant angle φ is 3.8◦. The radar antenna’s angle θ is 4◦. Thus, the cover region of the GBSAR system is far from the start point of A with a distance of 23 meters in horizontal direction added by the antenna cover length 12 meters (La= Rθ) and the slant length 11 meters (Rφ). It is larger than the distance between the scatter point target P and the rail’s point A (20 m) in horizontal direction. Thus, the scatter can be monitored by the GBSAR.
When the radar’s antenna is directed to the scatter with a slant angel, the normal range doppler SAR imaging algorithm should be corrected by the compensation of instantaneous phase changes related with azimuth time. It can be realized by the following equation [13].
The instantaneous phase errorϕazimuth is
ϕazimuth(η) = 2π·fηc·η, (1)
whereη represents the azimuth time, and fηc is the doppler center frequency.
When imaging the scatter with a slant angle, fηc is related with slant angle φ. Their relation is
shown in the following equation.
fηc =−2λdRdη(η) = 2vsinλ φ (2)
where λis the wavelength of the radar’s wave, R(η) the instantaneous distance between the scatter P and the radar’s sensor, andv the velocity of the radar sensor on the rail.
Simultaneously, the target’s image may defocus in range direction caused by the slant angle [14]. When the slant angle exists, the distances between the scatter and the radar sensor at the starting point A and ending point B are not equal. Thus, the scatter P in the SAR image may defocus in different range bins. The scatter’s length Δx in range direction in the defocused SAR image can be illustrated by the following equation.
Δx=R2+L2a−2∗R∗La∗cos(π/2 +φ) (3)
If we use parameters shown in Fig. 1, it is 0.9 meters. Thus, it is about twice of the range resolution of the GBSAR system when the bandwidth of the radar’s microwave is 300 MHz. Namely, the target’s echo was discovered in two neighboring range bins in the range doppler domain after the echo was compressed in range direction.
2.2. GBSAR System Description
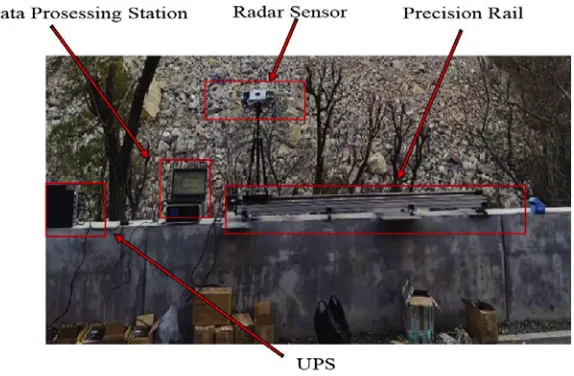
The GBSAR was designed and used in slide monitoring experiments. It was consisted of a radar sensor which can transmit and receive microwave signal, linear rail guide which has um precision, and uninterruptible power supply (UPS) which provides electricity for the normal working of the GBSAR. The diagram of the proposed radar is shown in Fig. 2.
Figure 2. Block diagram of the radar system.
To acquire the corner reflector’s micro deformation, the radar’s parameters are shown in Table 1 [15]. Radars in high frequency with a continuous wave can be integrated to make the system flexible. Thus, the GBSAR prototype was operated in Ka band whose center frequency is 36.05 GHz to decrease the radar’s weight and complexity. To acquire high range resolution, large bandwidth of system’s electromagnetic wave was required. Thus, the bandwidth of the system is 300 MHz. At the same time, the transmitted power of the radar was decreased to 23 dBm with the use of continuous wave. To acquire a long period continuous wave, the pulse width of the system is 1 ms. Thus, the pulse repeat frequency is 1 kHz. Other parameters such as AD sampling rates are limited by the hardware used in the system. AD module can supply enough echo data for SAR imaging and deformation retrieving procedure realized by the data processing station.
3. SAR IMAGING ALGORITHM WITH A SQUINT ANGLE
When the imaging geometry is with a slant angle, echo in 2D spectrum domain can be expressed as in the following equation [16].
s0(fr, fa) =σ·ωr(fr)ωa(fa) exp
−j2πfax
v
exp
−j4πr(fc+fr) c
1− c
2f2
a
4v2(f
c+fr)2
Table 1. Radar parameters.
Parameters Values
Central frequency 36.05 GHz
Bandwidth 300 MHz
Transmitted Power 23dBm
PRF 1 KHz
AD Sampling rate 10 MHz Sampling precision 16 bit Noise Figure ≤3.5 dB
Pulse width 1 ms
Beam angle 4◦×10◦
where c represents the speed of light in vacuum, fc the carrier frequency of the radar, fr the range
frequency,fathe azimuth frequency,ωrthe window function in range direction, ωathe window function
in azimuth direction, σ the amplitude of the echo, (r, x) the position of the scatter P, r the distance between the target P and the rail in vertical direction, andx the distance between the point P and the radar sensor in horizontal direction.
To analyse the echo’s phase in detail, the above equation is described in the following Taylor form.
s0(fr, fa) = σ·ωr(fr)ωa(fa) exp
−j2πfax
v
exp
−j4πrγ(fa, v) λ −j
4πr
cγ(fa, v)fr+j
πrcfa2fr2
2v2f3
cγ3(fa, v) −j
πrcfa2fr3
2v2f4
cγ5(fa, v)
(5)
where γ(fa, v) represents a multivariable function with two-variable input, the azimuth frequency and
radar sensor’s speed.
From the equation, it can be seen that the first phase represents the scatter’s amplitude. The second phase is related with azimuth frequency fa, and it can be compensated by the correction function in
azimuth direction.
Meanwhile, the third phase is coupled in range direction and azimuth direction with the multiplication of fr and γ(fa, v). It can be compensated by range migration correction.
Similarly, the fourth phase of the echo can be compensated by the second range compression, and the last phase can be compensated by using the following filter.
H3phase= exp j πrcf
2
afr3
2v2f4
cγ5(fa, v)
(6)
Through this SAR imaging method, target in the monitored region can be focused in the image by the GBSAR. Meanwhile, it is complicated and needs complex computing producer. Thus, two separated imaging producers were used in the experiment. The first phase compensation producer can remove the phase error caused by azimuth frequency. It is equivalent to the producer of removing the second phase. The second phase compensation producer can remove the phase error caused by range frequency. It is equivalent to the function of removing the third and fourth phases.
4. SAR IMAGING IN LAND-SLIDE MONITORING
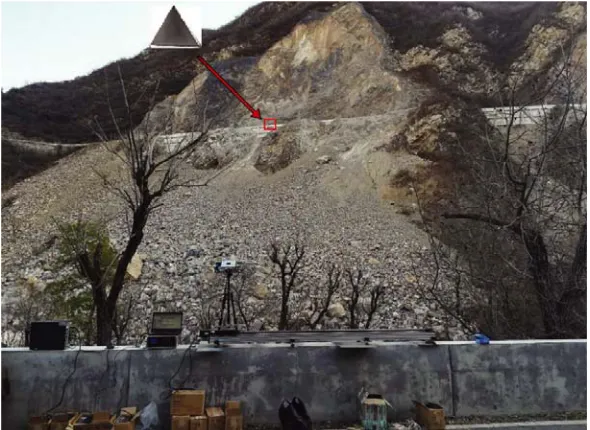
Based on above analysis, GBSAR can be used to monitor the landslide’s scatter’s deformation. Thus, it can be used in landslide monitoring. To prove the measure ability of the system, a corner reflector was used in this experiment. It can be used as an effective scatter. The setup is shown in Fig. 3.
separated SAR imaging procedures. To ensure the accuracy of the trihedral position, a vernier calliper was used in the experiment. The radar’s antenna was directed to the trihedral with a little slant angle
φ, which is 3.8◦. As shown in Fig. 1, the radar was moved from left to right, and the trihedral was recognized as a point scatter in the monitoring region. Simultaneously, the radar antenna’s beam angle is 4◦ in horizontal direction, which is symbolled as θ in Fig. 1. Meanwhile, the beam angle in vertical direction is 10◦. Thus, the monitored region is limited by the radar antenna. In the experiment, we can only monitor nearby region around the trihedral at each imaging time. If we want to measure other areas, the slant angle of the antenna should be changed.
From Fig. 3, it is shown that the corner reflector was used in the experiment as a scatter point. By monitoring the corner reflector’s deformation, the micro-deformation monitor method can be verified.
Figure 3. Experiment scenario.
In the SAR imaging experiment, the radar’s velocity v is 0.015 m/s, and the monitored time Δtis 140 seconds in each SAR imaging procedure. Thus, the monitored region’s length L is 2.1 meters in azimuth direction. It can be acquired by the flowing equation.
L=v∗Δt (7)
Simultaneously, the radar’s imaging resolution δR in range direction is 0.5 m, which can be calculated by the radar microwave’s bandwidth B (300 MHz) and the speed of light c (3×10⁸m/s). Their relationship can be depicted as in the following equation.
δR= c
2B (8)
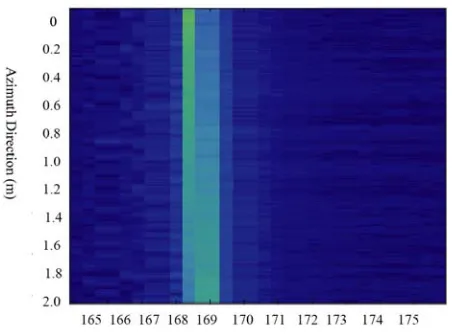
Thus, one range bin is 0.5 m in length for the SAR images. From the propagation time of the echo, we can acquire the target’s distance with a high precision. In the following image, we describe the echo’s intensity of the imaging region around the corner reflector. After range compression, echo of the corner reflector was focused in some range bins near 169 meters far from the radar.
From Fig. 4, it is seen that the distance between the corner reflector and the radar sensor is about 168.5 meters. To analyse the experiment result, echo intensity of the trihedral in azimuth direction is illustrated in Fig. 5.
Figure 4. Echo intensity after range compression.
Figure 5. Echo in azimuth direction after range compression.
error caused by the slant angle should be corrected. After correction in azimuth direction, the corner reflector’s echo intensity in azimuth direction can be transformed into a new one as shown in Fig. 6.
Obviously, echo intensity of the corner reflector is similar to a sinc function. Thus, the echo after phase correction in azimuth direction can be used by normal range doppler algorithms. After RD imaging, the corner reflector is shown in Fig. 7.
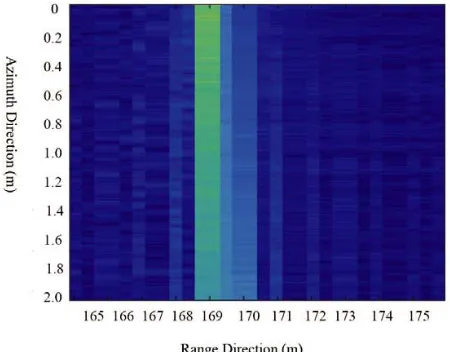
It can be seen that the corner reflector is oriented in the center of the image after phase correction in azimuth direction by removing the doppler frequency shift of the echo. Meanwhile, the image is defocused in range direction. It exists in two neighboring range bins. The phenomenon is consistent with the above analysis. If we want to acquire the right SAR image of the trihedral, correction in range direction for the echo should be used. After the correction, echo intensity of the trihedral is shown in Fig. 8.
From Fig. 8, it is found that the corner reflector’s echo is focused in one range bin, showing that the defocus problem caused by the squint angel can be solved by phase compensation in range direction. If we use a normal azimuth filter to process the corrected data, the corner reflector is shown in Fig. 9.
Figure 6. Echo in azimuth direction after phase correction.
Figure 7. Imaging result after phase correction in azimuth direction.
Figure 9. Imaging result after phase correction in range direction.
5. DEFORMATION RETRIEVE IN LAND-SLIDE MONITORING
After acquiring SAR image of the monitored region, interferometric image can be formed to acquire phase error of the scatter in the image to estimate the micro deformation of the target.
Firstly, two images of the monitored region were acquired when the scatter point moved before and after having a micro-deformation of 1 mm. Then, interferometric image was formed by the two different SAR images. Lastly, phase in azimuth profile was described at the right distance of the corner reflector in range direction, where the scatter point’s amplitude is the largest, and the phase at this point is the scatter’s interferometric phase. Then micro-deformation of the scatter can be acquired by the flowing equation.
Δφ= 4π
λ Δr (9)
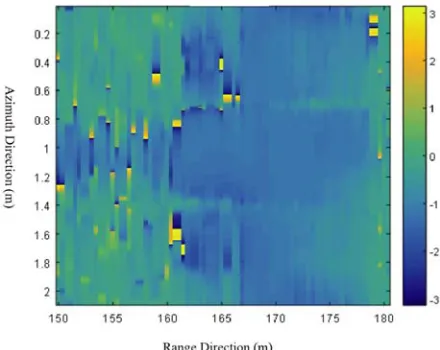
where Δr is the micro-deformation of the scatter, and Δφ is the interferometric phase of the scatter. The interferometric image of the experiment is shown in Fig. 10.
Figure 10. Interferometric image.
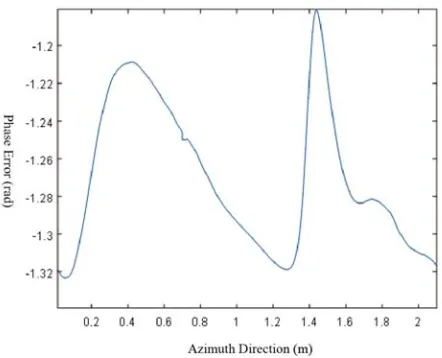
Figure 11. Phase of the scatter in azimuth direction.
From Fig. 11, it is obvious that the interferometric phase of the scatter is about −1.26. From Equation (9), it can be seen that the micro-deformation of the scatter is about 1 mm. It is consistent with the real deformation set in the experiment. Thus, the GBSAR system can acquire micro-deformation of scatters in landslide monitoring with a high precision. It has a wide application prospect in the future.
6. CONCLUSION
A novel SAR imaging algorithm originated from the conventional range doppler algorithm is introduced and implemented in the paper to solve the image defocus problem in GBSAR imaging with a squint angle. The proposed algorithm is proposed by compensating the phase error in azimuth direction and range direction, respectively. Experiments results verify that the proposed algorithm is effective in landslide monitoring. It can be used to image scatters which are far away from the radar sensor in azimuth direction.
ACKNOWLEDGMENT
This work was supported in part by the Beijing Natural Science Foundation under Grant 4182077 and China Postdoctoral Science Foundation under Grant 2017M620918.
REFERENCES
1. Monserrat, O., M. Crosetto, and G. Luzi, “A review of ground-based SAR interferometry for deformation measurement,”ISPRS Journal of Photogrammetry &Remote Sensing, Vol. 93, No. 7, 40–48, 2014.
2. Iglesias, R., A. Aguasca, X. Fabregas, et al., “Ground-based polarimetric SAR interferometry for the monitoring of terrain displacement phenomena — Part I: Theoretical description,” IEEE Journal of Selected Topics in Applied Earth Observation and Remote Sensing, Vol. 8, No. 3, 980–993, 2015. 3. Iglesias, R., A. Aguasca, X. Fabregas, et al., “Ground-based polarimetric SAR interferometry for the monitoring of terrain displacement phenomena — Part II: Applications,” IEEE Journal of Selected Topics in Applied Earth Observation and Remote Sensing, Vol. 8, No. 3, 994–1007, 2015. 4. Luzi, G., O. Monserrat, M. Crosetto, et al., “Ground-based SAR interferometry applied to landslide
5. Nico, G., L. Borrelli, and A. Pasquale, “Monitoring of an ancient landslide phenomenon by GBSAR technique in the Maierato Town (Calabria, Italy),” Engineering Geology for Society and Territory, Vol. 2, 129–133, 2015.
6. Liu, X., X. Tong, K. Ding, et al., “Measurement of long-term periodic and dynamic deflection of the long-span railway bridge using microwave interferometry,”IEEE Journal of Selected Topics in Applied Earth Observation and Remote Sensing, Vol. 8, No. 9, 4531–4538, 2015.
7. Gentile, C., “Deflection measurement on vibrating stay cables by non-contact microwave interferometer,” NDT&E International, Vol. 43, No. 3, 231–240, 2010.
8. Liu, X., W. Chang, and Y. Guan, “Study of squint imaging algorithm for FMCW SAR,”
2016 Progress In Electromagnetic Research Symposium (PIERS), 1384–1388, Shanghai, China, August 8–11, 2016.
9. Liang, Y., H. Wang, M. Xing, et al., “Imaging study of high squint SAR based on FMCW,” IEEE 1st Asian and Pacific Conference on Synthetic Aperture Radar, Huangshan, China, 2007.
10. Chen, P. and J. Kiang, “An improved range-doppler algorithm for SAR imaging at high squint angles,” Progress In Electromagnetics Research M, Vol. 53, 41–52, 2017.
11. Yuan, Y., S. Chen, and H. Zhao, “An improved RD algorithm for maneuvering bistatic forward-looking SAR imaging with a fixed transmitter,” Sensors, Vol. 17, No. 5, 1152, 2017.
12. Zhou, Z., Y. Li, Y. Wang, et al., “Extended multiple aperture mapdrift based doppler parameter estimation and compensation for very high squint airborne SAR imaging,”Sensors, Vol. 19, No. 1, 213, 2019.
13. Xiao, J. and X. Hu, “ A modified RD algorithm for airborne high squint mode SAR imaging,”
IEEE 1st Asian and Pacific Conference on Synthetic Aperture Radar, Huangshan, China, 2007. 14. Bara, M., R. Scheiber, A. Broquetas, et al., “Interferometric SAR signal analysis in the presence of
squint,” IEEE Transactions on Geoscience and Remote Sensing, Vol. 38, No. 5, 2164–2178, 2000. 15. Shao, Z., X. Zhang, and Y. Li, “Analysis and validation of super-resolution micro-deformation
monitoring radar,”Progress In Electromagnetics Research M, Vol. 62, 41–50, 2017.
16. Qi, X., G. Sun, and Y. Wang, “An advanced range doppler algorithm for forward squint SAR,”