DIETARY DIVERSITY, NUTRIENT INTAKE AND NUTRITIONAL STATUS AMONG PREGNANT WOMEN IN LAIKIPIA COUNTY, KENYA
KIBOI WILLY KAHANYA (BSc.) H60/27145/2013
A RESEARCH THESIS SUBMITTED IN PARTIAL FULFILLMENT OF THE REQUIREMENTS FOR THE AWARD OF THE DEGREE OF MASTER OF
SCIENCE (FOOD, NUTRITION AND DIETETICS) IN THE SCHOOL OF APPLIED HUMAN SCIENCES OF KENYATTA UNIVERSITY
DECLARATION
This thesis is my original work and has not been presented for a degree in any other university or any other award.
Signature... Date... Kiboi Willy Kahanya (BSc) H60/27145/2013
SUPERVISORS:
We confirm that the work reported in this thesis was carried out by the candidate under our supervision.
Signature... Date... Prof. Judith Kimiywe (PhD)
Department of Food, Nutrition and Dietetics Kenyatta University
Nairobi, Kenya
Signature... Date... Peter M. Chege (PhD)
Department of Food, Nutrition and Dietetics Kenyatta University
DEDICATION
ACKNOWLEDGEMENT
I would like to give all glory to the Almighty God for His mercies and grace which has seen me this far.
There are many people to whom I am deeply grateful to. I acknowledge the support of my supervisors, Prof. Judith Kimiywe and Dr. Peter Chege for their sagacious guidance and support throughout the whole research process. I also extend my sincere gratitude to Kenyatta University for giving me an opportunity to pursue a Master of Science in Food, Nutrition and Dietetics. Special thanks to the Medical Superintendent and members of staff of Nanyuki Teaching and Referral Hospital for the support they accorded me during the study period. My appreciation also goes to my research assistants and participants without whom the research could not have succeeded.
My heartfelt gratitude’s also extended to my sisters, Jedidah, Phyllis and Ann for their unequivocal support and earnest prayers throughout my studies.
TABLE OF CONTENTS
DECLARATION... ii
DEDICATION... iii
ACKNOWLEDGEMENT ... iv
TABLE OF CONTENTS ... v
LIST OF TABLES ... x
LIST OF FIGURES ... xi
OPERATIONAL DEFINITION OF TERMS ... xii
ABBREVIATIONS AND ACRONYMS ... xiii
ABSTRACT ... xiv
CHAPTER ONE: INTRODUCTION ... 1
1.1Background of the Study ... 1
1.2Problem Statement ... 3
1.3Purpose of the Study ... 4
1.4Objectives of the Study ... 4
1.5Hypotheses of the Study ... 5
1.6Significance of the Study ... 6
1.7Delimitation of the Study ... 6
1.8Limitations of the Study ... 6
1.9Conceptual Framework ... 6
CHAPTER TWO: LITERATURE REVIEW ... 8
2.1 Nutrient Needs during Pregnancy ... 8
2.2 Dietary Diversity and Pregnancy ... 9
2.2.1 Measurement of Dietary Diversity... 11
2.4 Factors Influencing Dietary Diversity and Nutrient intake ... 12
2.4.1 Socio-economic Factors ... 12
2.4.2 Demographic Factors ... 13
2.4.3 Morbidity Patterns ... 13
2.5 Maternal Nutritional Status during Pregnancy ... 14
2.6 Summary of Literature Review ... 15
CHAPTER THREE: METHODOLOGY ... 17
3.1 Research Design... 17
3.2 Research Variables... 17
3.2.1 Independent Variables ... 17
3.2.2 Dependent Variables ... 17
3.3 Study Area ... 17
3.4. Target Population ... 18
3.4.1 Accessible Population ... 18
3.4.2 Inclusion Criteria ... 18
3.4.3 Exclusion Criteria ... 18
3.5 Sampling Technique ... 19
3.6 Sample Size Determination... 19
3.7 Research Instruments ... 19
3.8 Pretesting of Data Collection Tools ... 20
3.8.1 Validity of the Tools ... 20
3.8.2 Reliability of the Tools ... 21
3.9 Training of Research Assistants... 21
3.10 Data Collection Procedures ... 21
3.10.2 Dietary Diversity and Nutrient Intake... 22
3.10.3 Nutritional Status of the Respondents... 23
3.10.4 Qualitative Data ... 24
3.11 Data Analyses ... 24
3.12 Logistical and Ethical Considerations ... 26
CHAPTER FOUR: RESULTS ... 27
4.0 Introduction ... 27
4.1 Description of the Study Population ... 27
4.1.1 Demographic Characteristics. ... 27
4.1.2 Socio-economic Characteristics of the Study Population ... 30
4.2 Individual Dietary Diversity Score ... 38
4.2.1 Consumption of Foods by Respondents Based on Food Groups ... 39
4.2.2 Maternal Perception towards Dietary Diversity based on Qualitative data from FGDs ... 41
4.2.3 Findings of Key Informant Interviews (KII) on Dietary Diversity among Pregnant Women ... 43
4.3 Dietary Intake of Selected Nutrients among the Pregnant Women ... 43
4.4 Maternal Health Profile... 45
4.4.1 Antenatal Clinic Attendance among the Pregnant Women ... 45
4.4.2 Micronutrient Supplementation among the Mothers ... 45
4.4.3 Maternal Morbidity Pattern... 47
4.5 Nutritional Status of the Respondents... 48
4.5.1 Nutritional Status Based on MUAC ... 48
4.5.2 Nutrition Status Based on Haemoglobin Values ... 49
4.6 Relationship between Study dependent and Independent Variables ... 50
4.6.2 Relationship between Dietary Diversity and Maternal Socio-Economic
Characteristics ... 51
4.6.3 Relationship between Dietary Diversity and Respondents Nutrient Intake ... 53
4.6.4 Relationship between Dietary Diversity and Respondents Morbidity Patterns ... 54
4.6.5 Relationship between Dietary Diversity and Respondents Nutritional Status... 55
CHAPTER FIVE: DISCUSSION ... 57
5.1 Introduction ... 57
5.2 Demographic and Socio-Economic Characteristics of the Respondents ... 57
5.3 Dietary Diversity of the Mothers ... 58
5.4 Nutrient Intake of the Pregnant Women ... 59
5.5 Maternal Health Profile... 60
5.5.1 ANC Attendance ... 60
5.5.2 Micronutrient Supplementation among the Women ... 61
5.5.3 Maternal Morbidity Patterns ... 61
5.6 Nutritional Status of the Mothers ... 62
5.7 Relationship between Dietary Diversity and Demographic and Socio-Economic Factors among the Pregnant Women ... 63
5.8 Relationship between Maternal Dietary Diversity and Nutrient Intake ... 65
5.9 Relationship between Maternal Dietary Diversity and Morbidity Pattern ... 66
5.10 Relationship between Dietary Diversity and Nutritional Status of the Women ... 66
CHAPTER SIX: SUMMARY, CONCLUSION AND RECOMMENDATIONS ... 68
6.0 Introduction ... 68
6.1 Summary of the Findings ... 68
6.2 Conclusion of the Study ... 69
6.3 Recommendations of the Study ... 70
6.3.2 Recommendation for Practice ... 71
6.3.3 Recommendation for Further Research ... 71
REFERENCES ... 73
APPENDICES ... 84
APPENDIX A: LETTER OF INTRODUCTION AND CONSENT ... 84
APPENDIX B: RESEARCHER ADMINISTERED QUESTIONNAIRE ... 90
APPENDIX C: KEY INFORMANT INTERVIEW SCHEDULE ... 113
APPENDIX D: FOCUS GROUP DISCUSSION GUIDE ... 114
APPENDIX E: MAP OF LAIKIPIA COUNTY, KENYA ... 116
LIST OF TABLES
Table 4.1: Demographic characteristics of the respondents ... 28
Table 4.2: Respondents education and occupation ... 30
Table 4.3: Major sources of income and decision maker on income use among the respondents households ... 33
Table 4.4: Respondents household livestock ownership ... 35
Table 4.5: Land size, ownership status and main source of family food of the respondents ... 36
Table 4.6: Housing, lighting, fuel and source of water among the respondents households ... 38
Table 4.7: Number of respondents who consumed each food group ... 41
Table 4.8: Nutrient intake of selected nutrients among the respondents ... 44
Table 4.9: Micronutrient supplementation intake among the respondents ... 46
Table 4.10: Maternal morbidity of the respondents in the past two weeks ... 47
Table 4.11: Nutritional status by MUAC of respondents ... 48
Table 4.12: Nutritional status (MUAC) by age of respondents ... 49
Table 4.13: Nutritional status by haemoglobin levels of the respondents ... 49
Table 4.14: Nutritional status (Hb) by age of respondents ... 50
Table 4.15: Relationship between dietary diversity and demographic factors of the respondents ... 51
Table 4.16: Association between dietary diversity and socio-economic characteristic of the respondents... 52
Table 4.17: Relationship between dietary diversity and respondents nutrient intake ... 54
Table 4.18: DDS mean difference by nutritional status (MUAC) of the respondents ... 55
LIST OF FIGURES
Figure 1.1: Conceptual framework on factors influencing maternal dietary diversity,
nutrient intake and nutritional status. ... 7
Figure 3.1 Flow chart on the sampling procedure ... 19
Figure 4.1 Respondents household monthly income ... 32
Figure 4.2 Household assets of the respondents ... 34
Figure 4.3 Individual dietary diversity score terciles... 39
Figure 4.4 Consumption of foods by respondents based on food groups ... 40
OPERATIONAL DEFINITION OF TERMS
Dietary diversity: the number of different foods or food groups consumed over a given reference period which in this study was 24 hours.
Dietary diversity score: the sum total of the number of food groups consumed over a reference period of 24 hour by an individual relative to a scale of 14 food groups (Cereals, vitamin A rich vegetables and tubers, dark green leafy vegetables, other vegetables, white roots and tubers, vitamin A rich fruits, other fruits, flesh meat, organ meat, eggs, fish, pulses/legumes, nuts and seeds, milk and milk products, oils and fats) which were used in the study (FAO, 2008).
Morbidity Pattern: In this study was presence of illness/disorder and its duration among the pregnant women two weeks prior to the day of interview.
Nutrient intake: the intake of energy, macronutrients and micronutrients (carbohydrates, protein, fat, zinc, iron, folate, calcium, vitamin C and A).
ABBREVIATIONS AND ACRONYMS
ASAL : Arid and Semi Arid Land ANC : Antenatal Clinic
ANOVA : Analysis of Variance BMI : Body Mass Index
CSPRO : Census and Survey Processing DDS : Dietary Diversity Score
FAO : Food and Agriculture Organization FGD : Focus Group Discussion
HB : Haemoglobin
GOK : Government of Kenya
IDDS : Individual Dietary Diversity Score KDHS : Kenya Demographic and Health Survey KNBS : Kenya National Bureau of Statistics MOH : Ministry of Health
MUAC : Mid Upper Arm Circumference RNI : Recommended Nutrient Intake
SES : Socio-Economic Status
SPSS : Statistical Package for Social Sciences
SD : Standard Deviation
ABSTRACT
CHAPTER ONE: INTRODUCTION 1.1 Background of the Study
Good nutrition is considered as a paramount component of health and development (Vakili et al., 2013). Moreover, the growth and prosperity of a nation is highly dependent on the nutritional status of women of the reproductive age since they influence growth of the remaining population (Choudhary et al., 2010). In that view, pregnancy has over time been considered as a critical period during which good maternal nutrition is a key determinant of the health of both child and mother (Popa et al., 2013; Sajjad & Khan, 2012). According to World Health Organization (2012), good nutrition during pregnancy is related to proper infant growth, maternal and child health, healthier pregnancy and delivery and lower risk of chronic diseases.
Dietary diversity refers to the number of different foods or food groups consumed over a given reference period (Swindale & Bilinsky, 2006). The value of a diverse diet has long been recognized and is considered as a key element of high quality diet (Arimond & Ruel, 2004; Jayawardena et al., 2013). Kennedy et al. (2009) argues that a sufficiently diverse diet reflects nutrient adequacy since no single food contains all the required nutrients for optimal health. In this regard, Labadarios et al. (2011) noted that the more food groups included in a person’s daily diet the greater the likelihood of meeting their nutrient requirements. A variety of foods in the diet is therefore considered imperative in ensuring an adequate intake of essential nutrients (Drimie et al., 2013).
In most developing countries micronutrients malnutrition is still a major problem of public health attention due to intake of monotonous, cereal-based diets that lack diversity (Kennedy et al., 2007; Ruel, 2003). Most diets in developing countries lack vegetables, fruits and animal source foods (Daniels, 2009). According to Arimond et al. (2010) women of reproductive age are the most vulnerable to suffer from these deficiencies particularly those from resource poor settings. Pregnant women specially are at a higher risk due to their increased nutrient needs (Lee et al., 2013).
has been reported to be a major problem throughout the world, particularly the developing countries (Alene & Dohe, 2014; Rodriguez-Bernal et al., 2012; Vivek et al., 2012). Similarly, more than 7.2 million pregnant women have been reported to be suffering from vitamin A deficiency (Abebe et al., 2014). In Kenya, according to the 1999 National Micronutrient Survey Report, 55.1 percent of pregnant women are anaemic due to iron deficiency (GOK, 1999; WHO, 2016). To overcome nutritional problems resulting from inadequate intake of micronutrients, food based strategies such as dietary diversification have been recommended (Kennedy, 2009). In Kenya, just as in most developing countries information about dietary diversity is scanty. This study therefore sought to investigate dietary diversity, nutrient intake and nutritional status of pregnant women in Laikipia County. The study also focused on the factors influencing dietary diversity and nutrient intake among the pregnant women.
1.2 Problem Statement
Adequate nutrient intakes among women of reproductive age are important determinants of maternal and child health outcomes (Nguyen et al., 2013). According to Black et al.
(2008), deficiencies in micronutrients such as folate, zinc, iron, vitamin A, B6, B12, C, E and riboflavin are highly prevalent and may occur concurrently among pregnant women. Further, micronutrient deficiencies are said to be widely spread among women and children in developing countries (Allen, 2014). This may be due to poor dietary habits.
During pregnancy, this under nutrition has resulted to one in ten new born in Kenya being a low birth weight (<2500g) infant (Kenya National Bureau of Statistics (KNBS) and ICF Macro, 2010). Despite the importance of dietary diversity being well acknowledged, there is paucity of scientific data in Kenya on dietary diversity, nutrient intake and nutritional status of pregnant women in arid and semi-arid land (ASAL) areas and more so in Laikipia County. Laikipia County is an ASAL in Kenya, with frequent drought which increases vulnerability of the resident pregnant women.
Furthermore, as rightly noted by Rashid et al. (2011), most studies have been focusing on dietary quantity at the expense of dietary quality. Dietary diversity, a component of dietary quality has received little attention and therefore merits further research especially in developing countries where dietary diversity is rarely reported. To address this gap, this study aimed at determining dietary diversity, nutrient intake and nutritional status among pregnant women in Laikipia County.
1.3 Purpose of the Study
The purpose of this study was to assess dietary diversity, nutrient intake and nutritional status among pregnant women in Laikipia County.
1.4 Objectives of the Study
The specific objectives of this study were to;
2. Assess dietary diversity and nutrient intake among pregnant women in Laikipia County.
3. Assess the morbidity patterns among pregnant women in Laikipia County.
4. Assess the nutritional status among pregnant women in Laikipia County.
5. Establish the relationship between dietary diversity and maternal demographic factors, socioeconomic characteristics, nutrient intake and nutritional status among pregnant women in Laikipia County.
1.5 Hypotheses of the Study
This study tested the following hypotheses;
H01: There is no significant relationship between maternal demographic factors, socio-economic status and dietary diversity of the pregnant women.
H02: There is no significant relationship between dietary diversity and nutrient intake of the pregnant women.
H03: There is no significant relationship between dietary diversity and maternal morbidity patterns of the pregnant women.
1.6 Significance of the Study
The findings of this study are useful to the Ministry of Health (MOH) and other stakeholders by providing important information needed in designing appropriate interventions to improve maternal nutrition. This study also makes an important empirical contribution to the growing body of literature on dietary diversity, nutrient intake and their associated factors among pregnant women and its influence to their nutritional status.
1.7 Delimitation of the Study
Since the study was conducted in one county, generalization to other counties, country or region should be made with utmost caution due to demographic and ecological variations.
1.8 Limitations of the Study
The data was collected from a cross-sectional study and therefore may not reveal whether the reported Dietary Diversity Score (DDS) values varies over time (Gibson, 2005). To minimise this limitation, Focus Group Discussions (FGDs) were used to solicit information on dietary consumptions at different times of the year.
1.9 Conceptual Framework
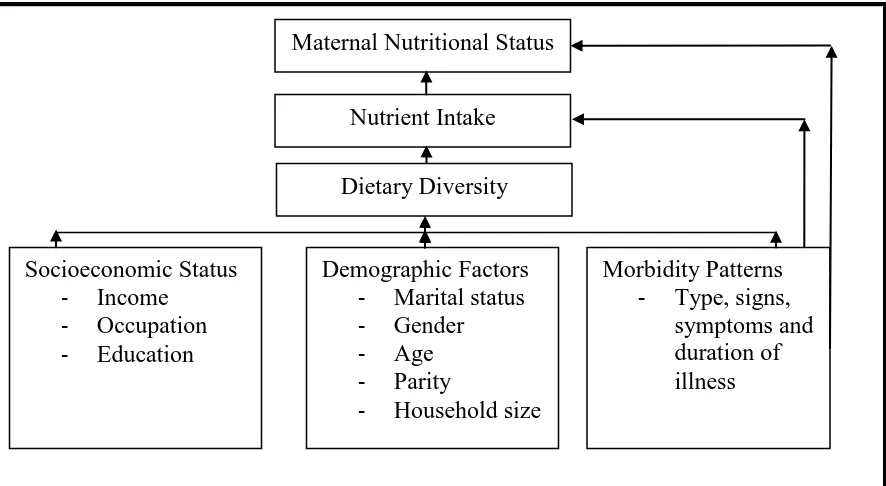
Figure 1.1: Conceptual framework of factors influencing maternal dietary diversity, nutrient intake and nutritional status.
Source: Adapted and modified from UNICEF (2009).
Figure 1.1 illustrates the various factors that influence maternal nutrient intake and nutritional status. Nutrient intake is an important factor that determines the nutritional status of a person. During pregnancy, a good nutritional status is strongly associated with healthy birth outcomes. Dietary diversity affects nutrient intake (Figure 1.1) since a diversified diet is positively correlated with nutrient adequacy. However, nutritional status, dietary diversity and nutrient intake may be directly affected by individual health factors such as morbidity patterns. Illness affects food intake, absorption and utilization of nutrients. Similarly, dietary diversity is also influenced by demographic factors such as maternal age, gender, household size and parity. Socio-economic factors such as income, occupation and education are also known to influence dietary diversity as shown in figure 1.1.
Maternal Nutritional Status
Nutrient Intake Dietary Diversity
Socioeconomic Status - Income
- Occupation - Education
Demographic Factors - Marital status - Gender
- Age
- Parity
- Household size
Morbidity Patterns - Type, signs,
CHAPTER TWO: LITERATURE REVIEW 2.1 Nutrient Needs during Pregnancy
Adequate nutrient intake is needed to ensure healthy birth outcomes (Saaka, 2013). Compelling evidence suggest that nutrient intake during pregnancy has a critical role in foetal development and therefore maternal diets needs to provide nutrients for both the mother and the foetus (Cheng et al., 2009). Macro and micronutrients such as carbohydrates, protein, fat, zinc, iron, folate, calcium, vitamin C and A are some of the nutrient which are stated to be of specific concern during pregnancy (Black et al., 2008).
Pregnant women are vulnerable to nutritional inadequacies due to their elevated nutrient needs (Lee et al., 2013). According to Arimond et al. (2010), the high nutrient demand during pregnancy has put women in developing countries at a high risk since poor dietary intakes have been reported. Poor nutrient intake during pregnancy have been associated with adverse birth outcomes such as permanent damage to the foetus, pre-term delivery, poor infant survival and increased risk of chronic diseases in later life (Ahmed & Tseng, 2013; Blumfield et al., 2012; Imdad & Bhutta, 2011; Sullivan et al., 2009). Additionally, some micronutrient deficiencies in pregnancy, such as iron and calcium deficiencies have been cited to cause substantial maternal deaths ( Black et al., 2013).
of maternal morbidity and mortality such as anaemia, obstructed labour, postpartum haemorrhage and infections among others. Also, limited availability of high quality food and poor dietary habits in developing and developed countries respectively have been associated with these problems (Radlowski & Johnson, 2013). Despite the evidence on the relationship between maternal nutrient intake and birth outcomes, there is limited data on nutrient intake among pregnant women in Kenya and more so in ASAL areas. This study therefore sought to establish the nutrient intake among pregnant women in Laikipia County.
2.2 Dietary Diversity and Pregnancy
Dietary diversity is defined as the number of different food groups or foods that are consumed over a specific reference period (Ruel, 2002). The value of a diverse diet has over time been recognized (Kadiyala & Rawat, 2013; Rathnayak et al., 2012), since it can provide a wide range of nutrients which enhances the nutritional quality of the diet (Fujita et al., 2012). All people therefore need a variety of foods to meet requirements for essential nutrients (Drimie et al., 2013; Hoddinott & Yohannes, 2002).
adequacy was observed in a research on women of reproductive age living in Mali, Mozambique, Bangladesh, Burkina Faso, and the Philippines (Arimond et al., 2010). In their study, Acham et al. (2012) also noted a strong relationship between dietary diversity and micronutrient intake among women in an informal settlement of South Africa. Based on the above arguments, a diverse diet is therefore paramount in meeting the nutrient requirements of a person and more so to those considered vulnerable to nutrient deficiencies such as the pregnant women. Ruel (2003) noted that in developing countries lack of dietary diversity is a major problem since the diet is predominantly cereal based. The diets are considered monotonous and are comprised of little or no animal products, fruits and vegetables (Kennedy et al., 2007; Leyna et al., 2010).
2.2.1 Measurement of Dietary Diversity
Dietary diversity is measured by summing up the number of foods or food groups consumed over a reference period (Vakili et al., 2013; Ruel, 2002). Dietary diversity score has been defined as the total count of different food groups irrespective of the amounts consumed by individuals over a specific period of time (Jayawardena et al., 2013). According to Taruvinga et al. (2013), a reference period of one to three days is usually used though a period of seven days has often been used (FAO, 2011). In some instances, a period of up to 15 days has also been reported (Drewnowski et al., 1997). Notably, dietary diversity instruments (dietary diversity score or food variety score) have become the most preferred method of assessing dietary adequacy in developing countries (Hooshmand and Udipi, 2013). Moreover, single food or food group count have been the most popular methods for measuring dietary diversity (Pellegrini & Tasciotti, 2014). This is because the measurements are simple to collect and easily adopted in different settings (Daniels et al., 2009).
2.3 Nutrient Intake and Individual Dietary Diversity during Pregnancy
maternal deaths (Black et al., 2013). Adequate nutrient intake among pregnant women is therefore important for maternal and child health (Lee et al., 2013). This study sought to establish the relationship between dietary diversity and nutrient intake among pregnant women in Kenya.
2.4 Factors Influencing Dietary Diversity and Nutrient intake 2.4.1 Socio-economic Factors
A number of studies have shown that dietary diversity is associated with socio-economic status (SES) (Savy et al., 2005; Torheim et al., 2004). Rashid et al. (2011) and Thorne-Lyman et al. (2010) found that dietary diversity is strongly associated with SES of a household. Similarly, Brinkman et al. (2010) in their study discussed that families with more income and resources had a more diversified diet. A study in Burkina Faso on women also found that those who were wealthier and with higher education had a higher DDS (Savy et al., 2008). Literature furthermore suggests that individuals with lower incomes and less education have been reported to be more likely to have poorer diets than those individuals with more income and education (Silk et al., 2008). This could be because a healthy diet which consist of a diversified diet is said to be more expensive than a less healthy diet (Morris et al., 2014).
al. (2007) revealed that consumption of varied vegetables was influenced by occupation and income levels. According to Ihab et al. (2012), availability and access to food is prohibited by high food prices and scarce resources resulting in inadequate quantity and poor quality diets in the household. Nonetheless, there is paucity of data on the relationship between socio-economic factors and dietary diversity among pregnant women living in ASAL.
2.4.2 Demographic Factors
Factors such as age, parity, household size, marital status, gender among others have been found to influence dietary diversity. A study in Botswana showed that older adults consume a diet low in variety with inadequate animal products, fruits and vegetables (Clausen et al., 2005). Age therefore is a determining factor of nutrient intake. According to Taruvinga et al. (2013), female-headed households have a higher probability of achieving a high dietary diversity than the male-headed households. This is in agreement with a study in 1996 by Rogers which noted that female headed households spent more on higher quality foods. In 2003, Thiele and Weiss in Germany also reported that age, sex, household size, employment status and level of education were the strongest determinants of dietary diversity. The association between dietary diversity and demographic characteristics is still less documented.
2.4.3 Morbidity Patterns
(1998) described morbidity as being one of the immediate causes of malnutrition in individuals. It affects food intake, absorption and utilization of nutrients resulting in poor nutritional status. According to Pieters et al. (2013), an individual’s health affects their ability to absorb nutrients. Antenatal care (ANC) has been cited as one of the best strategies in early detection of complications that might affect pregnancy. Antenatal care is said to serve as a key entry point for implementing nutrition and health interventions that would improve maternal and child nutrition (Perumal et al., 2013). This study sought to establish the relationship between morbidity pattern and nutritional status of pregnant women in Laikipia County.
2.5 Maternal Nutritional Status during Pregnancy
According to Bhutta et al. (2013) maternal under-nutrition contributes to 800,000 neonatal deaths globally annually through small for gestational age births. This maternal under-nutrition has also been stated to increase disease risk in the offspring even in later life (Ferreira et al., 2009; Ahmed & Tseng, 2013). Literature furthermore indicates that the effects of pre-pregnancy Body Mass Index (BMI) on pregnancy outcome have continued to gain widespread attention (Yu et al., 2013). In Kenya, there is paucity of scientific information on the relationship between dietary diversity and the nutritional status of pregnant women and more so among those living in ASAL.
In assessing pregnant women nutritional status, methods such as the use of anthropometrics, biochemical methods, clinical methods and dietary intake assessments has been used (Gibson, 2005). According to De et al (2009) anthropometric measurements are the most frequently used methods. The methods are considered effective and most appropriate in the promotion of women’s health. In developing countries the use of BMI in assessing nutritional status among pregnant women has been restrained since most women attend their antenatal clinic late and thus their pre-pregnancy BMI may remain unknown (Kruger, 2005). In this study, mid upper arm circumference (MUAC) and haemoglobin levels (Hb) were used.
2.6 Summary of Literature Review
CHAPTER THREE: METHODOLOGY 3.1 Research Design
The study adopted a cross-sectional analytical design. The design is effective in collecting both qualitative and quantitative data (Mugenda & Mugenda, 2003). The design was also appropriate as it enabled gathering of information at one point in time and identification of associations between the various variables.
3.2 Research Variables 3.2.1 Independent Variables
Socio-economic status, demographic factors, morbidity patterns and dietary diversity were the independent variables for this study.
3.2.2 Dependent Variables
The dependent variables for this study were nutrient intake and maternal nutritional status (MUAC and Hb).
3.3 Study Area
Housing Census, the population for the county stood at 399,227 people. The approximate population of Laikipia-East Sub County is 116,562 people.
3.4. Target Population
The study target population comprised of all pregnant women in Laikipia County.
3.4.1 Accessible Population
The accessible population included all the pregnant women attending the antenatal clinic at Nanyuki Teaching and Referral Hospital at the time of data collection.
3.4.2 Inclusion Criteria
All pregnant women who consented to participate in the study and who had been residents of Laikipia County for at least one year prior to the period of the study were included. One year was appropriate as it covered the whole food security cycle.
3.4.3 Exclusion Criteria
3.5 Sampling Technique
Nanyuki Teaching and Referral Hospital had been purposively selected since it is the referral and main hospital in the area. Comprehensive sampling was used to select the respondents as they arrived in the hospital for their antenatal clinic (Figure 3.1).
3.6 Sample Size Determination
Nanyuki Teaching and Referral Hospital records indicated that antenatal clinic attendance was by an average of 237 pregnant women per month. Based on this, a comprehensive sample (100%) in a period of one month was used. A comprehensive sample is used when the number of units are small (Ary et al., 2013). One month was appropriate since ANC attendance in the hospital was on monthly basis.
3.7 Research Instruments
A researcher administered questionnaire (Appendix B) was used to collect data on socio-economic and demographic characteristics, nutrient intake, dietary diversity, morbidity
Figure 3.1: Flow chart on the sampling procedure Laikipia County (Purposive sampling)
Nanyuki Teaching and Referral Hospital (Purposive sampling)
patterns and nutritional status. Key informant interviews schedules (Appendix C) and Focused group discussion guides (Appendix D) were used to solicit qualitative data on maternal nutrition perceptions. The socio-economic and demographic data collected was; age, marital status, level of education, occupation, income level, parity, trimester, household head, household sex and household size. Dietary diversity data was collected using a modified individual dietary diversity questionnaire as recommended by FAO 2008.
3.8 Pretesting of Data Collection Tools
The tools were pre-tested before the study on 24 respondents (10% of the expected sample size) to establish whether the tools could generate the information needed and with precision. This was done to check the length, content, wording and language of the tools. The pre-test was conducted at Nanyuki Teaching and Referral Hospital. The respondents who were used in the pretesting were not sampled for the actual data collection. After the pre-test, adjustments were done accordingly to enhance reliability and validity of the tools.
3.8.1 Validity of the Tools
3.8.2 Reliability of the Tools
The test-retest method was used to test the consistency of the data collection tools within a span of one week between the interviews. The test retest was done on 24 respondents which was 10% of the expected sample size. Correlation coefficient was determined between the two sets of results and a correlation coefficient of 0.92 was obtained. According to Cronbach and Shavelson (2004) a coefficient correlation of above 0.70 is considered as an acceptable threshold. Respondents were also allowed to make comments and give suggestions concerning the tools.
3.9 Training of Research Assistants
Five research assistants with a minimum of a diploma in nutrition were recruited and trained as research assistants for four days. They were extensively trained on ethical issues, purpose and objective of the study. In addition, they were trained on how to use the data collection research tools, taking anthropometric measurements, interviewing skills and expectations from each question.
3.10 Data Collection Procedures
3.10.1 Demographic, Socio-Economic and Morbidity Data
A semi-structured questionnaire (Appendix B) was used for collecting data on demographic and socio-economic characteristics of the study subjects. A two week recall period was used to gather information on morbidity pattern and experience among the study respondents.
3.10.2 Dietary Diversity and Nutrient Intake
Nutrient intake information was generated using 24 hour recall dietary assessment. The 24-hour dietary recall was done to capture detailed and comprehensive information about all foods and beverages the respondent consumed. Food models, pictures, household utensils and other visual aids were used to help respondents judge and report on portion sizes. The time of food consumption was also recorded. A reference period of 24 hour was used in this study as it minimized the recall bias thus improving on accuracy.
The 24 hour dietary recall involved asking the respondents to enumerate all the foods and beverages consumed in previous day from the time they woke up in the morning, throughout the day to the time they went to sleep at night indicating clearly the time the food was consumed. Thorough probing was done to ensure that no food consumed was forgotten. The 24-hour dietary recall was considered to be useful in determining the average intake of energy and nutrients for the respondents.
diversity (FAO, 2008). In assessing dietary diversity, a scale of sixteen food groups; cereals, vitamin A rich vegetables and tubers, dark green leafy vegetables, other vegetables, white roots and tubers, vitamin A rich fruits, other fruits, flesh meat, organ meat, eggs, fish, pulses/legumes, nuts and seeds, milk and milk products, oils and fats, sweets and sugar and condiments and spices was used.
3.10.3 Nutritional Status of the Respondents.
Anthropometric measurements mid upper arm circumference (MUAC) were taken to assess the subject nutritional status. A standard adult MUAC tape was used and the measurements were taken on the less active arm with no clothing. Measurements were taken and recorded to the nearest 0.1 cm. For accuracy purposes, the measurements were taken twice and the average calculated. Additionally, respondent’s nutritional status was also assessed using haemoglobin (Hb) values. Haemoglobin tests were done following standard operating procedures by a qualified laboratory technologist on the same days of the interviews.
3.10.4 Qualitative Data
Key informant interviews were conducted using the interview schedule (Appendix C). The respondents included doctors, nurses and nutritionists. Information on maternal knowledge and attitude during pregnancy, nutritional problems faced in pregnancy and possible solutions was solicited. Focus group discussions (FGDs) (Appendix D) were also administered to elicit information on maternal nutrition perceptions. Four focused group discussions were conducted and each FGD comprised of 8-12 respondents who were randomly selected.
3.11 Data Analyses
Data on dietary intake from the 24 hour recall was entered and analysed using the Nutri-survey software. The nutrient intakes among the respondents were compared to the Recommended Nutrient Intakes (RNIs) to establish the percentage meeting the RNIs. To determine the DDS of the respondents, a point was awarded to each food group consumed over the reference period and a sum of all points was computed as recommended by FAO (2008). A scale of sixteen food groups (Cereals, vitamin A rich vegetables and tubers, dark green leafy vegetables, other vegetables, white roots and tubers, vitamin A rich fruits, other fruits, flesh meat, organ meat, eggs, fish, pulses/legumes, nuts and seeds, milk and milk products, oils and fats, sweets and sugar and condiments and spices was used.
sweets and sugar and condiments and spices) was used for analysis purposes (FAO, 2008). According to FAO (2008), those two food groups may be used for additional analysis and considerations of bioavailability of micronutrients but not part of the IDDS. The dietary diversity was assessed based on the number of food groups consumed over the immediate past 24 hours.
Using the fourteen food groups, dietary diversity terciles were established namely; low diversity tercile (≤ 3 food groups); medium diversity tercile (4 to 5 food groups) and high diversity tercile (≥6 food groups) (FAO, 2006; 2011). The respondent DDS was then assessed based on their position on the scale. Nutritional status was assessed using MUAC and Hb values. A MUAC value of less than 23cm was considered as under nutrition while that above 23 cm was considered normal for pregnant women (UNICEF, 2009; Ververs et al., 2013). Similarly pregnant women with Hb values of below 11.0 g/dl were considered anemic (UNICEF, 2001) while those above it were considered as having adequate nutritional status.
association between dietary diversity, demographic and socio-economic status of the respondents.
Moreover, T-test and Analysis of Variance (ANOVA) were used to test for significant differences in the mean DDS on different groups based on demographic and socioeconomic characteristics. Regression analyses were further carried out to determine the contribution of dietary diversity to nutrient intake and nutritional status. Qualitative data from key informant interviews and FGDs were transcribed and coded to show the emerging themes. Conclusions were drawn which were then triangulated with data from the questionnaire. A p-value of <0.05 was considered significant in all the analyses.
3.12 Logistical and Ethical Considerations
CHAPTER FOUR: RESULTS 4.0 Introduction
This chapter presents the study findings. Data on a comprehensive sample of 254 respondents was collected and reported. The results are organized as per the specific objectives of the study namely; demographic and socio-economic characteristics of the respondents, dietary diversity and nutrient intake among the respondents, morbidity patterns and nutritional status of the respondents. The results on the association between dietary diversity and demographic factors, socio-economic status, nutrient intake and nutritional status among the study respondents are also presented.
4.1 Description of the Study Population 4.1.1 Demographic Characteristics.
4.1.1.1 Age Distribution of the Respondents
Table 4.1 displays the demographic characteristics of the study respondents. The mean age of the pregnant women was 26.81 ± 5.64 years with the youngest and the oldest mothers being 16 and 49 years respectively. Most of the women (33.9%) were between the ages of 20-24 years while the age bracket of 45-49 years had the least number of respondents (0.8%).
4.1.1.2 Marital Status of the Respondents
Table 4.1: Demographic characteristics of the respondents
Category (n=254) n %
Age group(Years) 16-19 20-24 25-29 30-34 35-39 40-44 45-49
Mean age 26.81 ± 5.64 Marital status
Married Widowed Single
Parity of the respondents 1
2 3 >3
Mean parity 2 ± 2
Trimester of the respondents First
Second Third
Household characteristic Sex of the household head Male Female Household head Respondent Husband Relative
Others (Not related) Household size 1
2 3 >3
Mean size of household 3.02 ± 1.27
14 86 78 48 23 3 2 225 2 27 84 89 51 30 13 138 103 225 29 19 219 12 4 13 86 81 74 5.5 33.9* 30.7 18.9 9.1 1.2 0.8 88.6* 0.8 10.6 33.1 35.0* 20.1 11.8 5.1 54.3* 40.6 88.6* 11.4 7.5 86.2* 4.7 1.6 5.1 33.9* 31.9 29.1
4.1.1.3 Parity of the Respondents
The mean parity of the study population was 2 ± 2. Most mothers were primiparous (35%) followed closely by 33.1%, being primigravida. The rest of the study participants were multiparous (Table 4.1).
4.1.1.4 Gestation of the Women in Weeks
The mean gestational age at the time of examination was 27 ± 6.99 weeks. The gestation age ranged from 8 to 39 weeks. Slightly more than half of the respondents (54.3%) representing the majority were in their second trimester. Notably, only around 5.1% of the participants reported being in their first trimester.
4.1.1.5 Household Characteristics
Information on key aspects of the composition of households, such as the sex of the household head and the size of the household, is presented in Table 4.1. This information is crucial since it is associated with the welfare of the household. The average size of the household was 3.02 ± 1.27. The smallest household had one member while the largest household had 10 members. Most of the household (33.9%) had 2 members. Household with 7, 8, and 10 members were least reported at 0.4% each.
were not the household head the mean age of the head was 32.66 ± 6.87 years and ranging from 21 to 65 years.
4.1.2 Socio-economic Characteristics of the Study Population 4.1.2.1 Education Level and Occupation of the Respondent
Education level is a key determinant of the type of employment one gets which in turn is likely to influence the income level of an individual. Moreover, education attainment has a strong effect on the health behaviour and attitude of a person.
Table 4.2: Respondents education and occupation
Characteristic N=254
n %
Respondent education
No formal education 10 3.9
Primary 62 24.4
Secondary 131 51.6*
Tertiary 51 20.1
Total 254 100
Occupation of respondents Farming Casual labour Employed (salaried) Business Housewife Total
Occupation of household head (excluding those respondents who were household heads)(n=19)
11 21 50 67 105 254 4.3 8.3 19.7 26.4 41.3* 100 Unemployed Farming Casual labour Employed(salaried) Business Total 4 16 57 95 63 235 1.7 6.8 24.3 40.4* 26.8 100
The study results showed that slightly more than half (51.6%) of the respondents had secondary education whilst about 24.4% followed with primary education. Only 20.1% of the total respondents reported to have had formal education up to the tertiary level.
Occupation is not only the source of income for an individual but also determines the social class that one enjoys in the society. Examinations of the respondent occupation distribution revealed that most (41.3%) of the women were housewives while those in business followed closely at 26.4%. Additionally, Table 4.2 further shows that about 19.7% of the study participants indicated that they were employed (salaried). For the households where the respondents were not the household heads, most (40.4%) of the household head were in formal salaried employment. Notably, 1.7% among this group was also not in any gainful employment.
4.1.2.2 Household Monthly Income
Figure 4.1: Respondents household monthly income
4.1.2.3 Major Sources of Household Income and Decision maker on Income use Less than half of the participants (44.5%) highlighted formal employment as their major source of income. The results further show that 24.8%, 23.6%, 5.5% and 1.6% cited business, casual labour, agricultural farm produce and donations as their major source of household income respectively (Table 4.3). In regard to who determines how the income will be used, a huge majority (78.0%) indicated their husbands were the major decision makers. Additionally, a notable proportion (16.1%) of the respondents acknowledged that they were in command of how the income will be used as reflected in Table 4.3.
3.5 9.8 16.5 21.7 28.3 11.4 4.3 3.5 0.8
0 5 10 15 20 25 30
< Ksh 4000 Ksh 4001-6000 Ksh 6001-8000 Ksh 8001-10000 Ksh 10001-20000 Ksh 20001-30000 Ksh 30001-40000 Ksh 40001-50000 Ksh >50000 Percentage In com e L eve l
Table 4.3: Major sources of income and decision maker on income use among the respondents households
Variable N %
Major sources of household income
Agricultural farm produce Business
Formal employment Casual labour Donations Total
Income use decision maker Respondent Husband Relative Total 14 63 113 60 4 254 41 198 15 254 5.5 24.8 44.5* 23.6 1.6 100 16.1 78.0* 5.9 100 *: Majority of the respondents
4.1.2.4 Household Assets and Livestock Ownership 4.1.2.4.1 Household Assets
The availability of durable consumer goods is a useful indicator of a household’s socio-economic status. The respondents were asked to state whether they own any of the following items; vehicle, motorcycle, bicycle, wheelbarrow, tractor, sofa set, computer, landline, mobile phone, radio, television, refrigerator, oven/gas cooker and solar pane. Most of the households did not own valuable items associated with high socio-economic status such as vehicle, computer and refrigerator. Only one household reported to have none of all the asked assets while the highest number of assets owned was 11 out of the possible 13.
asset was a land line telephone (1.2%). Ownership of certain assets such as radio (93.3%), mobile phone (96.9%) and television (78.3%) could be a sign of improved awareness on various nutrition and health related issues since they are good channels of communication through which nutrition messages can be conveyed.
Figure 4.2: Household assets of the respondents
4.1.2.4.2 Household Livestock ownership
Household livestock ownership has the potential to improve the nutritional status of household members either directly as good sources of proteins through milk, meat and eggs or indirectly by boosting household income which can be used for food expenditure. Slightly more than half (51.2%) of the total respondents confirmed owning some
96.9
93.3 91.7 78.3
58.3
23.2 21.3
14.2 14.2 13.8 11 10.2 1.2 0
20 40 60 80 100 120
P
er
ce
n
tage
Household Items
Household Items Owned
livestock. As shown in Table 4.4 the most commonly owned animals were chicken, which were owned by 44.1% of all the households.
Table 4.4: Respondents household livestock ownership
Variable <5 animals 5-10 animals 10-20 animals >20 animals
(n=254)
Livestock ownership (%) Yes (51.2)
No (48.8) percent Percent percent Percent Cattle
Yes (25.2) 84.4 14.1 1.6 0
Goat
Yes (16.5) 47.6 42.9 7.1 2.4
Sheep
Yes (13) 57.6 27.3 6.1 9.1
Donkey
Yes (1.6) 100 0 0 0
Chicken
Yes (44.1) 18.8 43.8 27.7 9.8
Pigs
Yes (2) 100 0 0 0
Ducks
Yes (3.9) 50 50 0 0
Rabbit
Yes (5.1) 46.2 53.8 0 0
4.1.2.5 Land Size, Ownership Status and Main Source of Family Food.
Table 4.5: Land size, ownership status and main source of family food of the respondents
Characteristic N=254
n % Land ownership
Yes 154 60.6*
No 100 39.4
Total 254 100
Land size
< 1/4 acre 6 3.9
1/4-1/2 acre 39 25.3
>1/2- 1 acres 49 31.8*
>1-3 acres 46 29.9
>3-5 acres 11 7.1
>5 acres 3 1.9
Total 154 100
Land ownership status
Self owned 146 94.8*
Hired 4 2.6
Public land 4 2.5
Total 154 100
Main source of family food
Home production 46 18.1
Purchase 206 81.1*
Donation 2 0.8
Total 254 100
*: Majority of the respondents
produced their own food. Only a small fraction (0.8%) mentioned donations as their major source of family food.
4.1.2.6 Housing, Lighting, Fuel and Source of Water
Socio-economic profile of a household can also be reflected by the household’s type of house, lighting source and cooking fuel used. The present study results revealed that more than half (64.2%) of the participants rented their houses. The rest of the participants (35.8%) reported living in their own houses. In terms of source of household lighting, 78.3% of the respondents indicated to be using electricity. Use of kerosene lamp and solar panel followed at 12.2% and 7.9% respectively.
Table 4.6: Housing, lighting, fuel and source of water among the respondents households
Variable N=254
Frequency Percentage
Type of housing
Own house 91 35.8
Rented 163 64.2*
Source of lighting
Electricity 199 78.3*
Solar panel 20 12.9
Kerosene lamp 31 12.2
Pressure lamp 4 1.6
Type of fuel
Kerosene 15 5.9
Gas 83 32.7
Firewood 42 16.5
Charcoal 114 44.9*
Source of water
Piped into house 209 82.3*
Communal Tap 8 3.1
Communal well 8 3.1
Rain tanks 12 4.7
River 17 6.7
*: Majority of the respondents
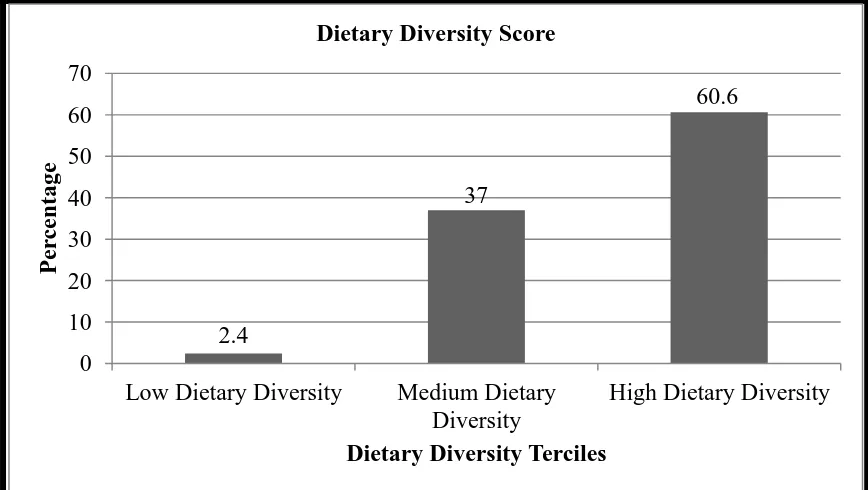
4.2 Individual Dietary Diversity Score
Figure 4.3: Respondents individual dietary diversity score terciles
4.2.1 Consumption of Foods by Respondents Based on Food Groups
In general, the most commonly consumed foods were cereals (99.2%), oils and fats (93.3%), other vegetable (92.9%) and milk and milk products (91.7%). White root and tubers were also highly consumed by the participants (Figure 4.4). Dark green leafy vegetables, legumes and other fruits were consumed in moderation by slightly above half of the respondents at 58.3%, 54.3% and 51.2% respectively. Notably, foods of animal origin were least consumed. Only 1.6% of the total respondents reported to have consumed fish and sea food. Similarly, only about 3.9%, 9.4% and 23.6% of the study participants had consumed organ meat, eggs and flesh meat respectively.
2.4
37
60.6
0 10 20 30 40 50 60 70
Low Dietary Diversity Medium Dietary Diversity
High Dietary Diversity
P
er
ce
n
tage
Figure 4.4: Consumption of foods by respondents based on food groups
The study also showed that Vitamin A rich vegetables and tubers were consumed by approximately one third (32.3%) of the participants. In regard to vitamin A rich fruits, the researcher noted that only 5.1% of the respondents had consumed foods from this food group. There was consensus among the women that cereals was the most consumed food group as was underscored by the FGD statement “In this area most of us feed on Ugali and Githeri as a culture and also since the food is not very expensive”. In regard to meats
one of the women said “the cost of buying meat is prohibitive and thus we opt for cheaper foods or we buy when we have extra cash or in important occasions” (FGD,
Pregnant Women, 2015).
99.2 93.3 92.9 91.7 68.1 58.3 54.3 51.2 32.3 23.6 9.4 5.1 3.9 1.6
0 20 40 60 80 100 120 Cereals
Oils and fats Other vegetables Milk and milk products White root and tubers Dark green leafy vegetables Legumes, nuts and seeds Other fruits Vitamin A rich vegetables and tubers Flesh meats Eggs Vitamin A rich fruits Organ meat Fish and sea food
Percentage F ood gr ou p
Table 4.7: Number of respondents who consumed each food group
Food group n=254 Percentage
Cereals 252 99.2
Oils and fats 237 93.3
Other vegetables 236 92.9
Milk and milk products 233 91.7
White root and tubers 173 68.1
Dark green leafy vegetables 148 58.3
Legumes, nuts and seeds 138 54.3
Other fruits 130 51.2
Vitamin A rich vegetables and tubers 82 32.3
Flesh meats 60 23.6
Eggs 24 9.4
Vitamin A rich fruits 13 5.1
Organ meat 10 3.9
Fish and sea food 4 1.6
Notably, in respect to food intake frequency, the majority (82. 7%) of the study respondents had a meal frequency of 3 times and above per day. Approximately 17.3% of the study subjects were noted to have a meal frequency of below 3 times per day. Both meals and snacks were considered as reported by the respondents.
4.2.2 Maternal Perception towards Dietary Diversity based on Qualitative data from FGDs
Majority of the mothers had a good understanding of the benefits of consuming a diversified diet. One of the mothers who acknowledged consuming a diversified diet said,
“Consuming different foods is important during pregnancy so that the foetus can get all
“Consuming many foods is not good since it will make the baby big which will lead to
birth through caesarean section”. In respect to the question of whether they belief that what they ate influenced on the health of the infant, majority said it had some influence. For instance one of the mothers stated that, “if you don’t take enough food then you might
get a preterm baby or a very small baby”.
In respect to frequency of consuming the different food groups, there was agreement among all mothers that the most consumed food group was cereals. A mother said, “Most of us consume Githeri (mixture of boiled maize and beans) almost on daily basis, Githeri is our cultural food. Sometimes Githeri is replaced with Ugali or rice”. When asked on what dictates what and how much they consume during pregnancy, majority said the household income influences what they eat. Others said that their health status influenced the type and quantity of the food they consumed. One of the mothers who reported eating very little quantities of food said, “During pregnancy, I lose appetite to foods, other times the increased heartburn makes me avoid food completely”.
which makes them cheaper for us to buy. In other months the food is not readily available
and what is available is very expensive”.
4.2.3 Findings of Key Informant Interviews (KII) on Dietary Diversity among Pregnant Women
The health care providers (doctors, nurses and nutritionists) were interviewed on factors affecting dietary intake among pregnant women. There was agreement among the three cadres that morbidity and pregnancy disorders affected dietary intake of most of the pregnant women. The nutritionist in charge said, “Most of the mothers complain of heartburn, loss of appetite and vomiting”. When asked about whether they think poor dietary intake is a problem among the pregnant women, all of them considered it a potential problem. One of the nurses said, “There is an increase in pregnancy anaemia in this area which we highly attribute to poor dietary intake among our pregnant women. In regard to maternal knowledge on dietary diversity, the doctors, nurses and nutritionist all stated that majority of the women knew the importance of a diversified diet. “Many mothers have knowledge on the importance of dietary diversity but that does not
necessarily translate to practice” said one of the doctors attending the maternity wing.
4.3 Dietary Intake of Selected Nutrients among the Pregnant Women
metabolism and daily activities it responds by depleting the reserves and breaking other substances to meet the deficit resulting to poor nutritional status. Notably, the mean contribution of macronutrients (protein, fat and carbohydrate) in the diet to the total energy intake was found to be adequate except for fats 18.72% against the recommended 20-30%. Further, the study showed that the mean intake of vitamin A and C were adequate. The mean intake of all the other selected nutrients was found to be inadequate (Table 4.8).
Table 4.8: Nutrient intake of selected nutrients among the respondents
Nutrient Mean intake (SD)
Reference values
% contribution to total energy intake
% of
respondents meeting the RNI's
Energy (kcal) 1890.59 ± 898.19 2300 28
Protein (g) 57.17 ± 29.96 74 (10-15%) 11.15 46.5 Fat (g) 43.54 ± 25.41 94(20-30%) 18.72 8.7 Carbohydrate (g) 415.98 ± 311.67 175(55-75%) 70.17 75.6
Vitamin A (µg) 1595.81 ± 3874.73 800 46.5
Vitamin C (mg) 96.38 ± 68.21 55 70.5
Calcium (mg) 475.52 ± 308.54 800a 18.1
Folic Acid (µg) 178.97 ± 103.99 600 8.3
Iron (mg) 28.48 ± 48.33 30b 16.9
Zinc (mg) 4.48 ± 2.82 20c 5.1
FAO/WHO 1981; FAO/WHO 2001; WHO/FAO 2004
a
4.4 Maternal Health Profile
4.4.1 Antenatal Clinic Attendance among the Pregnant Women
Antenatal clinic attendance is considered important in ensuring maternal and child health. As presented in Figure 4.5, though at different gestational ages, most (30.3%) women had attended their antenatal clinic thrice. Approximately 23.2% reported to have attended the antenatal clinic twice whereas around 24% were in their first antenatal visit. Furthermore, only 22.4% indicated to have attended the antenatal clinic more than thrice.
Figure 4.5: Antenatal clinic attendance of the respondents
4.4.2 Micronutrient Supplementation among the Mothers
The Table 4.9 reveals that vast majority (70.1%) of the women were having micronutrient supplementation. Out of the 70.1% who reported having micronutrient supplementation, most (98.9%) women indicated to be using iron and folic acid supplements.
61 59
77 57 0 20 40 60 80 100
Once Twice Thrice More than
thrice Num b er of Re sp on d en ts
Table 4.9: Micronutrient supplementation intake among the respondents
Variable Frequency (n) % Micronutrient supplementation
Yes 178 70.1*
No Total 76 254 29.9 100 Type of supplements
Iron and Folic acid Multiple micronutrient Total
Source of supplement Health facility Bought from shops Friends
Total
Reason for lack of supplementation First ANC visit
Not available at ANC clinic Don’t see their need
They make me sick Ran out
Unaware of them
Total 176 2 178 168 9 1 178 32 14 4 19 4 3 76 98.9* 1.1 100 94.4* 5.1 0.5 100 42.1* 18.4 5.3 25 5.3 3.9 100 *: Majority of the respondents
3.9 % of the respondents not taking the supplements indicated that they were unaware of the supplements.
4.4.3 Maternal Morbidity Pattern
Since illness affects food intake, absorption and utilization of nutrients of an individual, this study determined the morbidity patterns of the study participants. More than half (57.5%) of the women involved in this study reported to be unwell in the immediate two weeks preceding the day of the interviews. The main disorders reported by the women were heartburn (42.9%) and anorexia (15.4%) as shown in the Table 4.10. Out of all those who reported being sick, only 40.4% who sought medical attention. Government hospital was most preferred by those who sought medical treatment (78%) in comparison with 16.9% who sought attention from the private hospitals. About 5.1% of the sick respondents reported that they used traditional medicine to cure their ailments.
Table 4.10: Maternal morbidity of the respondents in the past two weeks
N=254
Type of illness/disorder n
Prevalence (%)
Highest frequency of duration
Heartburn 109 42.9 >7 days
Anorexia 39 15.4 >7 days
Vomiting 36 14.2 > 7days
Constipation 29 11.4 2 days
Fever 14 5.5 7 days
Abdominal pains 10 3.9 6 days
Upper respiratory infection 6 2.4 5 days
Diarrhoea 5 2 1 day
Headache 3 1.2 5 days
4.5 Nutritional Status of the Respondents 4.5.1 Nutritional Status Based on MUAC
The average MUAC of the respondents was 26.72 cm ± 3.66 with the measurements ranging from 19.5 cm to 40.2 cm. The study results revealed that 19.3% of the study subjects were undernourished (MUAC <23cm) while about 80.7% of the participants had adequate nutritional status.
Table 4.11: Nutritional status by MUAC of respondents
N=254
MUAC in cm Frequency Percentage
<23.0 cm 49 19.3
23.0 cm and above 205 80.7
Total 254 100
UNICEF, 2009; Ververs et al., 2013; WHO, 1995
Chi-square test showed a significant relationship between mother’s age and their respective nutritional status based on MUAC (Likelihood ratio; 20.210, df=6, P=0.003). Moreover, Pearson’s correlation coefficient revealed a significant positive relationship (r=0.217, P<0.001) between the mothers MUAC and age suggesting that MUAC increased with increase in age.
of the expectant woman. Cross tabulation of women age category and their respective nutritional status (MUAC) revealed that most of the women who were under nourished were in the age category of between 20-29 years as reflected in the Table 4.12.
Table 4.12: Nutritional status (MUAC) by age of respondents
N=254
MUAC status Age category
Under Nourished
(n) (%) Normal (n) (%) Total (n) (%)
16-19 9(3.5) 5(2.0) 14(5.5)
20-24 15(5.9) 71(28.0) 86(33.9)
25-29 15(5.9) 63(24.8) 78(30.7)
30-34 7(1.4) 41(16.1) 48(18.9)
35-39 1(0.4) 22(8.7) 23(9.1)
40-44 1(0.4) 2(0.8) 3(1.2)
45-49 1(0.4) 1(0.4) 2(0.8)
Total 49(19.3) 205(80.7) 254(100)
4.5.2 Nutrition Status Based on Haemoglobin Values
The respondent’s blood was tested for haemoglobin levels. In this study, pregnant women with haemoglobin of less than 11g/dl were considered to be anemic (UNICEF, 2001). The mean haemoglobin level of the respondents was 12.52 g/dl ± 1.61. About 16.9% of the respondents were found to be anemic.
Table 4.13: Nutritional status by haemoglobin levels of the respondents
N=254
Hb in g/dl Frequency Percentage
<11.0 g/dl 43 16.9
11.0 g/dl and above 211 83.1
Total 254 100
Table 4.14: Nutritional status (Hb) by age of respondents
N=254
MUAC status
Age category Anemic (n) (%) Normal (n) (%) Total (n) (%)
16-19 4(1.6) 10(3.9) 14(5.5)
20-24 15(5.9) 71(28.0) 86(33.9)
25-29 17(6.7) 61(24.0) 78(30.7)
30-34 3(1.2) 45(17.7) 48(18.9)
35-39 3(1.2) 20(7.9) 23(9.1)
40-44 1(0.4) 2(0.9) 3(1.2)
45-49 0(0) 2(0.9) 2(0.8)
Total 43(16.9) 211(83.1) 254(100)
Cross-tabulation between women age category and nutritional status based on Hb showed that the age category of 25-29 years had the highest number of women who were anemic. Additionally, since dietary iron is important in formation of blood, Chi-square test was carried out to test for association between iron intake and anemia and the results showed no significant relationship (χ2=0.103, df=1, p=0.748).
4.6 Relationship between Study dependent and Independent Variables
The study established the association between the dependent and the independent variables.