R E S E A R C H
Open Access
Intelligent query by humming system based on
score level fusion of multiple classifiers
Gi Pyo Nam
1, Thi Thu Trang Luong
1, Hyun Ha Nam
1, Kang Ryoung Park
1*and Sung-Joo Park
2Abstract
Recently, the necessity for content-based music retrieval that can return results even if a user does not know information such as the title or singer has increased. Query-by-humming (QBH) systems have been introduced to address this need, as they allow the user to simply hum snatches of the tune to find the right song. Even though there have been many studies on QBH, few have combined multiple classifiers based on various fusion methods. Here we propose a new QBH system based on the score level fusion of multiple classifiers. This research is novel in the following three respects: three local classifiers [quantized binary (QB) code-based linear scaling (LS), pitch-based dynamic time warping (DTW), and LS] are employed; local maximum and minimum point-based LS and pitch distribution feature-based LS are used as global classifiers; and the combination of local and global classifiers based on the score level fusion by the PRODUCT rule is used to achieve enhanced matching accuracy. Experimental results with the 2006 MIREX QBSH and 2009 MIR-QBSH corpus databases show that the performance of the proposed method is better than that of single classifier and other fusion methods.
Keywords:query-by-humming, linear scaling, dynamic time warping, multiple classifiers, score level fusion.
1. Introduction
With the rapid increase in music data on the Internet, MP3 players, portable media players (PMP), and smart phones, it is more difficult for the users to find the cor-rect file they want. In addition, if they do not know the information details such as the title and singer’s name, more time is needed for searching. To overcome these problems, the query-by-humming (QBH) method has been introduced as a natural interface based on melody that can search for the corresponding music file accord-ing to the user’s humming.
In general, the humming and music data are repre-sented as magnitude values on a time axis. By using short time Fourier transform (STFT), the pitch (funda-mental frequency) can be extracted from the humming and music data. Although the pitch value corresponds to musical notes (e.g., the pitch values 440 and 494 Hz represent the musical notes “la” and “ti” respectively [1]), there exist fluctuations in the pitch value caused by the errors in pitch extraction (tracking) due to
background noise. To overcome these problems, the note-based method was introduced, where the pitch sequence is segmented into (musical) notes [2]. Since the notes have characteristics of discrete values (i.e.,
“do”, “re”, “mi”, etc.), the note-based method is similar to that representing continuous pitch values as quan-tized ones. Through representation as discrete values, fluctuation in the pitch value can be reduced, and the possibility of the existence of the same note in some period is increased. Thus, additional features such as the musical interval, duration, and tempo can be used in the note-based method [3-8]. However, inaccurate note seg-mentation from the pitch value can degrade the match-ing accuracy. Thus, the frame-based method, which uses the original pitch values as features, has also been stu-died [2,9-12].
For matching methods, previous research on QBH was divided into bottom-up and top-down methods [13,14]. In the bottom-up method [3-7,9-11], the two waveforms of query humming and the target music file are locally compared. Based on the results of local matching, the optimal matching path is determined. In contrast, the global shapes of the two waveforms are compared in the top-down methods, and the local information of the * Correspondence: [email protected]
1
Division of Electronics and Electrical Engineering, Dongguk University, 26, Pil-dong 3-ga, Chung-gu, Seoul, Republic of Korea
Full list of author information is available at the end of the article
waveform is also used to adjust the matching results of the global shape [2,8,12]. Based on this taxonomy (i.e., note-based and frame-based methods, bottom-up and top-down methods), previous studies can be classified as follows [13,14].
Studies involving the first category of note-based and bottom-up methods have been performed [3-7] as fol-lows [13,15]. The MELDEX system uses string matching based on the pitch contour, interval, and duration [3,4]. In the Themefinder system, a user can find the music theme from the Humdrum database of 16th century classical music and folk songs on the Internet [5,6]. It also uses string matching based on the pitch and inter-val. Blackburn et al. developed a method using string matching of the up-down-repeat (UDR) string based on changes in the music melody [7].
In the second category of note-based and top-down methods, a QBH system based on the earth mover’s dis-tance (EMD) was proposed [8]. The EMD algorithm can calculate the minimum cost between the humming and music features with change in weight, which are used to calculate the similarity between two melodies.
The studies of [9-11] belong to the third category of frame-based and bottom-up methods as follows [13,15]. Ghias et al. used pitch data instead of musical notes and represented them as the UDR string for matching [9]. The Melody Hound system [10] also uses the pitch con-tours and represents them as the UDR string like [9]. The dynamic time warping (DTW) based method [11] extracts the pitch vectors from the input singing and performs bottom-up matching based on DTW using the input and stored pitch vectors.
The last category involves frame-based and top-down methods [2,12] as follows [13,14]. Since linear scaling (LS) based matching cannot solve the problem of non-linear alignment between the input humming and stored music data, the recursive alignment (RA) algorithm has been proposed [2] to solve the problem by attempting local matching recursively. Ryynanen et al. extracted the pitch vectors using a time window of fixed length and used the locality sensitive hashing (LSH) method for matching [12].
Most of the previous methods used a single matcher [2-12], which has the limitation of performance enhancement [13]. To overcome this problem, Wang et al. combined two classifiers such as EMD and DTW. However, they used only the weighted SUM method as a combination rule without comparing various fusion rules [16]. Thus, Nam et al. proposed the method of combining only two “local” classifiers of pitch-based DTW and the quantized binary (QB) code-based LS algorithm by fusing the scores for the MIN rule based on the comparisons of various fusion rules [13]. How-ever, the performance enhancement from using two
“local”classifiers is limited. That is, because, for measur-ing the similarity of hummmeasur-ing and MIDI data, the points of humming data are compared with those of MIDI data one by one (locally), which does not consider the global shapes formed by humming and MIDI data. Thus, we propose a new QBH system based on the score level fusions of multiple classifiers. The pitch values are extracted using the spectro-temporal autocorrelation (STA) method. The extracted pitch values are normal-ized by the mean-shifting, median filtering, average fil-tering, and min-max scaling methods. Pitch-based linear scaling (LS), dynamic time warping (DTW), and linear scaling (LS) with the quantized binary (QB) code of the pitch data are used as three“local” classifiers. The local maximum and minimum point-based LS and pitch dis-tribution feature-based LS are also used as two “global” classifiers. The global classifier measures the dissimilar-ity between humming and MIDI data based on the glo-bal shapes formed by humming and MIDI data.
Finally, through the combination of these five classi-fiers by the score level fusion of the PRODUCT rule based on comparisons of various fusion rules, the per-formance of the QBH system is greatly enhanced. We proved this by comparing the results for the proposed method to those for a single classifier and various other fusion methods. By using both local and global classi-fiers, the matching accuracies of the proposed method were enhanced as compared to the previous research [13] as shown in Tables 1, 2, 3 and 4. Since both the local and global classifiers are used based on the pitch values, the proposed method can be regarded as frame-based and a hybrid of the bottom-up and top-down methods.
The remainder of this paper is as follows. In Section 2, the proposed method is explained. The experimental results are shown in Section 3. The conclusion follows in Section 4.
2. Proposed method
2.1. Overview of the proposed method
Through mean-shifting, both the DC levels of MIDI and the input humming data are set to 0. The peak, shaking, and vibration noises are the removed by using the median and average filtering. Since amplitude varia-tion exists between the MIDI and input humming, min-max scaling is used to compensate. The normalized data are used for matching [13-15,17,18].
Five scores (distances) are calculated from five classi-fiers: pitch-based LS, pitch-based DTW, QB code-based LS, local maximum and minimum point-based LS, and pitch distribution feature-based LS. Finally, the five cal-culated scores are combined by the PRODUCT rule. Based on the combined score, the ranking of the match-ing MIDI file is determined in the database. The correct MIDI file (corresponding to the humming) is found based on the calculated ranking.
2.2. Pitch extraction using musical note estimation
In the proposed QBH system, the sampling period of pitch data is 32 ms. In particular, a voice-activity
detection algorithm is used to extract the pitch only from the voiced frames [13,17-19]. The voiced frames are estimated and the integer pitch data are then searched by the STA method with the format expanded speech signalSf(n), in which both temporal and spectral autocorrelations (SAs) are used [13,17,18,20]. The tem-poral autocorrelation (TA) for lagτand the SA methods are defined as shown in Equations 1 and 2 [13,18].
RT(τ) =
N−τ−1
n=0
Sf(n)Sf(n+τ)
N−τ−1
n=0 S2
f(n) N−τ−1
n=0 S2
f(n+τ)
(1)
RS(τ) =
K/2−kτ−1
k=0
Sf(k)Sf(k+kτ)
K/2−kτ−1
k=0 S2
f(k)
K/2−kτ−1
k=0 S2
f(k+kτ)
(2)
Table 1 Comparison of the matching accuracies using the PV files of the 2006 MIREX QBSH corpus database
Method Criterion
Top 1 (%) Top 10 (%) Top 20 (%) MRR
LS (Section 2.4.1) 60.17 82.09 91.96 0.678
Pitch based DTW (Section 2.4.2) 57.81 83.77 92.63 0.663
QB code-based LS (Section 2.4.3) 65.00 83.20 93.78 0.716
Feature point overlap (Section 2.4.4) 41.20 72.45 82.87 0.518
Distribution (Section 2.4.5) 13.09 57.63 78.87 0.264
Decision level fusion (OR) 50.41 80.11 99.00 0.616
Previous method [13] 71.18 86.13 93.17 0.753
Score level fusion MIN 77.82 85.02 91.62 0.798
MAX 58.51 81.12 88.46 0.665
SUM 68.72 85.56 92.94 0.745
Weighted SUM 69.22 85.60 92.76 0.748
PRODUCT (proposed method) 78.14 85.81 93.08 0.802
Table 2 Comparison of matching accuracies using the PV files of the 2009 MIR-QBSH corpus database
Method Criterion
Top 1 (%) Top 10 (%) Top 20 (%) MRR
LS (Section 2.4.1) 58.38 82.14 91.87 0.666
Pitch-based DTW (Section 2.4.2) 56.64 84.28 92.93 0.657
QB code-based LS (Section 2.4.3) 64.18 82.32 91.08 0.706
Feature point overlap (Section 2.4.4) 42.16 72.85 82.66 0.525
Distribution (Section 2.4.5) 12.83 57.14 78.84 0.264
Decision level fusion (OR) 50.56 79.74 98.83 0.617
Previous method [13] 70.14 86.16 93.04 0.746
Score level fusion MIN 76.74 84.39 91.53 0.789
MAX 59.42 79.92 88.08 0.667
SUM 68.27 85.93 93.41 0.743
Weighted SUM 69.11 85.19 93.41 0.747
In Equation 1,Nis a frame size of 240 samples.Sf(k) is the Kth Fourier spectrum ofSf(n), and kτ = K/τin Equation 2 [13,18]. The STA method finds the time-domain pitch periodτ* because the TA and SA methods produce pitch doubling and halving, respectively [13,18]. τ* is defined as shown in Equation 3 [13,18].
τ∗ = arg maxτmin≤τ≤τmax{R
T(τ) +RS(τ)} (3)
where τmin and τmax are set to 7 and 107 samples,
respectively, for a sampling frequency of 8000 Hz [13,18].
2.3. Normalization of the extracted features
In general, there are many differences between the MIDI data and user’s humming data, and normalization is required. As the first step, all zero value components obtained from the silent (muted) samples are removed.
All the zero values in the humming pitch and MIDI data are removed [13-15,17,18].
Since the MIDI is made using musical instruments, the waveform of MIDI files usually includes less noise and vibration as compared to the humming data, as shown in Figure 2; the differences degrade the matching accuracy. To overcome these problems, the pitch values of humming and MIDI are normalized; this includes mean-shifting, median filtering, average filtering, and min-max scaling as follows [13-15,17,18].
The mean level of the humming is usually different from that of the MIDI data, as shown in Figure 2a, b. Through mean-shifting, both the DC levels of the MIDI and input humming data are set to 0 [13-15,17,18]. The peak, shaking, and vibration noises are removed by med-ian and average filtering. These noises are the surround-ing and line noises that often occur dursurround-ing recordsurround-ing
Table 3 Comparison of matching accuracies using the extracted pitch data by the STA pitch extractor with the 2006 MIREX QBSH corpus database
Method Criterion
Top 1 (%) Top 10 (%) Top 20 (%) MRR
LS (Section 2.4.1) 52.31 77.62 89.45 0.610
Pitch-based DTW (Section 2.4.2) 51.76 79.75 89.42 0.605
QB code-based LS (Section 2.4.3) 59.35 78.94 89.20 0.664
Feature point overlap (Section 2.4.4) 37.61 68.22 79.26 0.483
Distribution (Section 2.4.5) 10.55 53.49 76.15 0.239
Decision level fusion (OR) 46.13 75.03 98.56 0.573
Previous method [13] 65.40 82.37 91.12 0.702
Score level fusion MIN 72.08 79.78 88.56 0.747
MAX 58.51 81.12 88.46 0.665
SUM 63.15 81.29 90.32 0.693
Weighted SUM 62.68 81.11 90.46 0.690
PRODUCT (proposed method) 72.98 81.50 90.32 0.754
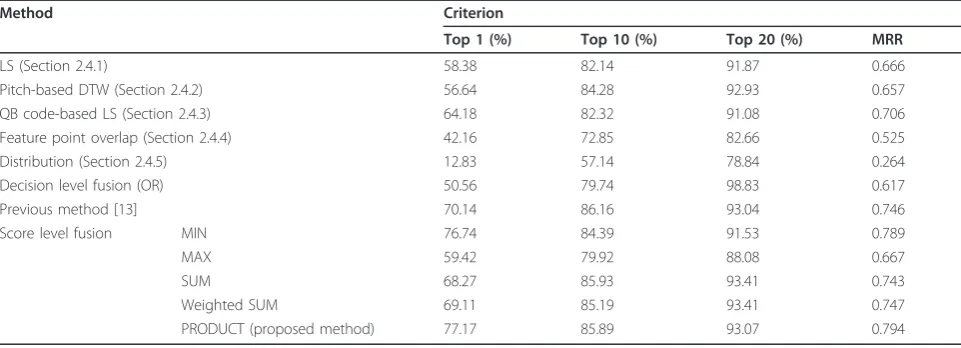
Table 4 Comparison of matching accuracies using the extracted pitch data by the STA pitch extractor with the 2009 MIR-QBSH corpus database
Method Criterion
Top 1 (%) Top 10 (%) Top 20 (%) MRR
LS (Section 2.4.1) 57.77 81.63 92.10 0.660
Pitch-based DTW (Section 2.4.2) 55.41 83.68 92.55 0.647
QB code-based LS (Section 2.4.3) 62.88 81.97 90.90 0.699
Feature point overlap (Section 2.4.4) 42.00 72.74 82.69 0.527
Distribution (Section 2.4.5) 12.16 58.32 79.87 0.261
Decision level fusion (OR) 51.28 79.30 99.07 0.619
Previous method [13] 69.10 85.42 92.78 0.736
Score level fusion MIN 77.12 83.93 91.29 0.790
MAX 59.13 81.09 88.29 0.665
SUM 68.97 85.71 93.55 0.745
Weighted SUM
69.08 85.20 93.41 0.745
PRODUCT (proposed method)
and can also be caused by the vibrato of the user’s voice [13-15,17,18]. The median filter is an order-statistic fil-ter [21] and is strong enough to remove the random peak noise [13-15,17,18]. The average filter is used to eliminate the shaking and vibration noises [13-15,17,18].
Since an amplitude variation exists between the MIDI and input humming, min-max scaling can be used to compensate [13-15,17,18]. These normalized data are used for matching. Figure 3 shows the normalized pitch data of Figure 2.
2.4. Matching algorithm
2.4.1. Pitch-based LS algorithm
There are many algorithms for matching input humming and an MIDI file. Of these, the linear scaling (LS) algo-rithm is the simplest and quite effective. The main idea of this method is rescaling the input humming. The length of the input humming is not always equal to the corresponding part in the MIDI data [17]. Therefore, the length of the input humming should be compressed or stretched to reach the length of the correct part in the MIDI file [2]. In this study, humming data was stretched by a scale factor from 1.0 × to 2.0 × at increments of 0.05 × (1.0 ×, 1.05 ×, 1.1 ×, 1.15 ×,..., 2.0 ×) for matching, as shown in Figure 4 [17]. The optimal scale factors and steps were empirically determined for the database. Figure 1Overall procedure of the proposed method.
(a)
(b)
Figure 2Extracted pitch contours before normalization:(a)the MIDI file;(b)the humming file.
(a)
(b)
Figure 3Normalized pitch contours of Figure 2:(a)the MIDI file;
(b)the humming file.
The dissimilarity between the MIDI and humming is calculated by the Euclidean distance (ED), as shown in Equation 4 [17].
ED(p,q) =
n
i=1
(pi−qi)2 (4)
In Equation 4, pi and qi are the pitch values in the input humming and the corresponding part of the MIDI file, respectively.
2.4.2. Pitch-based DTW algorithm
It is often the case that the original music file includes the whole song, while a user hums the part of the song. Thus, the length of the humming is different from that of the stored music file. In addition, a user can hum fas-ter or slower as compared to the original music file, and some parts can be missing or added during humming. Thus, a matcher that can solve these problems should be considered; the DTW method [13-15,18] was used in this study. DTW matching is mainly used to measure the dissimilarity between two waveforms through inser-tion and deleinser-tion.
For good matching by DTW, some constraints are required. The first is for starting and ending positions. In other words, the starting and ending positions of the two waveforms to be matched should be the same for the DTW algorithm [13,18]. Supposing that Figure 5a, b are the humming and MIDI files, respectively; these two waveforms can be successfully matched by DTW since the starting and ending positions of these two wave-forms are coincident, even though the lengths on the time axis are different from each other [13,18]. How-ever, since the ending position of Figure 5c is different
from that of Figure 5a, these two waveforms cannot be successfully matched by DTW [13,18].
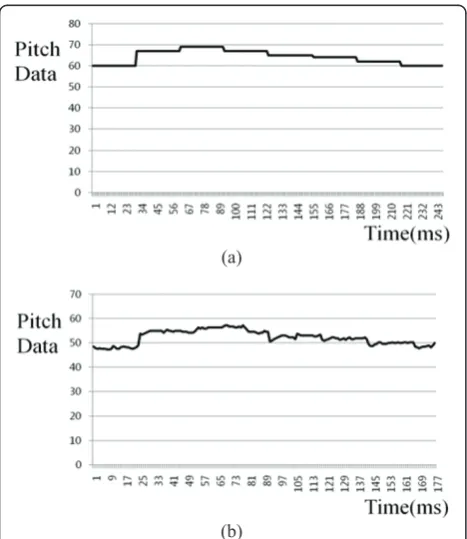
The second constraint is the search space [13,18], as shown in Figure 6. The red line from A to B shows the optimal path for matching between the MIDI and hum-ming data. However, since the DTW algorithm cannot know the optimal path globally, all of the paths from A to B are attempted if there is no prior knowledge; in each path, the dissimilarity between the MIDI and hum-ming waveforms is measured. In this case, based on the knowledge that a user usually hums a song quite simi-larly to the original music file (not much faster or slower), we can reduce the search space. In other words, by simply searching the paths in the part of the whole space, the MIDI can be successfully matched with the humming data in reduced matching time [13,14,18]. In our study, we defined the search space as the parallelo-gram shape defined by ADBF in Figure 6. By using the line boundary of the search space instead of the curve, we can reduce the processing time [13,14,18]. By chan-ging the positions of D and F in Figure 6, we can easily define the size of the searching area of the DTW method [13,14,18]. However, excessive reduction of the search space can degrade the matching accuracy. Thus, the optimal size was experimentally determined in terms of matching accuracy. The experimental results showed that the matching accuracy was best when the ratio of line lengths DE to CE was 0.25 [13].
Since any part of the original music can be hummed by a user, the starting position for matching was not known in general. Thus, the searching procedure shown
(a) (b)
(c)
Figure 5First constraint in the DTW matching algorithm:(a)
input humming data;(b)MIDI data with the same starting and ending positions as(a);(c)MIDI data with different ending positions
in Figure 6 was performed by moving the starting posi-tion of the humming file relative to the MIDI file [13-15,18], as shown in Figure 7.
Since the length of the input humming is not always equal to the part in the MIDI data, all of the MIDI data were stretched by scale factors [13,14,18] from 1.0 × to 2.0 × in increments of 0.2 × (1.0 ×, 1.2 ×, 1.4 ×, 1.6 ×,..., 2.0 ×) for matching.
At each position, the dissimilarity between the hum-ming and MIDI features was measured using Equation 5 [13-15,18,22]:
dps(ri,qj) =
M−1
m=0
[ri(m)−qj(m−ps)]2
M−1
m=0
r2
i(m)
M−1
m=0
q2
j(m−ps)
, 0≤m,m−ps≤M−1 (5)
In Equation 5,qj(m-ps) andri(m) represent the hum-ming data and MIDI file, respectively. qj(m) is matched with ri(m) by shifting the constant intervals of ps [13-15,18], as shown in Figure 7.
2.4.3. QB code-based LS algorithm
For the third matcher, the LS algorithm based on the QB code of the pitch data was used [13]. Since the origi-nal pitch data have variations as compared to the MIDI file, we represent the continuous pitch values as quan-tized binary numbers to reduce small differences between the pitch values of the humming and MIDI [13,17]. Figure 8 shows an example of obtaining the QB codes from the pitch data. The range between the mini-mum and maximini-mum pitch values is uniformly divided into ten sections, and 9-bit code is assigned in each sec-tion. In detail, the codes of 000000000, 000000001, 000000011, 000000111,..., 111111111 are assigned to section 0, 1, 2, 3,..., 9, respectively [17].
If we assign 000000001 and 000000010 in Sections 1 and 2, respectively, the small variation in pitch value at the boundary position of these two sections can causes 2-bit errors (000000001® 000000010, or 000000001 ¬ 000000010). To solve this problem, we assigned 9-bit codes so that in each consecutive section, each code changes by 1 bit, i.e., 000000000 ® 000000001, 000000001 ® 000000011, 000000011 ® 000000111 [13,17].
As shown in Figure 8, the pitch values of -4.53 and 5.00 are represented as 000000000 and 111111111, respectively. The pitch value of -2.12 is represented as 000000011. The optimal number of the section shown in Figure 8 was experimentally determined to be 10.
The QB codes of humming data were linearly stretched on the time (horizontal) axis by a scale factor [13,17] from 1.0 × to 2.0 × at increments of 0.05 × (1.0 ×, 1.05 ×, 1.1 ×, 1.15 ×,..., 2.0 ×) for matching, similar to the pitch-based LS algorithm of Section 2.4.1 and Figure 4.
The dissimilarity between the MIDI file and humming data was measured based on the HD, as shown in
Figure 7 Matching by moving starting position of the
Equation 6 [13,17]. Since the HD just includes the operation of exclusive OR, its processing speed is faster than other distance metrics such as the Euclidean dis-tance that include the operation of a square root.
HD = A⊗B
N (6)
where Aand B represent the extracted QB codes of the MIDI and input humming data, respectively. ⊗ means the Boolean exclusive-OR operator between two QB codes.Nis the total number of bits of the QB code for the MIDI or input humming data [13,17].
2.4.4. Local maximum and minimum point-based LS algorithm
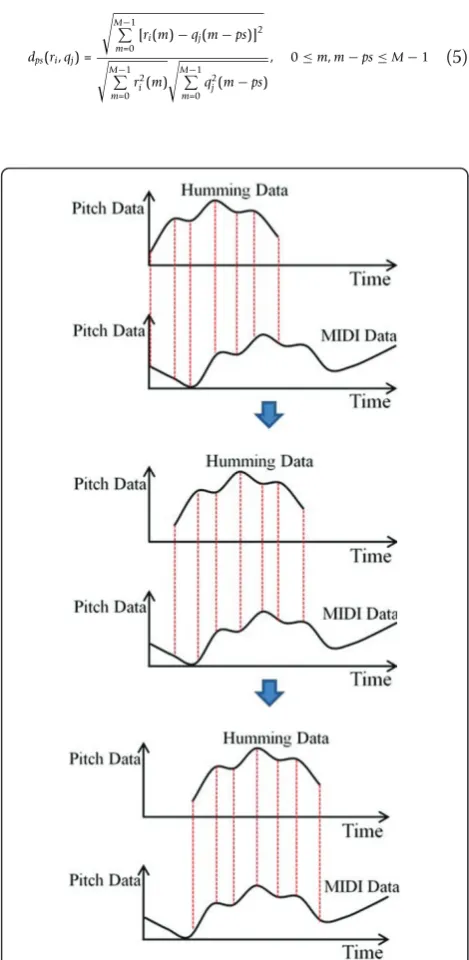
Pitch-based LS, DTW and QB code-based LS algorithms perform matching based on details and local information of the pitch. Thus, these methods have the disadvantage in terms of processing speed, and their performances can be affected by local variations in the pitch data. The local maximum and minimum point-based LS algorithm was introduced as a global classifier [18,23].
As shown in Figure 9, the MIDI data are matched with the humming data based on the local maximum and minimum points.
The local maximum and minimum points are detected as follows [18,23]. Based on the graph and calculated gradient of the pitch data shown in Figure 9a, b, three states are defined: ascending, descending, and zero
gradients. By tracing and calculating the gradient of the graph shown in Figure 9, if the ascending state changes to a zero gradient or descending state at the current point, that is a local maximum. If the descending state changes to a zero gradient or ascending state at the cur-rent point, that is a local minimum. Finally, if the zero gradient state changes to an ascending or descending state, that is a local minimum or maximum, respectively. As shown in Figure 9, if two local maximum or mini-mum points (of humming and MIDI data) belong to a same rectangle with same kind (maximum or minimum point), the two points belong to a same rectangle with different kind, and the two points belong to different rectangles, their distances are determined as 5, 4 and 0, respectively [18,23].
In general, the length of humming data is frequently not same to that of MIDI data. So, the horizontal posi-tions of minimum or maximum points of MIDI data are linearly stretched from 1.0 × to 2.0 × with the step of 0.2 while matching [18,23]. The width of rectangle is linearly altered considering the stretching factor (scale factor) [18,23].
2.4.5. Pitch distribution feature-based LS algorithm
In general, the overall pitch waveform of humming tends to be more similar to that of the genuine MIDI file as compared to that of different MIDI files. Thus, we used the pitch distribution feature-based LS algorithm as another global classifier [23]. The waveforms of hum-ming and the MIDI file, such as that shown in Figure 3, are considered as the pitch distributions.
The seven histogram features (energy, entropy, med-ian, variance, skewness, kurtosis, and coefficient of varia-tion) are extracted for calculating the similarity of two distributions [23].
Each feature represents the overall shape of the pitch waveform [23]. The skewness represents the measure of asymmetry [24]. Kurtosis represents the measure of peak-edness. Based on the seven feature values, the ED between the humming and MIDI file is calculated, and the ranking of the matched MIDI file is determined in the database based on the distance [23]. Since the lengths of the hum-ming and MIDI data can be different, the MIDI data are stretched by a scale factor [23] from 1.0 × to 2.0 × (1.0 ×, 1.2 ×,..., 2.0 ×) by linear scaling and matched as shown in Figure 4. The optimal scale factors and steps were also empirically determined with the database.
2.5. Combining five scores by score level fusion
Given one humming data sample, five matching scores to one MIDI file can be obtained by the five matchers (Section 2.4). With these five scores, we obtain one final score by using the score level fusion method. Various methods exist for score level fusion [25], such as the MIN, MAX, PRODUCT, SUM, and Weighted SUM Figure 9 Local maximum and minimum point-based LS
rules as follows [13]. Through the MIN rule, we select the minimum value of all of the scores. The MAX rule selects the maximum score. The PRODUCT rule obtains the multiplied value of all of the scores. The SUM rule obtains the summed value of all of the scores. The Weighted SUM rule obtains the summed value with weights. The optimal weight values for the Weighted SUM rule were empirically determined.
For example, assuming that the five scores are 0.4, 0.3, 0.2, 0.7, and 0.8, the MIN, MAX, PRODUCT, SUM, and Weight SUM (with weights of 1, 2, 3, 4, and 5) scores are 0.2, 0.8, 0.01344 (0.4 × 0.3 × 0.2 × 0.7 × 0.8), 2.4 (0.4 + 0.3 + 0.2 + 0.7 + 0.8), and 8.4 (0.4 × 1 + 0.3 × 2 + 0.2 × 3 + 0.7 × 4 + 0.8 × 5), respectively.
3. Experimental result
In this study, two open databases were used to compare accuracy like [13]: the 2006 MIREX QBSH corpus and 2009 MIR-QBSH corpus. These two are the most com-monly used for performance comparisons [26,27]. They include 48 MIDI files as original music melodies. The 2006 MIREX QBSH corpus was used for the Query by Singing and Humming (QBSH) International Contest (MIREX 2006, 2007 and 2008). There are 2,797 singing and humming queries, and they are stored in the wave file format. The 2009 MIR-QBSH corpus was used in MIREX 2009. Although the number of MIDI files is the same to that of the 2006 MIREX QBSH corpus, the number of singing and humming queries was increased to 4,431. Both the 2006 MIREX QBSH corpus and 2009 MIR-QBSH corpus were collected from 118 persons using telephones, microphones, etc. to consider various recording conditions. In the first experiment, the pitch vector (PV) files of the databases were used for perfor-mance comparisons. The pitch values in the PV files were manually extracted; they were mainly used for the matching performance excluding the performance of the pitch extractor. The sampling period of pitch values in the PV file was 32 ms, and there were 250 pitch values in each query file since the recording time was 8 s [13,14,17].
First, we measured the performances of five matching algorithms (Section 2.4) with the PV files of the 2006 MIREX QBSH corpus database, as shown in Table 1. The mean reciprocal rank (MRR) is shown in Equation 7 and was used as the performance measurement criter-ion; it was widely used in previous studies for the QBH and MIREX contests [13,14,17,18,23,28].
MRR= 1 k
k
i=1 1 ranki
(7)
where kis the number of input files andrankimeans the ranking of the correct MIDI file (corresponding to
the input humming file) as calculated by the proposed method. For example, suppose that there are only two input humming files (kof Equation 7 is 2). Given the first input humming file, the ranking of the correct MIDI file is inaccurately measured as the sixth rank (ranki of Equation 7 is 1/6) by the proposed method. Given the second input humming file, that of the cor-rect MIDI file is accurately calculated as the first rank (rankiof Equation 7 is 1/1). In this case, the MRR is cal-culated as 0.583 ((1/2) × (1/6 + 1/1)). If all of the cor-rect MIDI files (corresponding to the input humming files) are accurately measured as the first rank, the cal-culated MRR becomes 1, and the maximum MRR is 1 [13].
Top 10 represents the probability that the correct MIDI file (corresponding to the input humming file) is included in the 10 highest ranked candidates among the 48 MIDI files [13,17,23]. In Tables 1, 2, 3 and 4, the decision level fusion (OR) is obtained as follows [13]. For example, if the ranking is“2” according to the first classifier, the result is represented as“000010”. If the ranking is “4” according to the second matcher, the result is shown as “000100”. The combined ranking by OR rules is“000110” through the bit OR operation of the bits“000010” and“000100”[13]. We did not include the results of the AND rule since the most calculated bit became 0 through the bit AND operation, and the consequent ranking values of most of the MIDI files became the same [13].
As shown in Table 1, the performance of the proposed method was the best as compared to the single classifier, other fusion methods, and the previous method. The previous method [13] combines only two classifiers of pitch-based DTW and QB code-based LS algorithm by the score fusions of the MIN rule.
In the next experiment, we measured the perfor-mances of the five matching algorithms (Section 2.4) with the PV files of the 2009 MIR-QBSH corpus data-base as shown in Table 2. The performance of the pro-posed method was the best as compared to the other methods.
In the next experiment, we tested the pitch files auto-matically extracted by the STA method (Section 2.2) from the 2006 MIREX QBSH corpus database. As shown in Table 3, the performance of the proposed method was the best as compared to the other methods. In the last experiment, we tested the pitch files auto-matically extracted by the STA method (Section 2.2) from the 2009 MIR-QBSH corpus database. As shown in Table 4, the performance of the proposed method was the best as compared to the other methods.
participants in MIREX 2008 like [13]. The performances of Ryynanen et al.’s method [12] and Wang et al.’s method [16] ranked the highest (MRR of 0.93). The MRR of our method was seventh (MRR of 0.802). The 2009 MIR-QBSH corpus database was used for MIREX 2009 contest, and the MRR for the highest ranked method was 0.91, whereas that of the proposed method was third (MRR of 0.794).
We measured the processing time when one humming file is matched with 48 MIDI data on a desktop compu-ter consisting of Intel Core 2 Quad 2.33 GHz CPU, 4 GB RAM, and Windows XP OS. Experimental results showed that the processing time of each score level fusion method (MIN, MAX, SUM, Weighted SUM, and PRODUCT rules) was same as 0 ms. Another results on the desktop computer of slower speed (Intel Core 2 Duo 2.1 GHz CPU, 2 GB RAM, and Windows XP OS) showed that the processing time of all methods (MIN, MAX, SUM, Weighted SUM, and PRODUCT rules) were same as 0 ms, also.
4. Conclusion
In this paper, we propose a new QBH system that uses the STA method as a pitch extractor and score level fusion of five matchers based on the PRODUCT rule. We also normalized the features of the music and humming data through mean-shifting, median and average filtering, and the min-max scaling method to eliminate the sur-rounding and peak noises that occur during recording.
In future works, we plan to research the methods to increase the matching accuracy and combine multiple classifiers using a training-based method. Furthermore, using a pre-classification method based on the global features, we would research about the reduction of search time and matching errors [13]. In addition, we would study about the matching algorithm based on the significant points such as the local maximum, minimum or onset points.
Abbreviations
DTW: dynamic time warping; ED: Euclidean distance; EMD: earth mover’s distance; LS: linear scaling; LSH: locality sensitive hashing; MIDI: musical instrument digital interface; MRR: mean reciprocal rank; PMP: portable media player; QB: quantized binary; QBH: humming; QBS: query-by-singing; QBSH: query by singing and humming; RA: recursive alignment; STA: spectro-temporal autocorrelation; STFT: short time Fourier transform; UDR: up-down-repeat.
Acknowledgements
This work was supported by the Ministry of Knowledge Economy grant funded by the Korea government (No. 2010-S-001-01).
Author details
1
Division of Electronics and Electrical Engineering, Dongguk University, 26, Pil-dong 3-ga, Chung-gu, Seoul, Republic of Korea2Digital Media Research Center, Korea Electronics Technology Institute, 9FL, Electronics Center, #1599, Sangam-dong, Mapo-gu, Seoul, Republic of Korea
Competing interests
The authors declare that they have no competing interests.
Received: 12 November 2010 Accepted: 14 July 2011 Published: 14 July 2011
References
1. JH McClellan, RW Schafer, MA Yoder,Signal Processing First(Pearson Prentice Hall, 2003)
2. X Wu, M Li, J Liu, J Yang, Y Yan, A top-down approach to melody match in pitch contour for query by humming, inProceeding of International Conference of Chinese Spoken Language Processing(2006)
3. RJ McNab, et al, Toward the digital music library: tune retrieval from acoustic input, inProceedings of the first ACM Conference on Digital Libraries, pp. 11–18 (1996)
4. RJ McNab, et al, The New Zealand digital library melody index. Digital Libraries Magazine (1997)
5. A Kornstadt, Themefinder: a web-based melodic search tool. Comput Musicol.11, 231–236 (1998)
6. Themefinder, http://www.themefinder.org. (accessed on July 14, 2011) 7. S Blackburn, D DeRoure, Tool for content based navigation of music, in
Proceedings of ACM Multimedia, pp. 361–368 (1998)
8. R Typke, P Giannopoulos, RC Veltkamp, F Wiering, R van Oostrum, Using transportation distances for measuring melodic similarity, inISMIR, pp. 107–114 (2003)
9. A Ghias, et al, Query by humming–musical information retrieval in an audio database, inProceedings of ACM Multimedia, pp. 231–236 (1995)
10. L Prechelt, R Typke, An interface for melody input, inACM Transactions on Computer-Human Interaction, pp. 133–149 (2001)
11. JSR Jang, MY Gao, A query-by-singing system based on dynamic programming, inInternational Workshop on Intelligent Systems Resolution (the 8th Bellman Continuum), Hsinchu, Taiwan, pp. 85–89 (December 2000) 12. M Ryynanen, A Klapuri, Query by humming of MIDI and audio using locality
sensitive hashing, inProceedings of the 2008 IEEE International Conference on Acoustics, Speech, and Signal Processing, pp. 2249–2252 (April 2008) 13. GP Nam, KR Park, SJ Park, SP Lee, MY Kim, A new query by humming
system based on the score level fusion of two classifiers. Int J Commun Syst (2011, in press)
14. KC Kim, KR Park, SJ Park, SP Lee, MY Kim, Robust query-by-singing/ humming system against background noise environments. IEEE Transactions on Consumer Electronics (2011, in press)
15. GP Nam, KR Park, SP Lee, EC Lee, MY Kim, KC Kim, Intelligent query by humming system, inProceedings of the ICUT Workshop (IWUCA) (December 2009)
16. L Wang, S Huang, S Hu, J Liang, B Xu, An effective and efficient method for query by humming system based on multi-similarity measurement fusion, inProceedings of ICALIP, pp. 471–475 (2008)
17. TTT Luong, GP Nam, MY Kim, KR Park, SP Lee, SJ Park, An study on query by humming system, inProceedings of the IEEK Summer Conference, pp. 127–130 (June 2010)
18. HH Nam Enhancing the matching speed on query-by-humming system by combining global matching and dynamic time warping algorithm, (Master Thesis in Dongguk University, 2011)
19. I Cohen, Noise spectrum estimation in adverse environments: improved minima controlled recursive averaging. IEEE Trans Speech Audio Process. 11(5), 466–475 (2003). doi:10.1109/TSA.2003.811544
20. YD Cho, MY Kim, SR Kim, A spectrally mixed excitation (SMX) vocoder with robust parameter determination, inProceedings of the IEEE International Conference on Acoustics, Speech, Signal Processing, Seattle, WA, pp. 601–604 (1998)
21. RC Gonzalez, RE Woods,Digital Image Processing(Addison-Wesley, MA, 1992)
22. J Song, SY Bae, K Yoon, Mid-level music melody representation of polyphonic audio for query-by-humming system, inProceedings of International Symposium on Music Information Retrieval, pp. 133–139 (2002) 23. HH Nam, GP Nam, KR Park, Query by humming system based on local
maximum minimum point of pitch and pitch distribution feature, in Proceedings of Korea Signal Processing Conference(2010)
24. Skewness, http://en.wikipedia.org/wiki/Skewness, (accessed on July 14, 2011) 25. A Ross, A Jain, Information fusion in biometrics. Pattern Recogn Lett.24(13),
26. 2006 MIREX QBSH corpus, http://www.music-ir.org/mirex/wiki/2006: Main_Page, (accessed on July 14, 2011)
27. 2009 MIR-QBSH corpushttp://www.music-ir.org/mirex/wiki/2009: Query_by_Singing/Humming, (accessed on July 14, 2011)
28. J Salamon, M Rohrmeier, A quantitative evaluation of a two stage retrieval approach for a melodic query by example system, in10th International Society for Music Information Retrieval Conference, pp. 255–260 (2009)
doi:10.1186/1687-6180-2011-21
Cite this article as:Namet al.:Intelligent query by humming system
based on score level fusion of multiple classifiers.EURASIP Journal on
Advances in Signal Processing20112011:21.
Submit your manuscript to a
journal and benefi t from:
7Convenient online submission 7Rigorous peer review
7Immediate publication on acceptance 7Open access: articles freely available online 7High visibility within the fi eld
7Retaining the copyright to your article
![Figure 9 Local maximum and minimum point-based LSalgorithm [18,23]. (a) humming data; (b) MIDI data.](https://thumb-us.123doks.com/thumbv2/123dok_us/1146899.1143931/8.595.57.292.446.704/figure-local-maximum-minimum-point-based-lsalgorithm-humming.webp)