Volume 2009, Article ID 351626,10pages doi:10.1155/2009/351626
Research Article
Pattern Projection with a Sinusoidal Phase Grating
Elena Stoykova, Jana Harizanova, and Ventseslav Sainov
Central Laboratory of Optical Storage and Processing of Information, Bulgarian Academy of Sciences, P.O. Box 95, 1113 Sofia, Bulgaria
Correspondence should be addressed to Elena Stoykova,[email protected]
Received 1 October 2007; Accepted 21 March 2008
Recommended by John Watson
The aim of this work is to study the diffractive properties of a sinusoidal phase grating for incorporation as a pattern projection element in a multisource and multicamera phase-shifting profilometric system. Two challenges should be overcome for successful operation of such a system, which are connected to inherent limitations of the phase-shifting algorithm—requirements for a sinusoidal fringe profile and for equal background and contrast of fringes in the recorded patterns. As a first task, we analyze the frequency content of the projected fringes in the Fresnel diffraction zone for parallel and divergent light illumination at different grating parameters and wavelengths. As a second task, we evaluate the systematical errors due to higher harmonics and multiwavelength illumination. Finally, operation of the four-wavelength profilometric system is simulated, and the error of the profilometric measurement evaluated. The results of test measurements are also presented.
Copyright © 2009 Elena Stoykova et al. This is an open access article distributed under the Creative Commons Attribution License, which permits unrestricted use, distribution, and reproduction in any medium, provided the original work is properly cited.
1. Introduction
Parallel acquisition of information as an inherent property of optical methods stimulated development of various optical techniques for noncontact measurement of surfaces of 3D objects and scenes. Among existing techniques, the methods which rely on a functional relationship of the sought object data with the phase of a periodic fringe pattern (FP) pro-jected onto and reflected from the object occupy a special place as a metrological means with noncomplex setups and processing algorithms that are suitable for outdoor imple-mentation [1,2].
Phase retrieval from a deformed FP, recorded as a function of spatial coordinates and time, requires solution of a nonlinear inverse problem based on fringe analysis of a fringe profile [2]:
Ir,t=I0
r,t+IVr,tfϕr,t+φr,t, (1)
where I0(r,t) is a slowly varying background intensity, IV(r,t) is a fringe visibility which is also a low-frequency signal, f[· · ·] is a periodic function, f ∈ [−1, 1], and ϕ(r,t) is a phase term related to the measured parameter, for example, an object profile. The additional phase term φ(r,t) is optional, being introduced during the formation of the waveform f or during the phase evaluation process.
As the phase retrieval involves nonlinear operations, many algorithms need some constraints to be applied.
fringe modulation [12,13], phase demodulation based on fringe skeletonizing when an extreme map is introduced by locating the fringes minima and maxima [14, 15], phase-stepping recovery of objects by numerical generation of multiple frames from a single recorded frame [16]. However, spatial methods usually rely on a slow phase variation within the FP, which hampers analysis of wideband FPs, or requires time-consuming iterations. As it seems, fast acquisition of multiple FPs is a more effective technical solution for the real-time capture.
In the case ofMrecorded FPs,Im(x,y),m=1, 2,. . .,M, which are equally shifted at a phase stepφ, the object phase is determined from the expression [2,17]
ϕ(x,y)=arctan
M
m=1bmIm(x,y)
M
m=1amIm(x,y)
, (2)
where the coefficientsam,bm depend on the phase stepφ. This phase-shifting technique is a very popular pointwise approach for phase demodulation due to its high accuracy and large dynamic range. It is widely applied in its temporal modification with successive recording of the FPs in time, thus being inapplicable for a real-time capture.
Recently, there have been some reports on real-time recording/processing of phase-shifted patterns [4, 18–20]. A single-shot measurement by simultaneous projection of three colour patterns (red, green, and blue) on the object at different angles and Fourier analysis of the deformed image recorded by a single CCD camera are described in [18,19]. A phase-stepping method for measuring the 3D surface profile of a moving object by projection of a sinusoidal grating pattern and continuous intensity acquisition by three phase-shifted linear array sensors positioned along the projected stripes is proposed in [20]. The method is restricted to objects moving at a constant speed. High-resolution 3D measurement of absolute coordinates using three phase-shifted fringe patterns coded with three primary colors and recorded at data acquisition speed of 90 fps is presented in [4].
In [21], we proposed a technical solution of a single-shot pattern projection profilometric system with simultaneous projection and recording of four phase-shifted FPs which are generated at four different wavelengths. The system includes a pattern projection module with four projection elements irradiated by four near-infrared diode lasers and a registration module with four CCD cameras. As candidates for a projection element, a sinusoidal phase grating and a holographic optical element which reconstructs two point sources have been discussed [21]. Technical simplicity of setup, easy manufacturing, reproducibility of the desired modulation and spacing, high efficiency, minimization of the phase-shifting error, and independence of the spatial period of the diffraction pattern on the wavelength advocated strongly the choice of the phase grating. This solution determines the aim of this work which is to study the diffractive properties of a sinusoidal phase grating for incor-poration as a pattern projection element in a multisource and multicamera profilometric system. Two challenges should be overcome for successful operation of such a system,
which are connected to inherent limitations of the phase-shifting algorithm—requirements for a sinusoidal fringe profile and for equal background and contrast of fringes in the recorded FPs. As a first task, we analyze the frequency content of the projected fringes in the Fresnel diffraction zone for parallel and divergent light illumination at different grating parameters and wavelengths. As a second task, we evaluate the systematical errors due to higher harmonics and multiwavelength illumination. Finally, operation of the four-wavelength profilometric system is simulated, and the error of the profilometric measurement is evaluated. The results of test measurements are also presented.
2. Four-Wavelength Pattern
Projection System
Optical arrangement of the four-wavelength profilometric system is presented inFigure 1. The fringe pattern generation module consists of 4 blocks corresponding to four different wavelengths (λ1–λ4) as shown inFigure 1, where DL1–DL4 are 20 mW CW single-mode diode lasers, and G1–G4 are identical sinusoidal phase gratings. The diode lasers emit in NIR spectral region at wavelengths of λ1 = 790 nm,λ2
= 810 nm,λ3 = 850 nm, and λ4 = 910 nm. The pattern generation module ensures simultaneous projection of four sinusoidal patterns of equal spacing that are phase-shifted at π/2. To optimize the optical efficiency of wavelength mixing, the different interference mirrors (IM1–IM3) are used as follows: the mirror IM1 transmits λ1 and reflects λ2, the mirror IM2 transmitsλ1,λ2 and reflectsλ3,λ4, and the mirror IM3 transmits λ3 and reflects λ4. The object is illuminated by the four patterns simultaneously using a projection objective.
The registration module consists of four synchronized CCD cameras for simultaneous capture of the FPs which have been deformed by the measured surface. The spectral separation of the individual patterns is provided by a second set of interference mirrors, that is, IM1–IM3. The recorded FPs are further processed by a four-step phase-shifting algorithm with M = 4 and φ = π/2 in (2). The precise positioning and adjustments of cameras and optical elements are required to avoid possible systematic errors and to ensure parallel recording of the phase-shifted patterns, modulated by the object surface.
3. Frequency Content of Diffraction Pattern
from a Sinusoidal Phase Grating
3.1. Theory. If the phase-shifting algorithm (2) is applied for phase retrieval, violation of the assumption f[· · ·] =
DL 3
G3
λ3
IM 3
DL 1
G1
λ1
IM 1
DL 2
G2
λ2
IM 2 DL 4
G4
λ4
L
Z
α
X
Z
X
Objective
CCD 3
λ3
λ4
IM 3 CCD 4
IM 1
λ1
CCD 1 IM 2
CCD 2
λ2
Figure1: Optical arrangement of the four-wavelength pattern projection system—DL1-4: diode lasers, G1-4: diffraction gratings, IM1-3:
interference mirrors.
diffraction gratings [23], however at the expense of higher harmonics in the projected pattern.
Over the years, the systematic errors caused by the nonlinearity of phase-shifters and recording devices or by the presence of higher harmonics have been comprehensively studied [23, 24] and, as a result, rather elaborated error-compensating algorithms have been proposed. The short-coming of these algorithms is their controversial behavior: the more efficient they are in suppressing the systematic error, the more vulnerable they become to random errors. Quite often, the solution is found in presuming that the higher harmonics are negligible in the projected pattern [24], but one could hardly take this assumption for granted without analysis of the frequency content of the projected fringes. For example, higher harmonics are unavoidable in the fringe profile f(x,y) created by a defocused Ronchi grating which is a popular way to generate sinusoidal fringes [25,26]:
f(x,y)=a0+ Q
q=1 sinc
πq
2
J1(2πqb/2) πqb/2 cos
2πqx
L ,
(3)
wherea0is the average value,Qis the number of harmonics, Lis the grating spacing, andbis defocusing parameter; the grating lines are parallel to they-axis.
A thin sinusoidal phase grating located in the (X,Y) plane with grating lines parallel to they-axis is characterized with transmittance [27]:
τ(x,y)=exp
jmsin
2πx
L =
∞
q=−∞
Jq(m) exp
j2πqx L ,
(4)
where m is the modulation parameter, L is the grating spacing along thex-axis, andJq is a Bessel function of the
first kind (orderq). At illumination with a unit-amplitude normally incident plane wave, the Fresnel diffraction pattern at distancezbehind the grating is a structure that is periodic along the directionsxandz. A complex amplitudeU(x,y,z) in this case can be found using the transfer function approach [26], with the transfer function being valid for Fresnel diffraction:
Hfx,fy=exp(jkz) exp−jπλzf2 x + fy2
(5)
which yields
U(x,y,z)
=J0(m) +
∞
q=1
Jq(m) exp
j2πqx
L +J−q(m)
exp
−j2πqx
L exp
−jπλzq 2
L2
= −J0(m) + 2
∞
q=0
J2q(m)cos
4qπx L
cos
(2q)2πλz
L2
−jsin
(2q)2πλz
L2
+jJ2q+1(m) sin
(2q+ 1)2πx
L
cos
(2q+ 1)2πλz
L2
−jsin
(2q+ 1)2πλz
L2
.
(6)
factor exp(jkz) is omitted as representing a constant phase delay at all spatial frequencies, and the equality J−q(m) = (−1)qJq(m) is taken into account. The finite extent of the grating aperture is neglected. As can be seen, the intensity distributionI(x,y,z)=UU∗ obtained from the expression (6) is not sinusoidal. The amplitudes of different harmonics and hence the profile of the projected fringes along thex- and z-axes depend on the grating spacing (L), the wavelength (λ), and the modulation parameter (m).
Along thex- andz-axes, the diffraction pattern consists of alternating zones with a phase-reversed contrast. Along the x-axis, due to the limited aperture of the objectives used for projection and recording of fringes, we can freely assume that we project a part of the diffraction pattern that contains only fringes with equal contrast. The fact that the fringe spacing does not depend on the wavelength can be used to illuminate the object by spatially similar fringes at different wavelengths in order to record simultaneously the deformed FPs by separate CCD cameras and to overcome the main drawback of the temporal phase-shifting profilometry in which acquisition of patterns is made successively in time. The spatial period of the first harmonic along the x-axis depends only on the grating spacing. The spatial period of the first harmonic along thez-axis depends on all three parametersL,λ, andm. The alternating zones with a phase-reversed contrast along the z-axis are located between the planes which correspond to
zn =2nL2
λ , n=0, 1, 2,. . ., zn = (2n+ 1)L
2
λ , n=0, 1, 2,. . .
(7)
The planes located at zn and zn, n = 1, 2,. . ., contain a “perfect” grating image with uniform intensity distribution equal to unity. These planes correspond to Talbot images [27]. The length of the zone along thez-axis with a phase-constant contrast of fringes for the first harmonic is equal to dz1 = zn−zn = L2/λ, respectively. The length of this zone for the second harmonic is dz2 = L2/2λ, and for the qth harmonic it isdzq =L2/qλ. This means that the second harmonic is eliminated in the planes parallel to the grating and located at
zn =
2n+1 2
L2
λ, n=0, 1, 2,. . . . (8) However, the amplitude of the third harmonic is maximal in these planes. As should be expected, the modulation parameter maffects intensely the frequency content of the diffraction pattern. We evaluated its influence in the interval from 0.1 up to 1.6. The first-order harmonic dominates at all values of m. The degrading effect of higher-order harmonics becomes unacceptable at m, being greater than 0.3. The zones that are close to the distances, z = zn, n = 0, 1, 2,. . ., appear to be optimal for fringe projection because, at least theoretically, the energy in the first harmonic reaches the maximum form, up to 0.6–0.8 atz=zn, whereas the second harmonic is missing. As it seems, by a proper choice of the modulation parameter (m) and the distance
0 2 4 6 8 10 12 14 16
Distance (cm) 0
50 100 150 200 250
I
(a.u.)
910 nm 790 nm
Figure 2: Spatial variation of energy concentrated in the first
harmonic along the z-axis in the Fresnel zone at plane-wave illumination of a sinusoidal phase grating.
(z), the influence of the higher diffraction orders could be minimized. However, location of these optimal planes along thez-axis varies with the wavelength.Figure 2depicts spatial variation of the energy concentrated in the first harmonic along thez-axis for the wavelengths 790 nm and 910 nm for a grating spacingL=0.025 cm andm=0.2.
Obviously, the difference between the values ofzn cor-responding to wavelengthsλ1,λ2increases as
zn
λ1
−zn
λ2
=
2n+1 2 L
2
1 λ1−
1 λ2
, n=0, 1, 2,. . ., (9)
along with the distance from the grating. In practical realization of the system, the four gratings are located at the same distance from the projective lens. This means that it will be difficult to ensure the same contrast and spectral content of the FPs projected at different wavelengths if the distance between the gratings and the projective lens is too large. Theoretically, atL =0.25 cm,z0(790 nm)−z0(910 nm) = 0.52 cm, whereasz1(790 nm)−z1(910 nm)=2.6 cm. If the distance from the grating is chosen within the above intervals and the modulation parameter is kept low, one could expect a practically sinusoidal profile of the same contrast for fringes projected at 790, 810, 850, and 910 nm. This conclusion is confirmed byFigure 3which gives the intensity distribution and the spatial frequency spectrum as a function of the wavelength atz=10.5 cm.
0.5 1 1.5
I
(a.u.)
1
0.5
0
X(cm)
800 850
900
Wavelength (nm)
L=0.25 cm
m=0.2
(a)
0 50 100 150 200 250
I
(a.u.)
950 900
850 800
750 W
avelength
(nm) 250 200 150
100 50 0
Spatialfreq. (cm −1) L=0.025 cm
m=0.2
(b)
Figure3: The intensity distribution and spatial frequency spectrum
of the light transmitted by a sinusoidal phase grating with L =
0.025 cm in the Fresnel zone as a function of the wavelength at
z = 10.5 cm for a plane-wave illumination. For convenience, the part of the spectrum at the fundamental frequency is omitted.
this beam is created by a point source at distance s from the grating, the fringe spacing is magnified according to the geometrical formula (similar triangles):
Λ(z)=1 +z
s, (10)
whereΛdenotes the magnification. In this case, the Talbot planes of grating self-imaging can be found at [28]
1 zT +
1 s =
λ
nL2, (11)
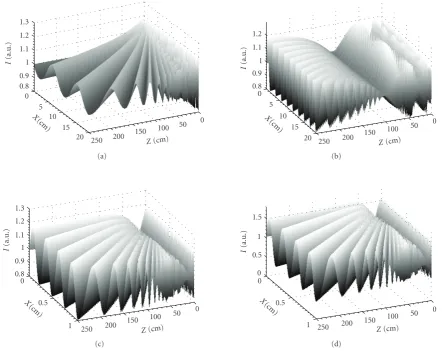
wherezT is thez-coordinate of a Talbot plane, and nis an integer.Figure 4gives the intensity distribution behind the grating withL=0.025 cm along thex- andz-axes depending on the distance (s) between the point source and the grating. The diffraction pattern is calculated for illumination with a spherical wave at paraxial approximation [29] for λ =
790 nm. As can be seen, ats=7 cm there is no Talbot plane, ats=12 cm the plane is only one, whereas ats=30 cm the Talbot planes are three. Hence, by using a divergent beam it is
possible to ensure an equal contrast of fringes within a large 3D volume.
3.2. Experiment. To find the frequency content of the pattern created by a sinusoidal phase grating, we per-formed test measurements at different wavelengths using the optical arrangement in Figure 5. The divergent light beam (expanded by the lens L1) from the diode laser DL illuminates the grating SDG. The distance between the light source and the grating remained fixed. We recorded the FPs projected onto the ground glass screen GGS at varying distance z (as indicated in Figure 5) for three different positions of the projector lens L2 with respect to the grating. Recording the phase gratings on a high-resolution holographic plate HP-650, laboratory production of CLOSPI-BAS (Bulgaria) was accomplished by an interferometric optical arrangement with an He-Ne laser (λ = 632.8 nm, 30 mW). An interference pattern was generated using an adjustable Michelson interferometer which provided equidistant sinusoidal fringes, whose period could vary in broad limits. The chemical processing of the holographic plates [30] was realized with a fixing developer which ensured formation of colloidal silver grains, practically phase recording, low level of noise, and high diffraction efficiency up to 70% in NIR. The required modulation of the recorded interference patterns was achieved by proper selection of exposures to fall into the dynamic range 0.5– 1.5 mJ/cm2.
Figures6(a),6(b),6(c), and6(d)show 1D Fourier spectra of the projected fringes at z = 70 cm depending on the distanced(seeFigure 5) and the wavelength. Each spectrum is averaged over the whole registered FP. As can be seen, the frequency content of the FPs at different wavelengths is rather close for a divergent beam illumination. The distance d=10 cm inFigure 5seems to be optimal for generation of sinusoidal fringes.
4. Systematic Errors of Phase Retrieval
0.8 0.9 1 1.1 1.2 1.3
I
(a.u.)
0 5
10 15
20
X(cm)
250 200
150 100 50 0 Z(cm)
(a)
0.8 0.9 1 1.1 1.2
I
(a.u.)
0 5
10 15
20
X(cm)
250 200
150 100 50 0 Z(cm)
(b)
0.8 0.9 1 1.1 1.2 1.3
I
(a.u.)
0 0.5
1
X(cm)
250 200
150 100 50 0 Z(cm)
(c)
0 0.5 1 1.5
I
(a.u.)
0 0.5
1
X(cm)
250 200 150
100 50 0 Z(cm)
(d)
Figure4: The intensity distribution of the light transmitted by a sinusoidal phase grating withL =0.025 cm in the Fresnel zone for a
spherical wave illumination: (a)m=0.1,s=7 cm; (b)m=0.1,s=30 cm; (c)m=0.1,s=12 cm; (d)m=0.3,s=12 cm.
DL
L1 SDG L2
GGS
CCD
d Z
Figure5: Optical arrangement for determination of frequency content of patterns projected by a sinusoidal phase grating—DL: diode laser,
L1, L2: lenses, SDG: sinusoidal phase grating, GGS: ground glass screen.
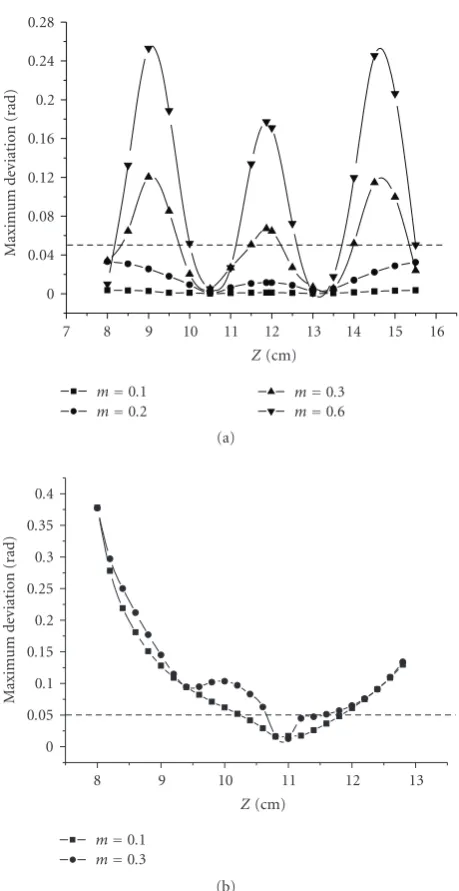
content in the fringes. As can be seen, the error has a periodical distribution along thez-axis and is quite small for a modulationm≤0.3.Figure 7(b)gives the systematic error in the case when the four FPs are generated at 790, 810, 850, and 910 nm for a plane-wave illumination. Comparison with the previous figure (Figure 7(a)) clearly shows the substantial influence of the difference in the wavelengths on the accuracy of the phase retrieval; the error is acceptable only in a small area which includes the values of z for the considered wavelengths.
Fortunately, the result obtained with four-wavelength illumination with a spherical wave in paraxial approximation is more encouraging. The maximum deviation between the phase estimate and the real phase is depicted in Figure 8. As can be seen, the error does not exceed 0.06 rad form =
0.3 within a very large range of distances from the grating. To explain why its value is so small, we include in the figure (Figure 8) the profiles of the four fringes projected at 790, 810, 850, and 910 nm for z = 140 cm and z =
790 nm
d=10.5 cm
0.01 0.1 1
P
(a.u.)
d=10 cm
0.01 0.1 1
P
(a.u.)
d=9.5 cm
0.01 0.1 1
P
(a.u.)
0 0.025 0.05 0.075
Spatial frequency (a.u.) (a)
810 nm
d=10.5 cm
0.01 0.1 1
P
(a.u.)
d=10 cm
0.01 0.1 1
P
(a.u.)
d=9.5 cm
0.01 0.1 1
P
(a.u.)
0 0.025 0.05 0.075
Spatial frequency (a.u.) (b)
850 nm
d=10.5 cm
0.01 0.1 1
P
(a.u.)
d=10 cm
0.01 0.1 1
P
(a.u.)
d=9.5 cm
0.01 0.1 1
P
(a.u.)
0 0.025 0.05 0.075
Spatial frequency (a.u.) (c)
910 nm
d=10.5 cm
0.01 0.1 1
P
(a.u.)
d=10 cm
0.01 0.1 01
P
(a.u.)
d=9.5 cm
0.01 0.1 1
P
(a.u.)
0 0.025 0.05 0.075
Spatial frequency (a.u.) (d)
7 8 9 10 11 12 13 14 15 16
Z(cm) 0
0.04 0.08 0.12 0.16 0.2 0.24 0.28
Ma
xi
m
u
m
d
ev
ia
ti
o
n
(r
ad
)
m=0.1
m=0.2
m=0.3
m=0.6 (a)
8 9 10 11 12 13
Z(cm) 0
0.05 0.1 0.15 0.2 0.25 0.3 0.35 0.4
Ma
xi
m
u
m
d
ev
ia
ti
o
n
(r
ad
)
m=0.1
m=0.3
(b)
Figure7: Maximum deviation of the difference between the phase
estimate and the real-phase value for reconstruction of a plane surface at plane-wave illumination: (a) one-wavelength projection; (b) four-wavelength projection. Here,zis the distance between the grating and the plane.
even atm = 0.3. This result is confirmed by good quality of reconstruction of a plane from experimentally recorded patterns, as can be seen from the unwrapped phase map obtained for a GGS inFigure 5at illumination with 790, 810, 850, and 910 nm (Figure 9). The FPs are recorded using only one CCD camera.
To prove the applicability of the multiwavelength ap-proach with a sinusoidal phase grating as a projection element, we simulated reconstruction of a 3D surface of a dome in the case of the profilometric system inFigure 1that represents a conventional cross-axes optical arrangement. The simulation includes registration of four FPs which are deformed by the object and four FPs of the reference plane
0 100 200 300 400 500
Z(cm) 0
0.04 0.08 0.12 0.16 0.2 0.24
Ma
xi
m
u
m
d
ev
ia
ti
o
n
(r
ad
)
m=0.1
m=0.3
0.4 0.8 1.2 1.6
I
(a.u.)
0 10 20
X(cm) 0.4 0.8 1.2 1.6
I
(a.u.)
0 10 20
X(cm)
0.8 1 1.2
I
(a.u.)
0 10 20
X(cm) 0.8
1 1.2
I
(a.u.)
0 10 20
X(cm)
m=0.3
m=0.1
Figure8: Maximum deviation of the difference between the phase
estimate and the real-phase value for reconstruction of the plane surface from four fringe patterns recorded at four wavelengths with a spherical wave illumination (paraxial approximation); the plots in the inset give the lateral profile of the fringes generated atλ=790, 810, 850, and 910 nm. Here,zis the distance between the grating and the plane.
Figure9: Unwrapped phase map of a plane that is retrieved from
four fringe patterns projected by using four identical sinusoidal gratings and four diode lasers emitting at 790, 810, 850, and 910 nm.
without the object at the following values of the system parameters:L = 0.025 cm,λ1 = 790 nm,λ2 = 810 nm,λ3
Table1: Maximum negative and positive deviations in % from the dome height.
Distancez(m) Modulation parameterm
0.1 0.2 0.3 0.4
1.3 −0.18 −0.55 −0.75 −1.19
0.42 0.54 0.81 0.96
1.5 −0.26 −0.6 −0.79 −1.27
0.41 0.46 0.82 1.07
1.8 −0.49 −0.77 −1.14 −1.41
0.57 0.72 0.96 1.52
2.4 −0.81 −1.11 −1.53 −1.98
0.81 1.12 1.54 1.96
0 30 60 90
He
ig
h
t
100 200
300 400
X
100 200
300 400500 Y
m=0.1
(a)
0 30 60 90
He
ig
h
t
50 100
150 200
X
100 200
300 400500 Y
m=0.3
(b)
Figure 10: Reconstruction of a 3D surface by a phase-shifting
technique from four fringe patterns generated with four-wavelength divergent illumination. The projection distance isz = 1.3 m; the grating spacing isL=0.025 cm.
by a quality-guided algorithm [30] of both phase maps; (iii) subtraction of the unwrapped phase map corresponding to the reference plane from the unwrapped phase map corresponding to the object, and, finally, (iv) calculation of the 3D coordinates. The projected FPs are simulated for a spherical wave illumination in paraxial approximation. Simulation was made without any noise, and so no filtration is applied to the images.Figure 9depicts two reconstructions of the dome for m = 0.1 and m = 0.3. Small ripples can be noticed on the dome surface close to its apex for the latter case. We evaluated the accuracy of reconstruction for the distances within the interval from 1.3 m up to 2.4 m which corresponds to the smallest systematic errors in
Figure 8.Table 1gives the maximum values of the positive and negative deviations of the reconstructed surface from the real dome; the deviations are normalized to the dome height and multiplied by 100%. The obtained values of maximum deviations on the order of 0.5–2% prove that usage of a sinusoidal grating ensures acceptable accuracy of the profilometric measurement.
5. Conclusion
Fringe projection profilometric system which combines single-shot acquisition with phase-shifting processing algo-rithm for “real-time” surface measurement is presented. Sinusoidal phase gratings and single-mode diode lasers emitting at four different wavelengths ofλ1 =790 nm,λ2 = 810 nm, λ3 = 850 nm, λ4 = 910 nm are used. The main advantages of coherent illumination by NIR diode lasers are higher efficiency, larger focal depth, and fringes contrast, which lead to higher sensitivity and accuracy of measure-ment. Careful maintaining of grating modulation could ensure vanishing contribution of higher diffraction orders. The performance of the proposed four-wavelength system was checked by simulation of reconstruction of a plane and a 3D object (dome) for four identical gratings with L = 0.025 cm at different values of the grating modulation parameter. The problem of higher harmonics influence has been thoroughly analyzed. Both cases of collimated and divergent beam illumination have been studied. The results were experimentally verified. The analysis made confirms that the sinusoidal phase grating can serve as a projection element in a profilometric system as well as being used at multiwavelength illumination.
Acknowledgment
This work is supported by EC within FP6 under Grant no. 511568.
References
[1] F. Chen, G. M. Brown, and M. Song, “Overview of three-dimensional shape measurement using optical methods,”
[2] T. Kreis, “Computer-aided evaluation of holographic interfer-ograms,” inHolographic Interferometry: Principles and Meth-ods, P. K. Rastogi, Ed., , pp. 151–212, Springer, Heidelberg, Germany, 1994.
[3] B. V. Dorr´ıo and J. L. Fern´andez, “Phase-evaluation methods in whole-field optical measurement techniques,”Measurement Science and Technology, vol. 10, no. 3, pp. R33–R55, 1999. [4] S. Zhang and S.-T. Yau, “High-resolution, real-time 3D
absolute coordinate measurement based on a phase-stepping method,”Optics Express, vol. 14, no. 7, pp. 2644–2654, 2006. [5] M. Takeda, H. Ina, and S. Kobayashi, “Fourier-transform
method of fringe-pattern analysis for computer-based tomog-raphy and interferometry,” Journal of the Optical Society of America, vol. 72, pp. 156–160, 1982.
[6] M. Takeda and K. Mutoh, “Fourier transform profilometry for the automatic measurement of 3-D object shapes,”Applied Optics, vol. 22, no. 24, pp. 3977–3982, 1983.
[7] T. Kreis, “Digital holographic interference-phase measure-ment using the Fourier-transform method,” Journal of the Optical Society of America A, vol. 3, no. 6, pp. 847–855, 1986. [8] J. Zhong and J. Weng, “Spatial carrier-fringe pattern analysis
by means of wavelet transform: wavelet transform profilome-try,”Applied Optics, vol. 43, no. 26, pp. 4993–4998, 2004. [9] L. R. Watkins, “Phase recovery from fringe patterns using
the continuous wavelet transform,” Optics and Lasers in Engineering, vol. 45, no. 2, pp. 298–303, 2007.
[10] M. Servin and F. J. Cuevas, “A novel technique for spatial phase-shifting interferometry,”Journal of Modern Optics, vol. 42, no. 9, pp. 1853–1862, 1995.
[11] M. Servin, J. L. Marroquin, and F. J. Cuevas, “Demodulation of a single interferogram by use of a two-dimensional regularized phase-tracking technique,” Applied Optics, vol. 36, no. 19, pp. 4540–4548, 1997.
[12] P. H. Chan, P. J. Bryanston-Cross, and S. C. Parker, “Fringe-pattern analysis using a spatial phase-stepping method with automatic phase unwrapping,”Measurement Science and Tech-nology, vol. 6, no. 9, pp. 1250–1259, 1995.
[13] C. Quan, C. J. Tay, L. Chen, and Y. Fu, “Spatial-fringe-modulation-based quality map for phase unwrapping,” Ap-plied Optics, vol. 42, no. 35, pp. 7060–7065, 2003.
[14] C. J. Tay, C. Quan, F. J. Yang, and X. Y. He, “A new method for phase extraction from a single fringe pattern,” Optics Communications, vol. 239, no. 4–6, pp. 251–258, 2004. [15] C. Quan, C. J. Tay, F. Yang, and X. He, “Phase extraction from
a single fringe pattern based on guidance of an extreme map,”
Applied Optics, vol. 44, no. 23, pp. 4814–4821, 2005.
[16] M. de Angelis, S. De Nicola, P. Ferraro, A. Finizio, S. Grilli, and G. Pierattini, “Profile measurement of a one-dimensional phase boundary sample using a single shot phase-step method,”Optics and Lasers in Engineering, vol. 43, no. 12, pp. 1305–1314, 2005.
[17] K. Creath, “Phase-shifting holographic interferometry,” in
Holographic Interferometry: Principles and Methods, P. K. Rastogi, Ed., pp. 109–150, Springer, Heidelberg, Germany, 1994.
[18] O. A. Skydan, M. J. Lalor, and D. R. Burton, “Technique for phase measurement and surface reconstruction by use of colored structured light,”Applied Optics, vol. 41, no. 29, pp. 6104–6117, 2002.
[19] O. A. Skydan, M. J. Lalor, and D. R. Burton, “Using coloured structured light in 3-D surface measurement,” Optics and Lasers in Engineering, vol. 43, no. 7, pp. 801–814, 2005. [20] S. Yoneyama, Y. Morimoto, M. Fujigaki, and Y. Ikeda,
“Three-dimensional surface profile measurement of a moving
object by a spatial-offset phase stepping method,” Optical Engineering, vol. 42, no. 1, pp. 137–142, 2003.
[21] V. Sainov, E. Stoykova, and J. Harizanova, “Real time phase stepping pattern projection profilometry,” inSpeckles, From Grains to Flowers, vol. 6341 ofProceedings of SPIE, pp. 1–6, Nimes, France, September 2006.
[22] Y. Bitou, “Digital phase-shifting interferometer with an elec-trically addressed liquid-crystal spatial light modulator,” Op-tics Letters, vol. 28, no. 17, pp. 1576–1578, 2003.
[23] K. Hibino, B. F. Oreb, D. I. Farrant, and K. G. Larkin, “Phase shifting for nonsinusoidal waveforms with phase-shift errors,”
Journal of the Optical Society of America A, vol. 12, no. 4, pp. 761–768, 1995.
[24] H. Liu, G. Lu, S. Wu, S. Yin, and F. T. S. Yu, “Speckle-induced phase error in laser-based phase-shifting projected fringe profilometry,” Journal of the Optical Society of America A, vol. 16, no. 6, pp. 1484–1495, 1999.
[25] A. Styk and K. Patorski, “Identification of nonlinear recording error in phase shifting interferometry,”Optics and Lasers in Engineering, vol. 45, no. 2, pp. 265–273, 2007.
[26] G. Schirripa Spagnolo, D. Ambrosini, and D. Paoletti, “Dis-placement measurement using the Talbot effect with a Ronchi grating,”Journal of Optics A, vol. 4, no. 6, pp. S376–S380, 2002. [27] J. Goodman, Introduction to Fourier Optics, McGraw-Hill,
Boston, Mass, USA, 1996.
[28] B. F. Oreb and R. G. Dorsch, “Profilometry by phase-shifted Talbot images,”Applied Optics, vol. 33, no. 34, pp. 7955–7962, 1994.
[29] K. Patorski and S. Kozak, “Self-imaging with nonparabolic approximation of spherical wave fronts,”Journal of the Optical Society of America A, vol. 5, pp. 1322–1327, 1988.