N
N
ORFOLK
ORFOLK
N
N
EEDS
EEDS
A
A
NALYSIS
NALYSIS
S
S
UMMARY
UMMARY
R
R
EPORT
EPORT
D
RAFTR
EPORTAWAITING CONSULTATIONWITHP
ARTNERO
RGANISATIONSP
REPAREDBYSHARONQUANTRELLStrategic Framework
The Norfolk arm of the LSC aims to stimulate all in Norfolk to be ambitious and to ensure that everyone has the opportunity to achieve their goals.
It will achieve this by doing 5 key things:
1.
Encouraging Young People to Stay in Learning
This will mean increasing the number of young people staying in learning until 19, working to raise their levels of achievement and helping young people make a successful transition to the workplace.
2.
Increasing the Demand for Learning by Adults
This will mean attracting more people into learning, raising their levels of achievement and providing them both with skills for the workplace and with learning for pleasure.
3.
Maximising the Contribution of Learning to the Economy
This will mean raising skill levels in the workforce, working with employers, employees and trades unions to increase their investment in learning and addressing skills gaps and shortages.
4.
Raising Standards of Learning
This will mean raising the quality of learning provision, working to help people stay in learning and achieve their goals and making learning opportunities accessible and flexible enough to meet people’s needs.
5.
Tackling Disadvantage and Promoting Equality of Opportunity
This will mean helping everyone, including those most disadvantaged, to enter learning and improve their own prospects. It will mean ensuring that everyone has an equal opportunity to take up learning and achieve their ambitions.
C
ONTENTS1. ENCOURAGING YOUNG PEOPLETO STAYIN LEARNING...2
2. INCREASINGTHE DEMANDFOR LEARNINGBY ADULTS...2
3. MAXIMISINGTHE CONTRIBUTIONOF LEARNINGTOTHE ECONOMY...2
4. RAISING STANDARDSOF LEARNING...2
5. TACKLING DISADVANTAGEAND PROMOTING EQUALITYOF OPPORTUNITY...2
KEY ISSUES - SECTION 1... 6
KEY ISSUES - SECTION 2... 6
KEY ISSUES - SECTION 3... 7
KEY ISSUES - SECTION 4... 8
KEY ISSUES - SECTION 5... 9
BACKGROUND - THE NORFOLK ECONOMY...11
HISTORICAL INDUSTRIAL CHANGE... 12
OCCUPATIONALCHANGE 2000-2010... 13
SECTORALCHANGE 2000-2010... 14
POPULATION CHANGEIN NORFOLK... 19
SECTION 1 - ENCOURAGING YOUNG PEOPLETO STAYIN LEARNING...20
SCHOOL PERFORMANCE INDICATORS, 2000...21
SCHOOL YEAR 11 DESTINATIONS... 23
YEAR 11, LABOUR MARKET ENTRANTS - 2000...28
DESTINATIONDATAONEYEARON - YEAR 12...28
PARTICIPATIONAND RETENTION LEVELS (16-18 YEARS)...32
PARTICIPATION - FEMALESAGED 16-18 YEARS...32
RETENTION - FEMALESAGED 16-18 YEARS...33
PARTICIPATION - MALESAGED 16-18 YEARS...33
RETENTION - MALESAGED 16-18 YEARS...34
PARTICIPATIONOF 16-18 YEAROLDSBY LEVEL...35
LEVEL 1... 35
LEVEL 2... 35
LEVEL 3... 35
SECTION 2 INCREASINGTHE DEMANDFOR LEARNINGBY ADULTS...36
PARTICIPATION... 37
PARTICIPATIONAT LEVEL 3 ORLESS - FEMALESAGED 18-64 YEARS...37
PARTICIPATIONAT LEVEL 3 ORLESS - MALESAGED 18-64 YEARS...37
PARTICIPATIONAT LEVEL 4 ORABOVE - FEMALESAGED 18-64 YEARS...38
PARTICIPATIONAT LEVEL 4 ORABOVE - MALESAGED 18-64 YEARS...38
PARTICIPATIONOFSTUDENTSAGED 16-64 YEARSBYBROADPROGRAMMEAREA...38
SCIENCE (INCLUDINGMATHEMATICSANDCOMPUTING)...38
AGRICULTURE... 38
CONSTRUCTION... 38
ENGINEERING... 39
BUSINESS... 39
HOTELS & CATERING... 39
HEALTH & COMMUNITY CARE... 39
ART & DESIGN... 39
HUMANITIES... 40
BASIC EDUCATION... 40
TRAINING... 40
BARRIERSTOTRAINING - FORINDIVIDUALS...40
TAKINGPARTINTRAINING/LEARNING... 40
WHENWASTRAININGLASTUNDERTAKEN?...41
TYPEOFTRAININGUNDERTAKENDURINGTHEPASTTWELVEMONTHS...41
HOWWOULDRESPONDENTSCONSIDERTRAININGORLEARNING?...41
ADULTGUIDANCE... 42
RECENTLEARNING... 42
PERCEIVEDBENEFITSGAINEDFROMLEARNING...44
FUTURELEARNING... 45
WHOWILLPAYFORFUTURELEARNING/TRAINING?...46
HOWMUCHCURRENTSTUDYLEADSTOAQUALIFICATION?...46
PREVIOUSLEARNING/TRAININGWHICHWASNOTCOMPLETED...46
SECTION 3... 47
MAXIMISINGTHE CONTRIBUTIONOF LEARNINGTOTHE ECONOMY...47
TRAINING... 48
BARRIERSTOTRAINING - FOREMPLOYERS...48
IDENTIFYINGTRAININGNEEDS... 49
TRAININGPROVISION... 49
TRAININGPROVISIONBYOCCUPATION... 50
SKILLS... 51
FROMTHEEMPLOYERS' PERSPECTIVE, WHICHPARTICULARSKILLSREQUIREIMPROVEMENT?...51
RECRUITMENTDIFFICULTIES... 51
RECRUITMENTDIFFICULTIES - EMPLOYERS' VIEWPOINT...52
RECRUITMENTDIFFICULTIES - INDIVIDUALPERSPECTIVE...52
SKILLSGAPS... 53
SECTION 4... 55
RAISING STANDARDSOF LEARNING... 55
NATIONAL LEARNING TARGETS... 56
LEVELOFQUALIFICATIONBYLOCALAREA...59
NUMBERSINPOST - 16 LEARNING/TRAINING...63
LEARNING PROVIDER INSPECTIONS... 65
GRADINGSTRUCTURE... 65
FE COLLEGE INSPECTIONS... 77
BASIC SKILLS... 82
SECTION 5... 87
TACKLING DISADVANTAGEAND PROMOTING EQUALITYOF OPPORTUNITY...87
UNEMPLOYMENT... 88
UNEMPLOYMENT - UK AND NORFOLK... 88
LOCAL AUTHORITY DISTRICT UNEMPLOYMENT...88
TRAVELTO WORK AREA UNEMPLOYMENT...89
INDICESOF DEPRIVATION 2000... 90
INCOMEDEPRIVATION... 91
EMPLOYMENTDEPRIVATION... 92
HEALTHDEPRIVATIONANDDISABILITY... 93
EDUCATION, SKILLSANDTRAININGDEPRIVATION...94
HOUSINGDEPRIVATION... 95
GEOGRAPHICALACCESSTOSERVICES... 96
CHILD POVERTY INDEX... 98
DISTRICTSUMMARY - EMPLOYMENT... 98
DISTRICTSUMMARY - INCOME... 99
AVERAGEOFWARDSCORES... 100
AVERAGEOFWARDRANKS... 100
EXTENTRANK... 101
LOCALCONCENTRATION... 102
OCCUPATIONBYLOCALITY... 102
AVERAGEGROSSANNUALEARNINGS... 103
EQUAL OPPORTUNITIES... 104
ETHNICMINORITYGROUPS... 104
SCHOOL YEAR 11 DESTINATIONS - ETHNICITYDIFFERENCES...105
LONG-TERMILLNESSORDISABILITY... 106
OCCUPATIONBYGENDER... 106 GENDER-SPECIFICECONOMICINEQUALITIES...107 SELFEMPLOYMENTBYGENDER... 108
Key Issues - Section 1
When young people in Norfolk leave compulsory education they are less likely to enter post-16 learning than their regional counterparts.
The existing data (both survey-based and administrative) points to a link between the demographic and socio-economic characteristics of certain localities (both urban and rural) and the difficulties in engaging young people in learning.
However, the retention of young people in learning appears to be more directly related to rurality i.e. it is the rural localities where participation is lower than average which suffer from lower levels of retention rather than in the urban localities where participation is lower than average.
It is clear that current knowledge does not sufficiently explain geographical variations in participation and retention levels. Added to this, the frequent recurrence of anecdotal evidence relating to the low aspirations held by young people in Norfolk suggests that further investigation is required.
Key Issues - Section 2
As in Section 1, the existing data (both survey-based and administrative) points to a link between the demographic and socio-economic characteristics of certain localities (both urban and rural) and the difficulties in engaging people in learning.
As would be expected, participation in learning is spread unevenly across the adult population and opportunities for learning are biased towards higher occupational groups who tend to hold higher level qualifications.
At least one-half of people who say they will take part in learning over the coming twelve months expect their employer to pay for this activity. Full-time workers are more likely to expect this (and previous research shows that in the past they are more likely to have received this) than part-time workers which, implies that employment status is a contributory factor in access to learning.
Key Issues - Section 3
It is generally accepted that a positive relationship exists between productivity levels and the skills of the workforce. Acceptance of this assumption implies that the relatively low skills levels evident within the Norfolk workforce may well explain the forecast
deterioration in Gross Value Added per employee. Furthermore, average earnings in the County are well below the regional average, which, also indicates the existence of relatively, low productivity levels.
Norfolk is characterised by highly localised labour markets (evident from the distance people are willing/able to travel to work) because of constraints on labour mobility effected by transport issues and perhaps, by low wage levels which, are pushed even lower by the addition of transport costs.
Empirical evidence has shown that much of Norfolk’s industrial base is affected by skills shortages and skills gaps which, are instigated and exacerbated by persistently low levels of educational achievement. Norfolk's performance at Levels 2 and 3 is very weak and there is a clear mismatch between the supply and demand for intermediate level skills. Intermediate level occupations account for around one-half of all occupations in Norfolk.
The predominance of small employers in the Norfolk economy is well documented, as is the fact that smaller employers (<10 employees) are less likely to provide or arrange training than their larger counterparts. However, countering this is the point, that the largest 5% of employers employ around two-thirds of the County’s employees and at least one-half of these employees do not receive training. In terms of the magnitude of numbers involved, this amounts to more than the number of people working for small employers who do not receive training.
The dominance of SMEs is both a strength (higher levels of local autonomy) and a weakness (when some of these employers do not aspire to grow their business). In addition, the low rate of new firm start-ups, suggests that Norfolk needs to engender an entrepreneurial culture. This may be related to the comparatively, lower aspirations of significant numbers of young people mentioned earlier and suggests that further investigation should take place.
Key Issues - Section 4
One-half of all employers in Norfolk, including those who provide no training, believe that there are no obstacles that limit or present a barrier to the amount of training they undertake. Of the remainder, the most frequently mentioned obstacles relate to local training provision in terms of cost, quality, suitability and the inappropriate times at which courses are provided.
From the individual’s point of view, perceived barriers to training revolve mainly around the real price of training. This includes the cost of training per se, as well as transport costs, the cost of childcare and the opportunity costs of training, that is, the time spent on training.
It is highly unlikely that Norfolk will achieve the National Learning Targets set for 2002. The proportion of economically active adults qualified to Level 3+ is currently sixteen percentage points below target and at Level 4+ Norfolk is approximately seven percentage points below target.
Attainment at all levels is subject to a geographic bias, certain localities (the more affluent areas in terms of the occupational mix of residents) perform relatively well, while other localities (typically areas which suffer many types of deprivation) perform poorly.
Empirical evidence has shown that to a large extent, participation is determined by ease of access to learning. If learning opportunities are to be geared towards the learner this will mean that more flexible methods of learning will need to be provided. Added to this, the majority of adults in Norfolk hold very traditional attitudes towards learning; new and non-traditional methods of provision and location are not popular amongst either current or potential learners. However, the quantitative data gives no indication as to why this is the case which, points to a need for supplementary, attitudinal research to be
undertaken.
Key Issues - Section 5
Clearly, there are differences in the incidence of reported barriers to learning which affect particular groups of people. Although certain barriers appear to be gender-specific, (family commitments for women and lack of time for men), the percentages of men and women who have recently participated in learning are broadly similar.
In Norfolk, it is estimated that just 2% of the population fall into non-white ethnic groups. The available evidence indicates that locally, participation is unlikely to be influenced by ethnicity.
Income, employment status and occupation appear to be the most conspicuous factors influencing the decision to participate in learning. These factors also form the basis of the geographical spread of learning take-up. Wymondham for example, has the highest qualification levels in Norfolk and 60% of its working residents are employed in higher order occupations. At the other end of the spectrum lies Gt Yarmouth which has extremely low levels of educational attainment and is ranked the fifth most deprived Local Authority District in England.
Compared to the national average, each Parliamentary Constituency in Norfolk has a high proportion of the adult population who are regarded as on the borderline of
functional literacy and numeracy. Existing data is not able to explain the reasons for such high levels of low literacy and numeracy, which are found even in relatively affluent areas such as South Norfolk.
In Norfolk, at least, income deprivation and poor Basic skills appear to be linked. Every ward (except Regent in Gt Yarmouth) which has at least one-third of the population affected by income deprivation also has one-third of the population affected by poor levels of literacy and numeracy.
In effect, people with low basic skills are denied access to learning. Corroborative evidence is given in the Household survey data in which around 3% of unemployed adults feel that they are not very good at reading or writing, 1% mentioned they were not very good at maths and this had proved to be an obstacle to finding work. Local research is needed to gain insight into the problem.
Background - The Norfolk Economy
The structure of the Norfolk economy differs from that of the national economy in several ways:
Forecasts indicate that the national economy will achieve a 2.7% rate of growth over the period 1999 to 2001; the Norfolk economy is forecast a growth rate of 2.9% compared to 3.4% for the Eastern region.
Although the local economy comprises a majority of small employers (less than 5 employees), they provide just 7% of the jobs in Norfolk. The largest 5% of employers account for 70% of all jobs in the county
Around one-half of Norfolk's employees work for employers who employ more than 500 staff, whereas over 70% of UK employees work for employers with over 500 staff.
Proportionally, fewer firms in Norfolk were set up in the past 10 years than in the rest of the country, in which half of all firms are less than 10 years of age. However, the
relatively low start up rate is paralleled by a below average fatality rate.
Employers in Norfolk are generally ‘expansion minded’, but tough competition is a key issue for many businesses.
Three-quarters of Norfolk's firms are based in the service sector; the remainder of Norfolk’s employers are production businesses.
Compared with the region, Norfolk has a higher percentage of Wholesale, Retail & Repair and Hotel & Restaurant businesses, but considerably lower proportions of Real Estate, Renting & Business Activity firms.
Norfolk has the highest proportion of part-time workers in the Eastern region
In 1982, Gross Value Added per employee in Norfolk was higher than the regional average (roughly 104% of the regional figure). By 2010 it is predicted that it will be almost 5% below the regional average (see Figure 1) implying that productivity gains amongst employees in Norfolk have been lower than elsewhere in the region.
Figure 1
Source: Cambridge Econometrics LEFM
Historical Industrial Change
Table 1 illustrates the change in employee numbers in Norfolk by industry over the year 1998 to 1999.
Proportionally, the largest losses occurred in the Fishing industry which lost almost one-half (49%) of its 1998 level of employees, while the number of employees working in the
Electricity, Gas and Water Supply sector fell by one-third (32%) over the year.
Hotels and restaurants lost one-fifth (20%) of their 1998 workforce, as did the Financial
intermediation sector. The number of employees in Public Administration/Defence; Social Security fell by one-tenth (10%) and the numbers employed in Quarrying fell by 11%.
On a more positive note, the Construction industry saw employee numbers rise by 42% over the year. The number of employees in the Transport, Storage and Communication sector and the Real Estate, Renting and Business Activities sector rose by almost one-tenth (7% and 8% respectively).
As shown in the Table1 below, on balance, Norfolk's total employee numbers fell by almost
3% over the year to 1999. Table 1
1998 1999 CHANGE INDUSTRY
E
MPLOYEENUMBERS12,134 11,172 -961 Agriculture, hunting and forestry 238 122 -115 Fishing
2,173 1,937 -235 Mining and quarrying 50,149 47,411 -2736 Manufacturing
966 662 -303 Electricity, gas and water supply 13,017 18,413 5396 Construction
58,101 54,404 -3696 Wholesale/retail trade; repair, etc 25,357 20,292 -5063 Hotels and restaurants
13,928 14,929 1001 Transport, storage and communication 19,833 15,802 -4030 Financial intermediation
31,468 34,060 2592 Real estate, renting,business activities 14,099 12,646 -1452 Public administration/defence; social security 19,840 19,683 -156 Education
39,030 39,924 894 Health and social work
12,873 13,188 314 Other community, social/personal service
313,207 304,646 -8560 Total
1 Table 1 is based upon actual rather than forecast figures, during the period covered by the Table
unemployment in Norfolk was higher than it is currently. In January 1998 the unemployment rate in Norfolk stood at 5.7% compared to 3.3% in May 2001.
Source: Annual Business Inquiry NOMIS (Crown Copyright)
Occupational change 2000-2010
Table 2 illustrates that in Norfolk, Manager & Administrator occupations are forecast to increase more rapidly than in the UK or the Eastern region, with an expected growth rate per annum of 2.1% (against 1.8% for the Eastern region and 1.2% in the UK)
It is anticipated that Sales occupations will grow far more rapidly in Norfolk (2% p.a.) than in the UK (0.6% p.a.) or the Eastern region (0.5% p.a.)
A more rapid reduction is forecast in the number of Clerical & Secretarial occupations in Norfolk (-1.3% p.a.) relative to the Eastern region (-0.6% p.a.) and the UK (-0.7% p.a.)
In Norfolk, Craft & Skilled Manual (-0.3% p.a.) occupations are expected to decline, albeit more slowly than either the UK (-1.6% p.a.) or the Eastern region (-0.8% p.a.)
The number of Plant & Machine Operatives is forecast to fall in Norfolk (-1.7% p.a.) at a faster rate than in the UK (-0.2% p.a.). Conversely, the Eastern region as a whole will see marginal growth in this occupation of 0.1% p.a.
Table 2
OCCUPATION % GROWTHPERANNUM Norfolk
2000 - 2010
East of England 2000 - 2010
UK
2000 - 2010
Managers And Administrators 2.1 1.8 1.2 Professional Occupations 2.1 2.9 2.6 Associate Professional &
Technical Occupations
1.8 2.3 2
Clerical & Secretarial -1.3 -0.6 -0.7 Craft & Skilled Manual -0.3 -0.8 -1.6 Personal & Protective 1.9 3 2.5
Sales Occupations 2 0.5 0.6
Plant & Machine Operatives -1.7 0.1 -0.2
Other Occupations -2.1 -1 -2.6
Source: Cambridge Econometrics LEFM
Sectoral change 2000-2010
Total employment in Norfolk is predicted to rise by 9% between 2000-2010.
The largest increase (+27%) in employment is forecast to occur in the Hotels & Catering sector. Over the year from 1998 to 1999 the sector's share of employee jobs fall by two percentage points.
Table 3
NORFOLK TOTAL (FORECAST) EMPLOYMENT
INDUSTRIALSECTORS 2000 2010 % CHANGE
Agriculture, Forestry & Fishing 15,645 13,227 -15%
Oil & Gas Extraction 1,218 950 -22%
Chemicals 2,204 1,748 -21%
Minerals 1,750 1,411 -19%
Metals 4,608 4,616 **2
Machinery & Equipment 5,191 5,538 +7% Electrical & Optical Equipment 4,817 4,658 -3%
Transport Equipment 2,025 1,429 -29%
Food, Drink & Tobacco 11,230 9,775 -13%
Textiles & Clothing 1,558 498 -68%
Wood & Wood Products 1,494 1,117 -25%
Paper, Printing & Publishing 7,918 8,203 +4% Rubber & Plastics 4,426 4,835 +9% Other Manufacturing 3,772 3,625 -4%
Construction 29,735 33,993 +14%
Wholesaling 23,801 23,434 -2%
Retailing 39,712 46,686 +18%
Hotels & Catering 21,363 27,039 +27%
Transport 13,428 14,351 +7%
Communications 5,039 5,603 +11%
Banking & Insurance 11,031 13,620 +23% Other Financial & Business
Services 8,941 10,947 +22%
Business Services 36,729 45,093 +23% Public Admin. & Defence 11,742 10,950 -7%
Education 20,824 22,826 +10%
Health 39,319 42,396 +8%
Other (largely private) 17,827 20,581 +15%
Total 348,710 380,216 +9%
2 ** denotes < 0.5%
Source: Business Strategies Ltd
Large gains in employment are forecast to occur in the Banking & Insurance (+23%), Other Financial & Business Services (+22%) and Business Services (+23%) sectors.
Retailing, Norfolk's biggest industrial sector is likely to see a substantial increase in employment over the ten year period (+18%).
Employment in the Construction industry is predicted to grow (+14%), but the employee/ self-employed mix is expected to change slightly over the period, with the self-employed share rising by 2% to around 46% of total employment in 2010.
The greatest employment losses over the ten year period are expected to occur in the Textiles & Clothing industry (-68%).
The Wood & Wood Products sector is also predicted to sustain employment losses (-25%), as is the Transport Equipment industry (-29%) and the Chemicals sector (-21%).
The male labour force is expected to increase by 6,800 over the period, the corresponding increase in the female labour force is predicted at about 9,900.
The number of full-time male workers is predicted to fall by 2,300 (a fall in the rate of growth per annum of about 0.2%) over the ten year period. This fall is similar to that expected at the national level, at the regional level a rise of 0.9% p.a. is forecast (see Table 4).
However, the number of part-time male workers is forecast to increase by around 11,000 implying an expected growth rate per annum of around 4% from 2000-2010. This is a stronger rate of growth than is expected at either the national (3.5% p.a.) or the regional (3.6% p.a.) level.
Although growth in male self-employment is forecast to fall, Norfolk (-0.1% p.a.) will not be as badly affected as either the Eastern region (-0.4% p.a.) or the UK (-0.4% p.a.) Overall, between 2000-2010, male employment is set to rise by approximately 0.4% p.a. compared to 0.9% p.a. at the regional level and 0.3% p.a. at the national level.
A large increase (+12,200) in the number of full-time female workers is anticipated
indicating a rate of growth per annum of 1.5% compared to 1.7% p.a. at the regional level and 0.7% p.a. at the national level.
It is anticipated that the number of part-time female workers will also increase (by around 1,700) over the period 2000-2010, an estimated rate of growth per annum of 0.2%. This compares to 0.8% p.a. at the regional level and 1.2% at the national level.
As shown in Table 4, between 2000-2010, female employment in Norfolk is set to rise by 1% p.a., which corresponds exactly with the national growth per annum figure. Within the Eastern region, growth in female employment will be slightly stronger at 1.3% p.a.
Table 4
EMPLOYMENT - LOCALVS REGIONAL & NATIONAL - BY STATUS
%
CHANGESPERANNUM
Norfolk East of England UK
2000 - 2010 2000 - 2010 2000 - 2010
Male Full-time -0.2 0.9 -0.1
Male Part-time 4 3.6 3.5
Male Self-employed -0.1 -1.4 -0.4
Male Total 0.4 0.9 0.3
Female Full-time 1.5 1.7 0.7
Female Part-time 0.2 0.8 1.2
Female Self-employed 2.1 0.9 1.8
Female Total 1 1.3 1
Total Full-time 0.5 1.2 0.2
Total Part-time 1.3 1.6 1.8
Total Self-employed 0.5 -0.7 0.3
Total 0.7 1.1 0.6
source: Cambridge Econometrics LEFM
Turning to activity rates overall, male economic activity rates are set to fall from 71.6% of adult males in 2000 to 68.4% in 2010. Female economic activity rates will remain fairly constant at 53.6% of adult females in 2000 to 53.5% in 2010. In total, economic activity rates are set to fall from 62.4% of the adult population in 2000 to 60.8% of the adult population in 2010. Table 5 summarises the predicted changes in economic activity rates.
Table 5
NORFOLK ECONOMIC ACTIVITY RATESBY GENDER AND AGE BAND
2000 - 2010
M
ALES%
GROWTHPERANNUM16 - 24 yrs -0.2
25 - 34 yrs 0
35 - 44 yrs 0
45 - 59 yrs -0.2
60 - 64 yrs -0.2
65 yrs and over -0.5
F
EMALES16 - 24 yrs -0.1
25 - 34 yrs 0.5
35 - 44 yrs 0.5
45 - 59 yrs 0.1
60 - 64 yrs 1.1
65 yrs and over 0
T
OTAL16 - 24 yrs -0.2
25 - 34 yrs 0.2
35 - 44 yrs 0.2
45 - 59 yrs -0.1
60 - 64 yrs 0.2
65 yrs and over -0.2
source: Cambridge Econometrics LEFM
Population Change in Norfolk
The following Figure summarises expected changes in the County's demographic composition.
Figure 2
source: Cambridge Econometrics LEFM
As indicated in Figure 2, the number of children in Norfolk aged 0-15 years is expected to fall at a rate of 0.1% p.a. over the period from 2000 to 2010.
It is forecast that the number of young people (16-24 year olds) in the local population will expand at a rate of 1% p.a. Conversely, the number of people aged between 25-34 years is expected to fall by 1.7% p.a. over the period.
The number of 35-44 year olds is expected to rise by 0.7% p.a. and a similar increase is forecast in the 45-59 year old age group (0.6% p.a.). Cambridge Econometrics predict extremely large increases in the 60-64 year old age group (3.6% p.a.) and those aged over 65 years (1% p.a.).
These changes imply a sizeable relative decline in living standards (measured in terms of earned income) across the Norfolk population.
Section 1 - Encouraging Young People to Stay in Learning
Increasing the number of young people staying in learning until 19, working to raise their levels of achievement and helping young people make a successful transition to the workplace.
School Performance Indicators, 2000
Table 6 summarises particular school performance indicators for each of the counties in the Eastern region.
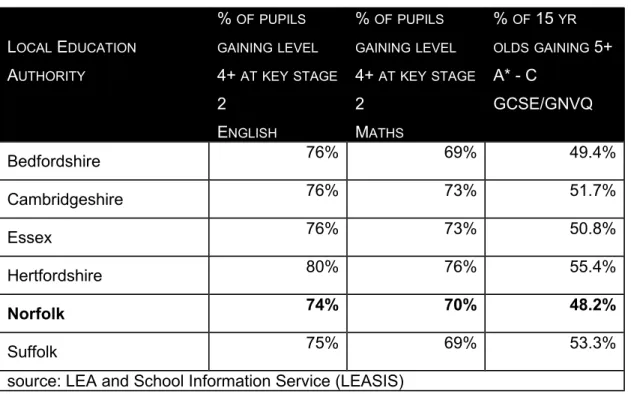
Table 6
LOCAL EDUCATION
AUTHORITY
% OFPUPILS
GAININGLEVEL
4+ ATKEYSTAGE
2
ENGLISH
% OFPUPILS
GAININGLEVEL
4+ ATKEYSTAGE
2 MATHS
% OF 15 YR
OLDSGAINING 5+
A* - C
GCSE/GNVQ
Bedfordshire 76% 69% 49.4%
Cambridgeshire 76% 73% 51.7%
Essex 76% 73% 50.8%
Hertfordshire 80% 76% 55.4%
Norfolk 74% 70% 48.2%
Suffolk 75% 69% 53.3%
source: LEA and School Information Service (LEASIS)
The percentage of pupils at Key Stage 2 gaining Level 4 or above in English was lower in Norfolk than elsewhere in the region. However, the difference between the highest achieving county and Norfolk was just six percentage points.
The proportion of pupils at Key Stage 2 gaining Level 4 or above in Maths was 70% in Norfolk, the Table shows that this was the median value between Bedfordshire and Suffolk with 69% and Hertfordshire with 76%.
% OF 15 YROLDSGAINING 5+ A* - C
In Norfolk, 48.2% of 15 year olds gained five or more GCSEs at A* - C. This was the lowest in the region and contrasts with Hertfordshire where 55.4% of 15 year olds gained five or
more GCSEs at A* - C. Hertfordshire also has the highest "staying on" rate in the region which illustrates the high levels of correlation between attainment at the end of compulsory education and participation in post-16 education.
Table 7 summarises the average proportions of the 2000, Year 11 cohort who entered full-time education.
Table 7
NORFOLKAVERAGESBY LAD
NUMBER
IN
COHORT
% 6TH
FORM
% FE COLLEGE
% ALL F/T
EDUCATION
Average - All High Schools 7974 33.2% 37.0% 70.2%
Average - Breckland High Schools 1,063 37.5% 29.4% 68.8% Average - Broadland High Schools 1,376 35.6% 37.9% 68.4% Average - Gt Yarmouth High Schools 1,021 0.1% 67.7% 67.8% Average - King's Lynn High Schools 1,437 34.9% 33.1% 67.9% Average - North Norfolk High Schools 788 24.9% 42.6% 67.5% Average - Norwich City High Schools 1,073 51.3% 19.9% 71.2% Average - South Norfolk High Schools 1,216 41.8% 33.1% 74.8% source: Norfolk Careers Service
As the Table indicates, in Norfolk, South Norfolk Local Authority District has the highest proportion of Year 11 leavers remaining in full-time education (74.8%), followed by Norwich City, where 71.2% of Year 11 leavers remained in full-time education.
The lowest levels of Year 11 leavers remaining in full-time education were recorded in the North Norfolk Local Authority District. Noticeably, this area also had the smallest cohort numbers.
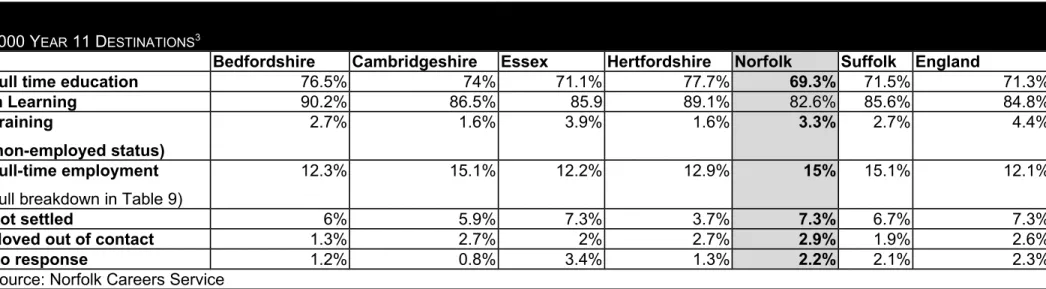
Table 8 overleaf gives a detailed breakdown of the 2000 Year 11 destination data for each of the counties in the Eastern region compared to the English average.
School Year 11 Destinations
The Table below illustrates the variations in Year 11 destinations between the six Eastern counties compared to the English average. Table 8
2000 YEAR 11 DESTINATIONS3
Bedfordshire Cambridgeshire Essex Hertfordshire Norfolk Suffolk England
Full time education 76.5% 74% 71.1% 77.7% 69.3% 71.5% 71.3%
In Learning 90.2% 86.5% 85.9 89.1% 82.6% 85.6% 84.8%
Training
(non-employed status)
2.7% 1.6% 3.9% 1.6% 3.3% 2.7% 4.4%
Full-time employment
(full breakdown in Table 9)
12.3% 15.1% 12.2% 12.9% 15% 15.1% 12.1%
Not settled 6% 5.9% 7.3% 3.7% 7.3% 6.7% 7.3%
Moved out of contact 1.3% 2.7% 2% 2.7% 2.9% 1.9% 2.6%
No response 1.2% 0.8% 3.4% 1.3% 2.2% 2.1% 2.3%
Source: Norfolk Careers Service
3 Analysis of young people completing Year 11, the final year of compulsary education in 2000. Snapshot survey undertaken in October 2000. Survey covers all maintained
Table 9 gives a more in-depth analysis of the variations in Year 11 destinations between the six Eastern counties. Table 9
2000 YEAR 11 DESTINATIONS
SUB-CATEGORIES Bedfordshire Cambridgeshire Essex Hertfordshire Norfolk Suffolk England
In training 13.7% 12.5% 14.8% 11.4% 13.4% 14.2% 13.5%
Gov. supported training 5.4% 6.6% 5.4% 4.6% 6.2% 6.7% 7.7% Employment with training
excluding Gov. supported training
8.3% 5.9% 9.4% 6.8% 7.2% 7.5% 5.8%
Full-time employment 12.3% 15.1% 12.2% 12.9% 15% 15.1% 12.1%
Employment (excl Gov. supported training)
9.7% 10.1% 10.7% 9.9% 12.1% 11.1% 8.7%
Employment - Gov. supported training
2.6% 5% 1.5% 3% 2.9% 4% 3.4%
Employment or training 15% 16.7% 16.1% 14.5% 18.% 17.8% 16.5%
Employment - no training 1.3% 4.2% 1.3% 3% 5% 3.7% 2.9%
Not settled - unemployed 4.4% 4.7% 5.1% 2.3% 5.9% 3.9% 5%
Not settled/Not active 0.6% 0.9% 0.6% 0.9% 0.8% 0.9% 1.3%
As stated, Tables 8 and 9 summarise the year 2000, School Year 11 destination data for Norfolk, each of the counties in the Eastern region and England.
A somewhat lower percentage (69.3%) of this cohort of young people in Norfolk remained in full-time education than in England (70.6%) or elsewhere in the region.
At 3.3% of the total cohort, the proportion of Norfolk's young people who entered Training without employed status was less than the English average (4.4%), but one of the highest in the region (the highest was Essex at 3.9%).
Overall, four out of five Year 11 leavers (82.1%) in Norfolk continued in learning. This was slightly lower than the English average (84.8%) and proportionally the lowest in the region. A higher proportion (15%) of Norfolk's Year 11 students went into full-time employment than the English average. Cambridgeshire and Suffolk experienced similar levels to Norfolk with 15.1% of their Year 11 students entering full-time employment. Around 2.9% of the Norfolk cohort received Government supported training in employment compared to an English average of 3.4%.
Norfolk has the highest proportion (18.3%) of Year 11 leavers in either employment or training (rather than in full-time education), the English average being 16.5%.
The percentage of this cohort of young people in Norfolk who were unemployed at the time of the survey corresponds exactly with the English average and Essex (7.3%). Conversely, the level of unemployment amongst Hertfordshire's Year 11 cohort, the lowest in the region, stood at 3.7%.
Norfolk also had the highest percentage of young people who had moved away from the area (2.9%) and who did not respond to the survey (2.2%).
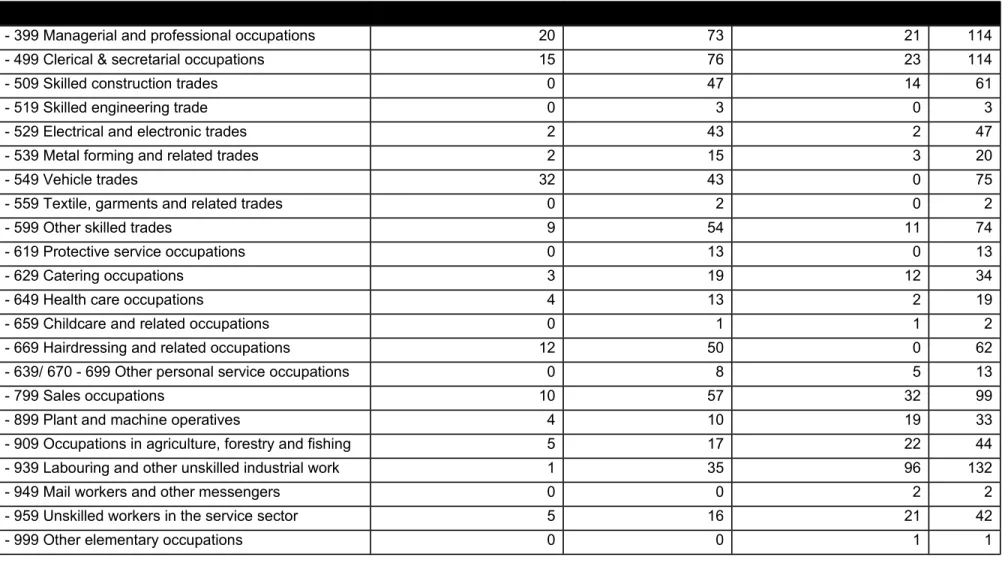
Table 10 shows the significant variation between occupational areas with regards to training provision for Year 11 labour market entrants.
OCCUPATION - SOC MINORGROUPS WORK-BASEDTRAINING EMP. WITHTRAINING EMP. WITHOUTTRAINING TOTAL
100 - 399 Managerial and professional occupations 20 73 21 114
400 - 499 Clerical & secretarial occupations 15 76 23 114
500 - 509 Skilled construction trades 0 47 14 61
510 - 519 Skilled engineering trade 0 3 0 3
520 - 529 Electrical and electronic trades 2 43 2 47
530 - 539 Metal forming and related trades 2 15 3 20
540 - 549 Vehicle trades 32 43 0 75
550 - 559 Textile, garments and related trades 0 2 0 2
560 - 599 Other skilled trades 9 54 11 74
600 - 619 Protective service occupations 0 13 0 13
620 - 629 Catering occupations 3 19 12 34
640 - 649 Health care occupations 4 13 2 19
650 - 659 Childcare and related occupations 0 1 1 2
660 - 669 Hairdressing and related occupations 12 50 0 62
630 - 639/ 670 - 699 Other personal service occupations 0 8 5 13
700 - 799 Sales occupations 10 57 32 99
800 - 899 Plant and machine operatives 4 10 19 33
900 - 909 Occupations in agriculture, forestry and fishing 5 17 22 44 910 - 939 Labouring and other unskilled industrial work 1 35 96 132
940 - 949 Mail workers and other messengers 0 0 2 2
950 - 959 Unskilled workers in the service sector 5 16 21 42
960 - 999 Other elementary occupations 0 0 1 1
Year 11, Labour Market Entrants - 2000
As the Table 7 shows the significant variation between occupational areas with regards to training provision for Year 11 labour market entrants.
All entrants to Vehicle Trades, Skilled Construction Trades, Skilled Engineering Trades, Textile, Garments and Related Trades, Protective Service Occupations, Hairdressing & Related Occupations received formal training.
Three-quarters of those entering Skilled Construction Trades and Metal Forming & Related Trades also received formal training.
Around one-third of those entering Managerial & Professional Occupations, Catering Occupations, Sales Occupations, Clerical & Secretarial Occupations, Sales
Occupations did not receive any formal training.
Roughly one-half of Year 11 labour market entrants to Occupations in Agriculture, Forestry & Fishing, Plant & Machine Operatives and Unskilled Workers in the Service Sector did not receive any formal training.
None of those entering the labour market as Mail Workers & Other Messengers and in Other Elementary Occupations received any formal training.
Destination data one year on - Year 12
Table 11 on the following page gives an indication of what the 1999 Year 11 cohort (who continued in learning) were doing one year on.
The highest retention rate (86% of the original group) is found within the group who began A/AS4 Levels in September 1999. This group made up one-quarter of the
cohort. Around 2% entered Employment with Good Quality Training and a similar proportion entered Employment with no Training. A further 2% became unemployed and 1% moved to GNVQ Advanced Level qualifications.
Almost three-quarters (72%) of those who started on GNVQ Advanced Level5 (21%
of the cohort) programmes continued into September 2000. Around 6% entered
Employment with Good Quality Training and 4% entered Employment with no Training. By September 2000, 3% of the 1999 GNVQ Advanced Level group had become unemployed and 2% joined Modern Apprenticeship programmes.
The third highest retention rate (67%) is found within the group who began NVQ Level 36 qualifications in September 1999, who comprise 3% of the 1999 “in learning”
cohort. One year later, 6% entered Employment with Good Quality Training and 5% entered Employment with no Training. A further 4% were studying at NVQ Level 2 and 4% became unemployed.
Retention rates were lowest (20%) amongst those who embarked upon GNVQ Foundation Level programmes in September 1999 (2% of the 1999 cohort). A further
13% went onto GNVQ Intermediate Level programmes and the same proportion entered Employment with no Training. One-tenth (11%) entered Employment with Good Quality Training and 11% became unemployed.
Low retention rates (23%) also occurred amongst those beginning GCSE courses in 1999, who represent 3% of the cohort. Just under one-tenth (8%) of the GCSE students went onto GNVQ Intermediate programmes, a further 13% entered Employment with Good Quality Training and 16% entered Employment with no Training. By September 2000 approximately 6% of the original GCSE group had become unemployed.
About 11% of the 1999 cohort started GNVQ Intermediate Level qualifications, by September 2000, 27% remained on the programme, while 19% had moved onto GNVQ Advanced Level qualifications. One-sixth (13%) entered Employment with Good Quality Training and a similar proportion entered Employment with no Training. Around 6% became unemployed.
One-twentieth (4%) of the cohort began NVQ Level 1 programmes in September 1999. Twelve months later, one-third (35%) of the original group remained and 10% went onto NVQ Level 2 qualifications. About 12% entered Employment with no Training and 11% were unemployed.
6 Duration of NVQ Level 3 course = 2 years
Duration of GNVQ Foundation Level, GCSE ,GNVQ Intermediate Level and NVQ Level 1 courses = 1
year
Approximately one in six of the 1999 “in learning” cohort embarked upon NVQ Level 27 qualifications and a year later, 52% of the original group continued at this Level.
Around 9% entered Employment with Good Quality Training and 6% entered Employment with no Training. A further 5% went onto GNVQ Advanced Level qualifications and a similar proportion moved onto NVQ Level 3 qualifications. Approximately 5% became unemployed.
In total, by September 2000, 4% of the 1999 “in learning” cohort were unemployed. Around 6% had entered Employment with no Training and a further 6% had entered Employment with Good Quality Training.
Overall, retention rates were highest amongst those groups who began higher level (A/AS Levels, GNVQ Advanced Level and NVQ Level 3) qualifications in 1999. Conversely, retention rates were lowest within the groups who began lower level (GCSE, GNVQ Foundation Level and NVQ Level 1) qualifications. Unfortunately, this was not effected by a movement towards higher level qualifications. These groups were more likely than average to become unemployed or to enter employment with no training.
7 Duration of NVQ Level 2 course = 2 years
Table 11
A/AS LEVELS GCSES GNVQ ADVANCED
GNVQ FOUNDATION
GNVQ INTERMEDIATE
NVQ1 OR
EQUIV
NVQ2 OR
EQUIV
NVQ3 OR
EQUIV
OTHERS TOTAL (NOW)
A/AS Levels 596 9 23 7 3 2 75 715
Emp - Good Quality
Training 15 10 34 6 44 7 35 6 21 178
Emp - No training 11 13 25 7 39 14 23 5 25 162
GCSEs 1 18 1 5 3 1 29
GNVQ Advanced 10 2 433 2 63 2 13 3 22 550
GNVQ Foundation 11 4 2 1 7 25
GNVQ Intermediate 6 2 9 88 5 8 15 133
NVQ1 or equiv 1 1 42 1 9 54
NVQ2 or equiv 5 1 9 2 12 13 215 4 10 271
NVQ3 or equiv 4 1 4 1 2 2 21 64 10 109
Emp - National Traineeship 5 4 5 10 2 10 6 42
Emp - Mod Apprenticeship 5 1 10 3 2 3 17 3 9 53
Others 6 4 15 1 10 3 15 1 265 320
Not available 3 2 3 1 3 2 4 4 22
Unemployed 14 5 17 6 19 13 21 4 17 116
Not Known 5 3 3 6 3 9 2 8 39
Work Based Learning (non emp)
1 2 1 5 5 7 8 29
Moved 14 1 17 3 7 3 4 1 7 57
Participation and Retention Levels (16-18 years)
Participation - Females aged 16-18 years
According to the recent study8 undertaken by RCU Ltd on the behalf of Norfolk Learning
Partnership just over one-half (52%) of females aged between 16-18 years in Norfolk participated in learning/training of some type during 1998/1999.
However, the pattern of participation is highly localised. For example, participation levels were significantly higher (>65%) than the Norfolk average in the following areas:
To the south of Norwich - New Buckenham
To the south-west of Norwich - Wymondham and Hingham
To the north-east of Norwich - Thorpe End, Ranworth, Wroxham and the area from North Walsham up to Mundesley
The area to the west of Dereham
North Norfolk - Sheringham and Brancaster
West Norfolk - Hunstanton, King’s Lynn, Swaffham and the area adjacent to Sutton Bridge
Conversely, participation levels were significantly lower (<40%) than the Norfolk average in the following areas:
Along the West Norfolk/Cambridgeshire border in an area adjacent to Wisbech
On the Suffolk/Norfolk border in an area which takes in Hales, Ellingham, Hempnall and Acle
Most of the coastal area from Horsey to Hopton on Sea, including Gt Yarmouth.
8 based on following datasets: Individual Student Record data relating to FEFC funded provision, Higher
Education Student A relating to HEFC funded provision and data from Norfolk Careers Service, Norfolk and Waveney TEC and the Adult Education Service sorted by postcode.
34
Retention - Females aged 16-18 years
Overall, 80% of females in this age range who took part in learning/training remained on their course. However, retention patterns were highly fragmented and females living in the following areas were more likely (>90%) to remain on their course than the Norfolk average:
North Norfolk - Brancaster, Docking, the coastal stretch between Trimingham and Sheringham
West Norfolk - the area to the west of Southery on the Cambridgeshire/Norfolk border and Swaffham
An area to the south-west of Norwich including Gt Hockham, East Harling, New Buckenham and south Norwich
The area to the east of Norwich between Yelverton and Thorpe End, Catfield
An area to the north-west of Norwich which takes in Cawston, Attlebridge, Saxthorpe, Blickling and Aylsham
Lower retention rates (<60%) were found in the following areas:
The NR7 8 postcode sector in north-east Norwich
The NR24 2 postcode sector in North Norfolk
The IP 25 7 postcode sector to the west of Shipdham
West Norfolk - Wiggenhall
Watton
Participation - Males aged 16-18 years
The same study shows that 50% of males aged between 16-18 years in Norfolk participated in learning/training of some type during 1998/1999.
Again, the pattern of participation is highly localised. For example, participation levels were significantly higher (>65%) than the Norfolk average in the following areas:
To the south-west of Norwich - Wymondham and Hingham
35
To the north-east of Norwich - Wroxham and the area from North Walsham up to Mundesley
South Norfolk - Diss
North Norfolk - Sheringham
West Norfolk - Hunstanton, King’s Lynn, Swaffham and the area adjacent to Sutton Bridge
The area to the west of Dereham
Conversely, young male participation levels were significantly lower (<40%) than the Norfolk average in the following areas:
Along the West Norfolk/Cambridge border in an area adjacent to Wisbech
Downham Market
On the Suffolk/Norfolk border in an area which takes in Scole, Ellingham, Hempnall and Acle
Most of the coastal area from Horsey to Hopton on Sea, including Gt Yarmouth.
Retention - Males aged 16-18 years
Overall, 78% of males in this age range who took part in learning/training remained on their course. As before, retention patterns were highly fragmented and males living in the following areas were more likely (>90%) to remain on their course than the Norfolk average:
North Norfolk - Blakeney
The area to the west of Dereham (NR19 2)
An area to the north-west of Norwich which takes in Blickling and Aylsham
The area surrounding Hales
Lower retention rates (<60%) were found in the following areas:
The NR7 8 postcode sector in north-east Norwich
36
The NR24 2 postcode sector in North Norfolk
The IP 24 1 postcode sector adjacent to Thetford
The PE 36 7 postcode sector to the south of Hunstanton
Hempnall and Ellingham
Participation of 16-18 year olds by Level
Level 1
Participation at Level 1 is particularly low (below 6% of the total 16-18 year population) in the areas surrounding Gt Yarmouth (the coastal strip from Horsey and along the Suffolk/Norfolk border to Bungay), Blakeney, Guist, Downham Market, Fakenham, Diss and Scole. Also in the area to the west of Norwich which includes Dereham and Hingham (postal codes NR9 5, NR20 4, NR19 1, NR17 1 and NR16 1).
The highest level (>25%) of participation at Level 1 is found in the area surrounding North Walsham.
Level 2
Participation at Level 2 is low (below 6% of the total 16-18 year population) in the coastal area from Horsey to Hemsby, Hempnall and the PE14 9 postcode sector on the Cambridgeshire/Suffolk border.
The highest levels (>25%) of participation at Level 2 are found in the areas surrounding King’s Lynn, Hunstanton, Swaffham, Wroxham, North Walsham and the outlying areas of Norwich.
Level 3
Participation at Level 3 is particularly low (below 6% of the total 16-18 year population) in an area which takes in Hempnall and Ellingham along the Cambridgeshire/Suffolk border. The highest levels (>50%) of participation at Level 3 are found in the areas to the south-west of Norwich taking in Wymondham and Hingham, the NR 19 2 postcode sector to the west of Dereham and Hunstanton.
37
38
Section 2 Increasing the Demand for Learning
by Adults
Attracting more people into learning, raising their levels of achievement and providing them both with skills for the workplace and with learning for pleasure.
39
Participation
Participation at Level 3 or less - Females aged 18-64 years
According to the recent study9 undertaken by RCU Ltd on the behalf of Norfolk Learning
Partnership in 1998-1999, females accounted for 61% of total participation in training/learning. Around 7% of female residents in this age group were enrolled on courses at Level 3 or less.
Female participation (at Level 3 or less) is highest (>9%) along the West Norfolk coast, in West Norfolk generally, in the area surrounding North Walsham (taking in Sheringham, Trimingham and Mundesley) and in Norwich.
The lowest levels (<4%) of female participation occur in the Gt Yarmouth area (from Horsey along the coastal strip to Hopton on Sea and along the border to Hempnall) and along the West Norfolk/Cambridgeshire border in an area adjacent to Wisbech
Participation at Level 3 or less - Males aged 18-64 years
Proportionally, male participation in training/learning was far lower than that of females. Just under 6% of male residents in this age group were enrolled on courses at Level 3 or less. Participation (at Level 3 or less) is highest (>9%) along the West Norfolk coast, in West Norfolk generally (not including King’s Lynn), in the NR22 6 and NR 21 9 postcode sectors adjacent to Fakenham and in Norwich.
The lowest levels (<4%) of male participation occur in the Gt Yarmouth area (from Horsey along the coastal strip to Hopton on Sea and along the border to Hempnall and New Buckenham), along the West Norfolk/Cambridgeshire border in an area adjacent to Wisbech, in the area surrounding Cawston and in the Wroxham area
9 based on following datasets: Individual Student Record data relating to FEFC funded provision, Higher
Education Student A relating to HEFC funded provision and data from Norfolk Careers Service, Norfolk and Waveney TEC and the Adult Education Service sorted by postcode.
40
Participation at Level 4 or above - Females aged 18-64 years
Participation at Level 4 or above is highest (>1% of the total female population aged 18-64 years) in the area between Thetford and Diss on the Suffolk/Norfolk border, the NR22 6 postcode sector to the North of Fakenham, Hales, Gt Yarmouth and Norwich.
Participation at Level 4 or above - Males aged 18-64 years
Participation at Level 4 or above is highest (>1% of the total male population aged 18-64 years) in Downham Market, the NR10 5 postcode sector adjacent to Cawston, the NR8 6 postcode sector to the north-west of Norwich and in Gt Yarmouth.
Participation
10of students aged 16-64 years by broad
programme area
Science (including mathematics and computing)
The RCU data indicates that in 1999, around one-sixth (13% actual figure 21,290) of students (aged 16-64 years) were studying science subjects (including mathematics and computing). Take up is higher than average (>3% of the total population aged 16-64 years) around King’s Lynn and North Walsham.
Relatively low levels of participation are seen in Gt Yarmouth, in the central rural areas and along the Suffolk border.
Agriculture
Around 2% of students (actual figure 2,670) were based in agriculture. The highest levels of participation took place in rural North Norfolk. As would be expected, the lowest levels occurred in the urban areas.
Construction
Given the size of the Construction industry in Norfolk, it is perhaps surprising that just 3% (actual figure 3,411) of students were based in this subject. The highest participation rates
10 RCU data as before
41
occurred in Gt Yarmouth and Swaffham.
Engineering
An estimated 7% (actual figure 7,744) of studentsstudied engineering subjects. The highest levels of participation took place in West Norfolk, in the Thetford area and in North Norfolk in an area taking in Bacton, Happisburgh, Sea Palling and Catfield.
Business
One-fifth (21% actual figure 31,066) of Norfolk students participated in business related studies (including administration and management). The level of participation was high generally across Norfolk, with the exception of Gt Yarmouth and a section of the coast from Horsey to Ormesby St Margaret.
Hotels & Catering
Almost one-tenth (8% actual figure 13,199) of students studied Hotel & Catering (including leisure and tourism) subjects. Pockets of high participation occurred in central Norwich and an area in North Norfolk circumscribing Wells.
Health & Community Care
Health & Community Care subjects were studied by 13% (actual figure 15,047) of students aged 16-64 years. Participation levels were generally high across Norfolk with the exception of Ellingham and a small area on the Cambridgeshire/Norfolk border near Wisbech.
Art & Design
About 7% (actual figure 10,820) of students studied Art & Design (including the Performing Arts). Participation was lowest in the central rural areas of Norfolk and in the Gt Yarmouth area. The highest participation rates occurred in North Walsham, Saxthorpe, Blickling and Aylsham.
42
Humanities
Humanities subjects proved to be the most popular subject choice for Norfolk students (aged 16-64 years), accounting for 21% (actual figure 49,241) of all students. Participation rates were high across the County with the exception of the Gt Yarmouth area (from Horsey to Hopton on Sea), Ellingham and a small area on the Cambridgeshire/Norfolk border near Wisbech.
Basic Education
Roughly 4% (actual figure 4,455) of students were involved in Basic Education. Participation was highest along the coastal stretch from Hunstanton to Brancaster, from Sheringham to Sea Palling, Gt Yarmouth, Thorpe End, Swaffham and King’s Lynn.
Training
Barriers to training - For individuals
The most frequently mentioned barrier to training from the individual's point of view is lack of time (especially for the self-employed and people aged 25-44), followed by family
commitments and the cost of training.
However, over two-fifths of adults say that they are not affected by barriers to training, particularly those who have learned or trained in the past 12 months.
As might be expected, some barriers are gender specific:
Relatively more women feel obstructed by family commitments and the cost of or access to, childcare.
Men are more likely to be deterred by lack of time.
Taking part in training/learning
Over one-quarter of adults in Norfolk would not consider learning or training at any location, particularly the unemployed and the economically inactive.
Evidently, many people have traditional ideas when considering places to learn. In view of 43
this, new and non-traditional locations may need extensive promotion, to create awareness and stimulate demand.
In general, the most popular location for learning is a college (FE or HE), followed by the workplace. Almost one-fifth of the adult population would consider learning at home (the third most frequently considered location). This option could present opportunities for distance learning initiatives.
When was training last undertaken?
One-quarter of adults in Norfolk have undertaken some form of learning or training over the last 12 months. However, one-sixth of Norfolk's adult population has not participated in any form of learning or training activity since leaving school.
The latter is more marked amongst particular groups i.e. unemployed claimants, adults who are looking after the home and would not consider working, Lone Parents and adults who are not able to work due to illness or disability.
Type of training undertaken during the past twelve months
The majority of adults who have undertaken training or learning in the past twelve months report that it was job-related.
How would respondents consider training or learning?
The most frequently considered methods are traditional. For example, part-time courses in the evening, part time courses during the day and on the job, at work. However, more than one-quarter of adults would not consider any of these methods (particularly those who are not in work).
Few people would consider learning or training using on-line or other computer-based methods. Therefore, it seems unlikely that new methods of learning delivery will increase participation in the short-term and indeed, it may be difficult to gain widespread acceptance of Learndirect centres.
44
How long could people spend on training/learning?
About one-half of adults report that they can spend specific amounts of time on training or learning.
Women tend to feel they can spend longer on learning than men.
Part-time employees can spend longer on learning than their full-time counterparts.
Self-employed people can devote the least amount of time to learning
People who are not in work are least disposed to spend any time on learning.
Adult guidance
The three most frequently preferred sources ofadvice or information relating to jobs, training or learning areJobcentres (34% of adults), colleges/universities (23%) and the Careers Service/Careers Centres (19%). It would appear that there is no demand for the provision of advice through alternative locations such as pubs, clubs, sports centres or shopping centres .
Jobcentres are the first choice for both employed people and particularly for unemployed people. It is clear that preferences are influenced by employment status.
Just 1% of the population would contact ‘Learndirect’, which is indicative of the magnitude of the task ahead, to generate awareness and acceptance of this organisation.
Recent learning
The Table that follows indicates that certain factors increase the probability of an individual participating in learning during the previous twelve months.
Employed people are more likely to have participated in recent learning than unemployed people (36% against 14%), the self-employed are also less likely than employees to have undertaken recent learning (14%).
A more detailed analysis shows that levels of participation amongst people who are not in paid employment also vary immensely. Around one-third (29%) of unemployed claimants have participated in recent learning compared to 38% of non-claimants who have looked for 45
work during the previous four weeks and 30% of unemployed people who are not actively looking for a job, but would consider working if a suitable job came along have participated in recent learning. The Table below summarises the factors, which increase the probability of an individual participating in learning during the previous twelve months.
Table 12
PROPORTIONSOFADULTSWHOHAVEUNDERTAKENANYKINDOF
TRAININGORLEARNINGDURINGTHEPAST 12 MONTHS
Norfolk average 28%
All employed 36%
All not in work 14%
Full-time employees 39%
Part-time employees 35%
On a government scheme 100%
Self-employed 14%
Claimants 29%
Non-claimants, have looked in last 4 weeks 38% Not claiming or looking, but would consider working 30% Looking after home, would not consider working 13% Unable to work due to illness or disability 8%
Wholly retired 6%
Male 28%
Female 28%
‘Lone parents’ 26%
16-24 years 43%
25-44 years 33%
45+ years 17%
Highest qualification NVQ equivalent Level 5 51% Highest qualification NVQ equivalent Level 4 42% Highest qualification NVQ equivalent Level 3 44% Highest qualification NVQ equivalent Level 2/3 31% Highest qualification NVQ equivalent Level 2 30% Highest qualification NVQ equivalent Level 1 24%
No NVQ equivalence 11%
Higher order occupation 47% Intermediate order occupation 34% Lower order occupation 22% Production & construction 26%
Services 40%
Company size (employees) 1-9 22% Company size (employees) 10-24 34% Company size (employees) 25-199 37% Company size (employees) 200+ 48% source: Norfolk & Waveney TEC Household survey 2000
46
Just 13% of people who do not have paid work because they are looking after the home and would not consider working have undertaken learning in the past twelve months. The proportion of those who are unable to work due to illness or disability is even lower (8%), while only 6% of people who class themselves as wholly retired have participated in recent learning.
However, individuals in the latter three groups who have participated in recent learning are more likely than average to have undertaken learning for their personal interest and development (50% against 22%).
The more highly qualified an individual is, the more likely they are to have undertaken recent learning. One-half (51%) of those qualified to Level 5 have participated in learning during the previous twelve months compared to just one-quarter (24%) of those whose highest qualification is Level 1.
As qualification level is highly correlated with occupation, it is hardly surprising that the probability of an individual employed in a higher order occupation having undertaken recent learning is higher than for an individual employed in intermediate or lower level occupations (34% and 22% respectively).
People employed in the Production and Construction industries are less likely to have participated in recent learning than those employed in the Service industry (26% against 40%). Employer size also appears to be a factor in the propensity to have undertaken recent learning.
While one in five (22%) people employed in small firms (1-9 employees) have participated in recent learning, this rises to almost one in every two (48%) people employed in large firms (200 or more employees). This corroborates the findings of the Employer survey mentioned elsewhere in the document. Large organisations are not only more likely to provide training for staff in the first place, but are also more likely to train each of the occupational groups, including lower level occupations.
Perceived benefits gained from learning
47
Learners appear to be most appreciative of the personal benefits they derive from learning. Around one-half (49%) of Learners report that they “learned new skills” (not related to work). Similarly, 46% of Learners feel that “improved my knowledge” was a benefit they gained from learning.
One in three Learners (36%) say that they enjoyed it and one-quarter of Learners (24%) mention that learning boosted their confidence.
Learners are also appreciative of the job-related benefits they feel have resulted from participating in learning. More than one-third (37%) of recent learners say that the job-related benefit they identified with learning was “new skills for the job I was doing”, this was closely followed by “able to do my job better” (30%). One-sixth (15%) of recent learners report they “got more job satisfaction”, while 6% say that their participation in learning resulted in a pay rise.
Future learning
Certain groups of people are more likely to anticipate taking part in future learning than average (Norfolk average 34%). These include:
young people aged 16-24 years (46%)
people qualified to Level 3 (49%)
people qualified to Level 4 (50%)
people qualified to Level 5 (62%)
full-time employees (44%)
people in higher level occupations (56%)
Service sector workers (44%)
people who have recently participated in learning (69%)
employees in large companies (50%)
48
Although this seems to imply that more people in Norfolk will become involved in learning over the coming twelve months (28% currently against 34% in the future), future expectations may not always come to fruition.
Nevertheless, it is encouraging to note that the percentage of unemployed people who expect to participate in future learning is significantly higher than the percentage who have participated in recent learning (41% against 21%).
Who will pay for future learning/training?
In the main, employers are expected to finance future training, though individual funding will account for a substantial share. Women are significantly more likely than men to expect to pay for their own future learning, possibly as an indirect result of part-time working.
How much current study leads to a qualification?
One-quarter (25%) of all current learning or training will lead to a qualification. Young people (aged 16-24 yrs) who are currently learning, are the group most likely to be working towards a qualification (30%).
The most frequent subjects in which these learners are working towards qualifications are Business Management or Office Studies, ICT, Healthcare/Medicine or Health & Safety.
Previous learning/training which was not completed
About 3% of adults have undertaken training or learning in the past 2-3 years, which they did not complete. People who are relatively more likely to have failed to complete any training or learning include unemployed claimants, Lone Parents and young people.
49
Section 3
Maximising the Contribution of Learning to the Economy
This will mean raising skill levels in the workforce, working with employers, employees, trades unions, the Small Business Service, Chambers of Commerce and other agencies and providers to increase their investment in learning and addressing skills gaps and shortages.
50
Training
Barriers to training - for employers
One-half of all employers (including those who provided no training), believe there are no limiting factors or barriers to the amount of training undertaken and that their present level of training is adequate. This finding is quite startling given the low levels of productivity
experienced in Norfolk (See Key Issues).
For the remainder, the most frequent limiting factors are all linked to the training available locally rather than business issues. This implies that improving the local training
infrastructure (training services, training suppliers, information, advice and guidance) may increase training activity in Norfolk. The following Table summarises employers' perceptions of the limiting factors or barriers to the amount of training they undertake.
Table 13
BARRIERSTOTRAINING % OFEMPLOYERS
No barriers to training 54%
The cost of training 21%
Cannot find the training needed 14% The times of day at which courses are run or provider
prepared to train
13% Lack of information on the training available 13% The quality of the training offered by providers 10%
No budget for training 6%
Concerns over trained employees taking jobs in other companies
4% Unable to quantify the business benefits from training 4% Employees are not interested in training or developing their
skills
3%
Cannot see the benefits 3%
Other 3%
No-one in the company is skilled at identifying employees training needs
2% No-one in company is skilled at buying training 2%
51
source: Norfolk & Waveney TEC Employer Survey
Identifying training needs
In the main, the training needs of individual employees tend to be identified by some form of appraisal or individual discussion between managers and staff.
Other individual training needs are contingent upon external events or demands, such as new equipment/products or legislation. It is also apparent that individual training needs are rarely linked to a central strategic training plan.
Training provision
Employers in Norfolk are slightly less likely than the regional average to provide training, both "on the job" and especially "off the job". In Norfolk, when it is provided, it tends to be given "on the job" suggesting less formal training11, which rarely leads to qualifications. Table
14 summarises training provision by Local Authority District. Table 14
TRAINING FUNDED OR ARRANGED DURING PAST YEAR, BY LAD
TRAINING FUNDED OR ARRANGED DURING PAST YEAR, BY LAD (ALLEMPLOYERS – MULTIPLERESPONSE)
On the job training
Off the job training
No training
Breckland 51% 43% 34%
Broadland 51% 27% 40%
Gt Yarmouth 55% 33% 39%
King's Lynn & West Norfolk
50% 38% 31%
North Norfolk 57% 32% 30%
Norwich 61% 34% 33%
South Norfolk 55% 30% 38%
Norfolk 54% 34% 35%
source: Norfolk and Waveney TEC Employer Survey 1999/2000
11 The way in which the question was phrased means that we have no further knowledge of the training content.
52
The Table shows that:
employers in Norwich are most likely to provide on-the-job training
those in Kings Lynn are least likely to provide on-the-job training
employers in Breckland are most likely to provide off-the-job training;
the proportion of employers who provide no training is highest in Broadland.
Training provision by occupation
As Figure 3 illustrates, in Norfolk the most likely occupations to receive training are Managers or more senior employees. The proportion is roughly twice as high as the next most frequently menti