IJCSMC, Vol. 7, Issue. 6, June 2018, pg.9 – 15
IMPLEMENTATION TO IMPROVE
QUALITY OF COMPRESSED IMAGE
USING UPDATED HUFFMAN ALGORITHM
Ms. Shashi Prabha
1, Mr. Rajiv Sharma
21
M.Tech student, Department of C.S.E, Shri Baba Mastnath Engineering College, Asthal Bohar, Rohtak (Haryana)
2
Assistant Professor, Department of C.S.E, Shri Baba Mastnath Engineering College, Asthal Bohar, Rohtak (Haryana)
Abstract: Image processing is considered as a mechanism to implement any operations on an image or graphics
to extract an enhanced Image/Graphics or to capture information from it. This is considered as a type of signal
processing in which input is an Image/Graphics & output could be Image/Graphics or characteristics/features
associated with that image. An image, digital image, or still Image/Graphics is a binary representation of visual
information such as drawings, pictures, graphs, logos, or individual video frames. Digital images could be saved
electronically on any storage device.
Keywords: Image Processing, Visual Perception, Graphics Transformations.
[1] INTRODUCTION
Uncompressed multimedia data requires considerable storage capacity and transmission bandwidth. Despite rapid
progress in mass-storage density, processor speeds, and digital communication system performance, demand for
data storage capacity and data-transmission bandwidth continues to outstrip the capabilities of available
technologies. The recent growth of data intensive multimedia-based web applications have not only sustained the
need for more efficient ways to encode signals and images but have made compression of such signals central to
storage and communication technology.
To enable Modern High Bandwidth required in wireless data services such as mobile multimedia, email, mobile,
internet access, mobile commerce, mobile data sensing in sensor networks, Home and Medical Monitoring Services
and Mobile Conferencing, there is a growing demand for rich Content Cellular Data Communication, including
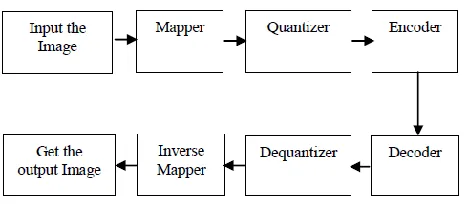
Fig 1 Steps of Image Compression and Decompression
One of the major challenges in enabling mobile multimedia data services will be the need to process and wirelessly
transmit very large volume of this rich content data.
[2] NEED OF COMPRESSION
In the last decade, there has been a lot of technological transformation in the way we communicate. This
transformation includes the ever present, ever growing internet, the explosive development in mobile
communication and ever increasing importance of video communication.
Data Compression is one of the technologies for each of the aspect of this multimedia revolution. Cellular phones
would not be able to provide communication with increasing clarity without data compression. Data compression is
art and science of representing information in compact form.
Despite rapid progress in mass-storage density, processor speeds, and digital communication system performance,
demand for data storage capacity and data-transmission bandwidth continues to outstrip the capabilities of available
technologies. In a distributed environment large image files remain a major bottleneck within systems. Image
Compression is an important component of the solutions available for creating image file sizes of manageable and
transmittable dimensions. Platform portability and performance are important in the selection of the
compression/decompression technique to be employed.
[3] MEASUREMENTS FOR COMPRESSION METHODS
There are a variety of ways in which different compression algorithms can be evaluated and compared. For
quantifying the error between images, two measures are being commonly used. They are Compression Ratio (CR),
Mean Square Error (MSE) and Peak Signal-to-Noise Ratio (PSNR).
Compression Ratio (CR)
CR is the ratio between numbers of bits required to represent original image to the number of bits in the compressed
image and is given below
CR =
Where n1 = number of bits in original image
Peak Signal-to-Noise Ratio (PSNR)
Another error metric used to compare the subjective fidelity criteria of the uncompressed image is PSNR. PSNR is
the quality measure of the compressed image. Since it is a logarithmic measure and our brain seems to respond
logarithmically to intensity values [10]. It can define using MSE as.
[4] IMPLEMENTATION
Here in this paper updated Huffman algorithm to compression an image had been performed. Here jpeg image had
been taken and matlab script had been applied on it.
Fig 2 Original images for compression
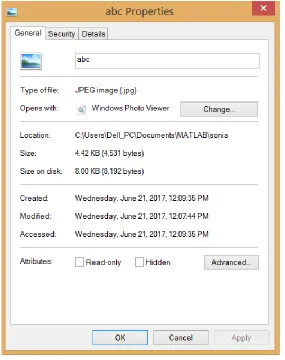
Original File before applying compression algorithm
Fig 3 Size of original File
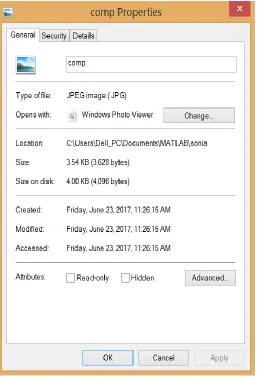
Fig 5 Size of File after applying compression algorithm
Plotting Histogram Of Encoded And Decoded Images
In order to find histogram of images we would apply canny edge detector on encoded and decoded image.
Fig 7 Histogram of decoded image
Result After Checking Psnr Of Compressed Image
Fig 8 Histogram of decoded image
PSNR Calculation Of Decoded Image
retransmission of file. Calculation of Peak Signal to Noise Ratio and Mean Square Root Error confirms performance
of algorithm.
REFERENCES
1. Dudgeon, D.E. & R.M. Mersereau, Multidimensional Digital Signal Processing. 1984, Englewood Cliffs, New
Jersey: Prentice-Hall.
2. Castleman, K.R., Digital Image/graphic Processing. Second ed. 1996, Englewood Cliffs, New Jersey:
3. Oppenheim, A.V., A.S. Willsky, & I.T. Young, Systems & Signals. 1983, Englewood
4. Papoulis, A., Systems & Transforms with Applications in Optics. 1968, New York:
5. Russ, J.C., Image/graphic Processing Handbook. Second ed. 1995, Boca Raton, Florida: CRC
6. Giardina, C.R. & E.R. Dougherty, Morphological Methods in Image/graphic & Signal Processing. 1988,
Englewood Cliffs, New Jersey: Prentice-Hall. 321.
7. Gonzalez, R.C. & R.E. Woods, Digital Image/graphic Processing. 1992, Reading, Massachusetts:
8. Goodman, J.W., Introduction to Fourier Optics. McGraw-Hill Physical & Quantum Electronics Series. 1968, New
York: McGraw-Hill. 287.
9. Heijmans, H.J.A.M., Morphological Image/graphic Operators. Advances in Electronics & Electron Physics. 1994,
Boston: Academic Press.
10. Hunt, R.W.G., Reproduction of Colour in Photography, Printing & Television,. Fourth ed. 1987, Tolworth,
England: Fountain Press.
11. Freeman, H., Boundary encoding & processing, in Picture Processing & Psychopictorics, B.S. Lipkin & A.
Rosenfeld, Editors. 1970, Academic Press: New York. p. 241-266.
12. Stockham, T.G., Image/graphic Processing in Context of a Visual Model. Proc. IEEE, 1972. 60:
13. Murch, G.M., Visual & Auditory Perception. 1973, New York: Bobbs-Merrill Company,
14. Frisby, J.P., Seeing: Illusion, Brain & Mind. 1980, Oxford, England: Oxford University
15. Blakemore C. & F.W.C. Campbell, On existence of neurons in human visual system selectively sensitive to
orientation & size of retinal image/graphics. J. Physiology, 1969.