Multi-loop magnetisation based method for detecting coal
mine wire rope defects
Hongyao Wang 1*, Jie Tian 1*, Sven Bilen2, Xinli Wu 2, Junying Zhou 1, Guoying Meng 1, Gang Hua 3
1School of Mechanical Electronic and Information Engineering, China University of Mining and Technology (Beijing), Beijing 100083, China.
*[email protected] *[email protected]
2 College of Engineering, The Pennsylvania State University, University Park, PA ,16802, USA.
3School of Information and Control Engineering, China University of Mining and Technology, Xuzhou 221116, China.
Abstract: Existing methods for detecting magnetic leakage signals from damaged wire ropes
require axial saturation magnetisation, and the accuracy of the detection equipment depends on the saturation degree of magnetisation. Moreover, the expected magnetisation effect is usually difficult to achieve owing to the special characteristics of the rope structure, diameter, and operating environment of the wire rope. Consequently, in addition to other issues, the detection accuracy and versatility of the equipment are low. In this study, a method based on spatial multidimensional orthogonal array loop magnetisation for detecting mine wire rope defects is proposed. Firstly, a new sensor excitation structure model is developed. Then a method of radiant magnetic flux of permanent magnet array is analysed, and the influence law of the number of permanent radiant magnetic blocks on the magnetisation effect is studied. In addition, a method of wire rope detection based on the principle of clustering is investigated, according to which the influence law of the shape, structure, and size of the polyurethane device on the effect of magnetisation is discussed. Finally, through laboratory experiments, the test model and proposed method are verified. The results show that the magnetisation effect is better and more cost-effective when the number of permanent magnet radiation magnetic block is n=8, and the proposed detection method can effectively distinguish damaged wire rope joints. Furthermore, the proposed equipment achieved signal-to-noise ratio of the signals, improving the reliability of damage detection.
Keywords: mining coal mine; multi-loop magnetisation; array radiation
Introduction
Wire ropes are widely used in coal mine lifting systems because of their high strength, good elasticity, and winding-noise-free characteristics. However, wire ropes are often affected by bending fatigue, wear, mechanical impact, and corrosion from complex conditions and environmental factors, which can lead to breakage, wear, rusting, and other phenomena associated with security risks. At present, under the joint efforts of the China National Emergency Management department and the coal industry, many coal mines have installed safety monitoring, personnel positioning, communication system, etc. Consequently, dynamic disasters of coal mine gas, flood, fire, and surrounding rocks as well as other accidents have been significantly reduced. Accordingly, coal mine safety in China appears to be stabilising and improving. However, transport accidents caused by wire rope breakage have still been occurring in recent years.
In December 2018, seven lives were lost and 3 people injured in a transport accident caused by
the fracture of the skip connection device at the Spring Coal Mine belonging to Chongqing Yuxin Energy Company. In March 2018, a transport accident caused by wire rope fracture at the Jiaxiang Hongqi Coal Mine Co., Ltd., in Shandong province claimed the life of one worker. In June 2017, a wire rope fracture accident occurred at Lu'an group Yuwu Coal Mine in Shanxi province, resulting in the death of one person; In September 2012, 34 men fell underground and 20 died in an accident caused by wire rope fracture at the Baiyin Coal Mine in Gansu province.
Considering the importance of the usage safety of wire ropes, many experts, scholars, and scientific research institutions in China and abroad have long been giving great importance to the research and improvement of a nondestructive testing technology for wire ropes. Thus far, numerous theories, methods, and experimental research have been implemented on the basis of different detection principles and methods. Particularly in aspects of the sensor detection mechanism, excitation mode, electromagnetic damage signal pickup, signal information processing, and quantitative inversion, as well as the development of instruments and equipment, etc., several theoretical and technological achievements have been obtained. In this manner, important contributions have been made towards the progress of wire rope defect detection.
The representative achievements can be summarised as follows. Dr. H.R. Weischedel of NDT(Non-destructive testing), USA, carried out an in-depth study of the detection principles of different types of wire rope detection devices, and performed a quantitative test of the loss of metal cross-sectional area of wire ropes and a qualitative analysis of local damage. On the basis of the online circle, an integral circuit was added to measure the internal magnetic flux of wire ropes [1]. Dr. E. Kalwa from the Canadian Mining Energy Technology Center used hall components to perform several wire rope damage detection tests and determined some quantitative relationships between damage detection signals of wire ropes and the characteristics of local damage [2]. The LMA (loss of metalliccross-sectional area) flaw detection sensor was developed by NDT, USA. It can distinguish flaws with a length of not less than 50 mm [3]. A nondestructive testing instrument produced by the Russian Intros company can realise dual-function computer control of on-line detection of LMA and LF (local fault) broken wires [4]. Scholars at the University of Stuttgart, Germany, designed a sensor probe with 30 hall components arranged in the ring to clearly describe the magnetic field morphology along the axis and circumference of the wire rope [5]. The Polish company Zawada developed a hybrid sensor combining hall element probes and coil sensors; the hall component probe can accurately detect the position and depth of all serious defects, and the coil sensor can distinguish cross-sectional area loss for lengths of up to 30–50 mm [6].
Kim et al. used the multi-channel magnetic leakage sensor probe to scan damage samples and detect magnetic leakage signals. They automatically estimated the severity of damage according to the extracted multi-scale damage index and combined the detection method with the neural network method of multi-stage pattern recognition [7]. Byoungjoon et al. used the magnetic leakage detection method to diagnose elastic pressure deformation of the wire rope and used the Hilbert transform to reduce the noise of signals [8]. Slesarev et al. performed probability estimation of the strength index and residual life of wire ropes on the basis of magnetic nondestructive testing data [9].
conducted extensive research on several aspects of wire rope flaw detection, such as the testing technology theory, methods, and instruments.
Typical achievements made in this regard can be summarised as follows. Yang et al. acquired numerous ground-breaking results on the basis of theoretical research on wire rope electromagnetic detection, and developed the MTC, GDJY, and a series of other wire rope detectors that can realise quantitative identification of broken wires [10-12]. The wire rope flaw detector jointly developed by the Harbin University of Technology and Fushun branch of the China Coal Research Institute can detect both LF and LMA damage [13]. TCK et al. of Luoyang city studied a set of wire rope defects detector based on the magnetic field vector synthesis [14]. They reduced the weight of the equipment, but the equipment required magnetic field induction using a direct current (DC) machine before testing [14]. Tan et al. studied a wire rope detection exciter based on the magnetic bridge principle and a broken wire damage identification model based on support vector machine [15-18]. Gu et al. developed a damage detection method based on the magnetic fluxgate technology [19].
Xu et al. investigated the capture of magnetic leakage information from axial, circumferential and radial three-dimensional surfaces of wire ropes using a Hall sensor array, and designed an adaptive space notch filter to preprocess signals of magnetic leakage [20, 21]. Hua et al. studied and analysed a sensor calibration method based on magnetic leakage detection, the anti-interference design of the system, and the method of signal preprocessing and quantitative identification [22-24]. Through theoretical analysis and transient magnetic field simulation, Yan et al. improved and optimised a coil winding skeleton with an iron core and improved the signal-to-noise ratio of a detector [25].
In summary, experts and scholars from all over the world have extensively investigated the theory, method, and equipment development of wire rope defect detection, providing outstanding contributions to the safety detection and evaluation of wire ropes. However, due to the complex diversity of wire rope structure, damage type, damage form, and damage location, as well as the influence of special working environments on the site, a perfect moulding theory and an effective method of on-line wire rope defect detection have not been established thus far. Furthermore, existing developed instruments and equipment are still only used as a supplement to manual testing.
Although the magnetic detection method is currently recognised as the most practical and reliable detection method, its application to coal mine wire rope detection still involves some shortcomings:
The existing electromagnetic detection methods generally requires the axial uniform saturation magnetisation of the wire rope in order to detect magnetic leakage signals attributable to the damage of the wire rope. This detection method has higher excitation requirements, and the accuracy of equipment detection is related to the saturation uniformity of the wire rope being measured.
Given these issues, the existing theory and method of wire rope defect detection do not meet the needs of practical application in the field. Existing detection equipment used in many coal industry departments have not been effectively promoted in practical application. As a result, current methods are only used as supplementary detection methods for manual testing, and nondestructive defect detection of wire rope, especially mine wire ropes, remain a worldwide problem.
In this context, this paper proposes methods of detecting coal mine wire rope defects based on multi-loop magnetisation.
2 New magnetising structure model of wire rope
The existing theoretical system of magnetic leakage detection is consistent with the view that the detection of defects on the magnetic conductive component is related to the direction of magnetisation [26-28]. It is generally believed that the leakage magnetic field of the defect is difficult to detect when the angle between the magnetisation direction and the defect is less than 20°. A better defect leakage magnetic field can be obtained only if the magnetisation direction is perpendicular to or nearly perpendicular to the angle of the defect.
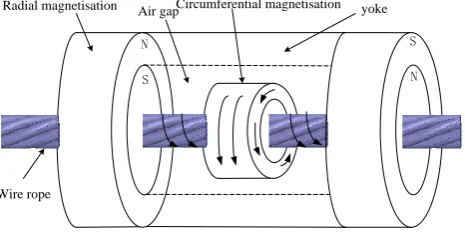
In order to realise the comprehensive detection of defects on wire ropes, a new magnetising structure model is proposed in this paper. As shown in Figure 1, the magnetisation structure model contains two sets of magnetisation loops, with the smaller loop embedded in the larger loop.
Radial magnetisation
Wire rope
Circumferential magnetisation yoke Air gap
N
S
S
N
Figure 1. New magnetising structure model of wire rope
Two circular poles of the larger magnetisation loop are distributed at both ends to form the magnetic field pathway by the cylinder yoke. The smaller magnetisation loop is located in the middle of the device, and the magnetic detection unit is located in the middle of the smaller magnetisation device.
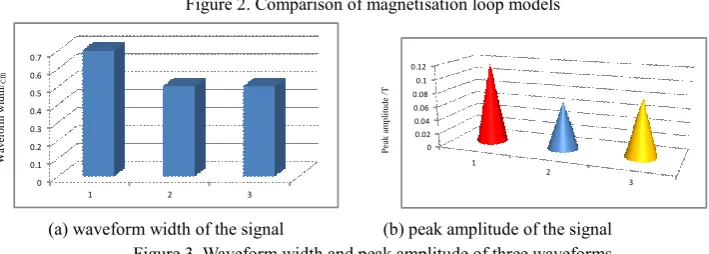
In order to determine the magnetisation mode of each magnetisation loop, the magnetisation directions, double loop, and multi-loop magnetic circuit structure were simulated and compared on the basis of 2D finite element analysis. Figure 2 (a)-(f) shows the simulation results of the radial, axial, multi-loop, and double-loop magnetisation structure and their detection waveforms for the same damage. The waveform width and peak amplitude of three waveforms are shown in Figure 3. In Figure 3, 1,2,3 represent waveforms obtained under the conditions of three different loop structures.
N S
S N
N
N S
S
y /m
By
/T
-0.2 -0.1 0 0.1 0.2 0.04
0.06 0.08 0.1 0.12
-0.2 -0.1 0 0.1 0.2 0.04
0.06 0.08 0.1 0.12
-0.2 -0.1 0 0.1 0.2 0.04
0.06 0.08 0.1 0.12
-0.2 -0.1 0 0.1 0.2 0.04
(a) magnetisation structure of radial and multi-loop (b) radial multi-loop damage signal
(c) axial multi-loop magnetisation (d) axial multi-loop damage signal
N S S N
€ radial bi-circuit magnetisation (f) radial dual loop damage signal Figure 2. Comparison of magnetisation loop models
0 0.1 0.2 0.3 0.4 0.5 0.6 0.7
1 2 3
W a v e fo rm w id th
/cm
0 0.02 0.04 0.06 0.08 0.1 0.12 1 2 3 P ea k a m p li tu d e /T
(a) waveform width of the signal (b) peak amplitude of the signal
Figure 3. Waveform width and peak amplitude of three waveforms
Figures 2 and 3 clearly show that the magnetisation detection effect of the radial multi-loop structure is better than that of other loop structures for the same damage signal. From this viewpoint, the above testing results are equivalent to a vector signal, and then orthogonal to the equivalent detection vector of the circumferential multi-loop structure, as shown in Figure 4 (a)-(c). Figure 4 shows that the orthogonal synthesis effect of the radial and circumferential multi-loop structure is better.
R ad ia l m u lt i-lo o p eq u iv al en t v ec to r Circumferential multi-loop
equivalent vector Circumferential multi-loop equivalent vector
A x ia l m u lt i-lo o p eq u iv al en t v ec to r R ad ia l d u al l o o p eq u iv al en t v ec to r Circumferential multi-loop equivalent vector Ortho gona l synthe
tic
vecto r
Orthogonal sy nthetic
vector Ortho
gona l synthe
tic
vecto r
(a)Radial, circumferential multi-loop
orthogonal
(b)Axial, circumferential multi-loop
orthogonal
(c)Radial dual loop, circumferential
multi-loop orthogonal
Figure 4. Orthogonal synthesis results of equivalent detection vectors
3 Magnetic filling method for permanent magnets
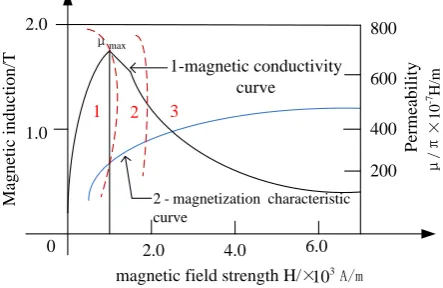
In the multi-dimensional orthogonal magnetisation loop structure, the selection of magnetisation strength is mainly based on the magnetisation characteristic curve of the coal mine wire rope. Figure 5 shows the magnetisation characteristic curve of the coal mine wire rope. As
-0.2 -0.1 0 0.1 0.2 0.04 0.05 0.06 0.07 0.08 0.09
-0.2 -0.1 0 0.1 0.2 0.05
0.055 0.06 0.065 0.07
-0.2 -0.1 0 0.1 0.2 0.04
0.06 0.08 0.1 0.12
-0.2 -0.1 0 0.1 0.2 0.04 0.06 0.08 0.1 0.12 0.14 y /m By / T
y /m
By
/T
-0.2 -0.1 0 0.1 0.2 0.04 0.05 0.06 0.07 0.08 0.09
-0.2 -0.1 0 0.1 0.2 0.05
0.055 0.06 0.065 0.07
-0.2 -0.1 0 0.1 0.2 0.04
0.06 0.08 0.1 0.12
shown in the figure, the magnetisation characteristic curve is divided into 3 zones. Zone 1 has unsaturated and the highest magnetic conductivity in the wire rope; zone 2 has near-saturation and moderate magnetic conductivity; and zone 3 has saturated and lower magnetic conductivity.
For the same damage, the largest changes in the spatial magnetic field are found to occur when the magnetic induction strength is located in zone 2. Therefore, the optimum magnetic induction strength is located in zone 2.
1.0 2.0
2.0 4.0 6.0
0
200 400 600 800
magnetic field strength H/× A/m3
10
M
ag
n
et
ic
i
n
d
u
ct
io
n
/T 1-magnetic conductivity
curve
2 - magnetization characteristic curve
P
er
m
ea
b
il
it
y
μ
/
π
×
1
0
-7H
/m
μmax
1 2 3
Figure 5. Magnetisation characteristic curve of coal mine wire rope
As shown in Figure 6(a), the traditional method of magnetic filling is parallel magnetisation of semi-annular permanent magnets. This type of magnetisation results in some magnetic lines deviating from the excitation circuit and prevents them from reaching the wire rope, thus affecting the strength value of the damage magnetic signal. Figure 6(b) presents a schematic diagram of radiation magnetisation. When the permanent magnet undergoes radiation magnetisation, the annular permanent magnet is divided into several fan-ring modules, each of which is individually magnetised, and then the various magnetic modules are stitched together.
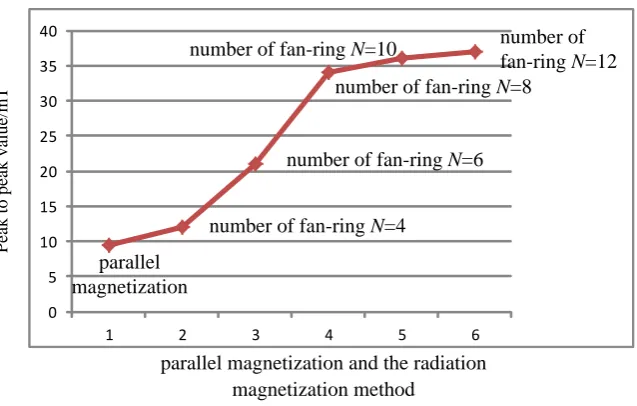
Figure 7 shows the peak-peak value curve of the damage signal obtained by the parallel magnetisation and radiation magnetisation method of different numbers of fan-ring modules, in the case of the same damage. As shown in the figure, when the permanent magnet adopts the traditional parallel magnetisation method, the damage signal of the broken wire becomes weaker.
The amplitude of the damage signal increased obviously with radiation magnetisation. The signals were stitched together for permanent magnet fan-ring modules and used. The more permanent the magnet fan-ring modules (such as N = 4, 6, 8, 10, 12), the stronger the damage magnetic signal. Nevertheless the peak value increase rate of the damage signal decreased at a certain value of N, such as N = 8, 10, 12. Therefore, we set the number of the permanent magnet fan-ring modules to N=8.
N
S
S
N
N
N
S
N
(a) parallel magnetisation (b)Radiant magnetisation
0 5 10 15 20 25 30 35 40
1 2 3 4 5 6
P
ea
k
t
o
p
ea
k
v
al
u
e/
m
T
parallel magnetization and the radiation magnetization method
parallel magnetization
number of fan-ring N=4
number of fan-ring N=6 number of fan-ring N=8
number of fan-ring N=10 number of
fan-ring N=12
Figure 7. Effect of parallel magnetisation and radiation magnetisation
In addition, during the manufacturing process of the fan-ring permanent magnet, clearance occurred between the magnet fan-ring modules due to manufacturing errors and splicing synthesis. Therefore, it is necessary to study and analyse the influence of the clearance of the magnetic fan-ring modules on the magnetisation effect of the wire rope. For this purpose, a series of permanent magnet fan-ring splicing magnetisation models was established, as shown in Figure 8(a). At gaps of 0.1 mm, 0.2 mm, 0.3 mm, 0.4 mm, 0.5 mm, 0.6 mm, 0.7 mm, 0.8 mm, 0.9 mm, and 1.0 mm, the magnetic induction intensity curve in the 300 mm length range at the centre point of the wire rope was studied, and the results were found to be basically coincident, as shown in Figure 8(b). Therefore, the clearance of the permanent magnet after cutting did not exceed 1 mm, and did not affect the magnetisation results of the wire rope.
N S
N N
N N N
N N
S S S S S S
S
Wire rope magnets
(a) permanent magnet cutting (b)magnetic induction intensity curve
Figure 8. Effect of permanent magnet cutting splicing on magnetisation
4 Space magnetic field fusion detection method based on magnetic congregate
and magnetic sensor arrays
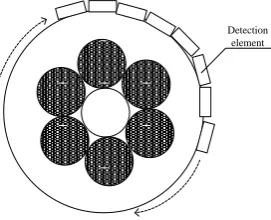
In order to realise comprehensive detection of wire ropes with a large diameter, the electromagnetic method mainly adopted the method of combination detection of a double-row element array arranged along the axial axis. As shown in Figure 9, the number of detection elements that need to be arranged N should at least meet:
2
INT
+1
N
S
=
π
(1)
0.00 50.00 100.00 150.00 200.00 250.00 300.00 Distance [mm]
0.00 0.20 0.40 0.60 0.80 1.00 1.20 1.40
M
ag
_
B
[te
s
la
]
Maxwell3DDesign1
XY Plot 3
Curve Info Mag_B Setup1 : LastAdaptive
distance/mm
M
ag
ne
ti
sa
ti
on
where S represents the curvature of the circumferential coverage of a single detection element, and INT[.] represents a rounding operation.
As the diameter of the wire rope increases, the number of detection elements will increase dramatically. In order to eliminate the influence of leakage magnetic field between rope strands, the installation position and sensitivity of the detection elements need to be carefully set. Because of the weak magnetic field of broken wires, leakage inside the wire rope, and detection of the dispersion of multiple components along the circumference of the wire rope, the detection signal cannot provide sufficient signal-to-noise ratio. Therefore, this paper proposes the use of the clustering detection method for the detection of defects in mine wire ropes.
The principle of clustering detection was realised by a magnetic aggregation device made of high-conductivity magnetic materials, such as industrial pure iron, and soft magnetic alloy. The detection principle is as follows: the magnetic field distributed in space is collected by the magnetometer, and it is directed to the detection path of the magnetic sensor. Then, an average amount of space magnetic field is measured by the component. Here, the magnetometer plays the role of collecting, homogenising, and importing the magnetic field of the measured space.
Detection element
Figure 9. Schematic of a multi-component detection method
For example, when the magnetic sensor is used to detect the distribution of the magnetic field, the component detects an average amount of magnetic field distribution in its inductive range. The effective lengths of the detection elements are a and b respectively, and the inductive potential
H
V
of the detection element is [29]:2 2
2 2
( , )
a b
a b H H CI
V K B x y dxdy
− −
=
(2)
where
K
H―
constantC
I
―
current of access detection elements( , )
B x y
―
magnetic induction strength perpendicular to the plane of theO(0,0) B y z x n a b H V C I
Figure 10. Magnetic detection elements
In the magnetic detection, a magnetic device is added to two sides of the detection element (Figure 11). O V c l c W c
h
V detection element y Z OO
O
'0 y
y
x
S
1detection
element magnetic aggregation device
Figure 11, Schematic of the detection of magnetic flux leakage for broken wires
Assume the size of the magnetic aggregation device is
l
c
W
c
h
c, and the magneticaggregation device is placed on a flat surface of
y
=
y
0. Then the magnetic flux
c between twomagnetic aggregation devices is calculated as follows
[29]
:1
0
( , , )
c y s
s
B x y z d =
1
2 2 2 2
0 0 0
2 2 2 2 2 2 2 2
0 0 0 0
[ ]
3 3
4 (( ) ) (( ) )
2 2
x z s
y z y z y
Q
d d
x l y z x l y z y z
+ + = − − + + + + + +
0 0 0 22 2 2 2 2 2
0 2 0 0
1 1
[ ]
3 3
4 (( ) ) (( ) )
2 2 c c c c w
x t l
w x z
x t l
Qy
d d
x l y z x l y z
+ + + − − − = − − + + + + +
0 0 0 22 2 2 2 2 2
0 2 0 0
1 1
[ ]
3 3
4 (( ) ) 2 (( ) ) 2
c
c
w
x t
w x t x z
Qy
d d
x l y z x l y z
+ + − − − − − + + + + +
(3)
In the formula
(3),
c1 and
c2 are calculated separately as follows:0 0
0 2
1 2 2 2 2 2
0 2 0 0
2 2 2 2 2
0 0
( )
{[
4 ( ) (( ) )
( ) ] } ( ) (( ) )
|
c c c c w w cx t l
x t l
Qy x l
y z x l y z
x l
y z x l y z
0 0
0 2
2 2 2 2 2
0 2 0 0
(
)
{[
4
(
) ((
)
)
|
c
c
w
x lc t
w x lc t
Qy
x
l
dz
y
z
x
l
y
z
+ + + − − −−
=
+
−
+
+
0 0 0 22 2 2 2 2
0 2 0 0
(
)
{[
4
(
) ((
)
)
|
c
c
w
x lc t
w x lc t
Qy
x
l
dz
y
z
x
l
y
z
+ + + − − −+
−
+
−
+
+
0 0 0
2 2 2
0 0
2 2 2
0
4 2 2( )
0
( ) ( 0
2 2
( )
( ) ( 0
2 2 0
c c
c c
Wcy
Q Wc
arctg
y x l
x t l
W W c
x l y
y In
x l W W
x l y
x t l c = + − + + + + − + − − − + + − + − − 0 2 0
2 2 2
0 0
2 2 2
0
2
2 2( )
0 ( ) ( )
2 2 ( )
( ) ( )
2 2 0
c c c c c W y Wc arctg
y x l
x t l
W W c
x l y
y In
x l W W
x l y
x t lc
− + + + + + + + + − + − + + − + − −
(4)
2 c
can be obtained by changing the upper and lower limits of integrals.The above calculation results show that the magnetic aggregation chip has a homogenisation effect, greatly improving the amplitude of the detection signal. When the structure size of the magnetic aggregation chip is selected appropriately, the magnetic flux through the component will be further increased. As the size of
l
c increases, the distribution of the signal along the x-axis widens. Therefore, the magnetic aggregation chip increases the scanning width, and accordingly, the ability to distinguish the space change magnetic field will decrease with increasingl
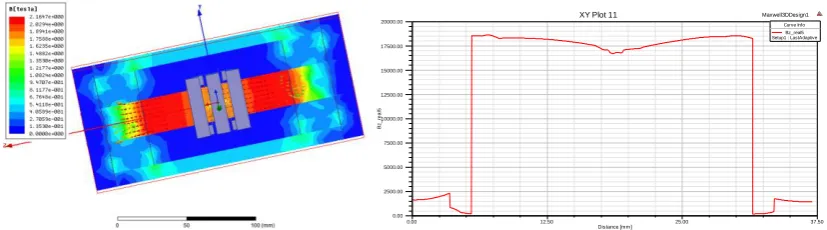
c.2×(100+150) = 500 mT, which is determined using each component after using the magnetic aggregation ring.
The magnetic aggregation ring was reduced by 16%<20%, compared to the magnetic aggregation chip. Furthermore, there is not much difference between the two structure. However, after using the magnetic aggregation chip, the volume of the magnetic aggregation chip increased by 27.4%>25%, compared to the magnetic aggregation ring. The volume, weight, and the cost of the whole magnetisation device were increased due to the large size of the magnetic aggregation chip. In addition, the analysis of the comparison results also show that the magnetisation effect improved with larger induction area of the magnetic device. Accordingly, a magnetic aggregation ring was used to collect the space magnetic field, and the inductive area of the magnetic ring was increased as much as possible.
(a) magnetic field cloud map of the magnetic aggregation chip (b)z-axis component of magnetic induction
strength
(c) magnetic field cloud map of magnetic aggregation ring (d) z-axis component of magnetic induction strength
Figure 12. Comparison of magnetic aggregation ring and chip
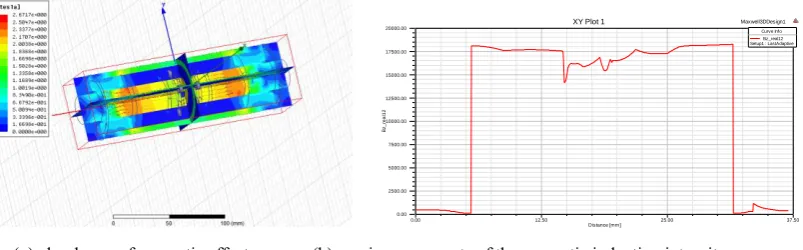
In addition, the amount of magnetic aggregation cylinders and magnetic sensitive detection elements distributed along the circumference of the magnetic aggregation ring that will improve the magnetic aggregation effect and increase the cost performance has not been clarified. For this reason, this study compared and analysed the structure of different numbers of magnetic aggregation cylinders along the circumferential distribution on the poly magnetic ring. Figure 13(a)-(f) show the magnetic effect of three different structural magnetic aggregation rings. In Figure 13(a), 2 magnetic aggregation cylinders and 2 pieces of detection elements are arranged along one circle of the wire rope. The sum of the z-axis component of the magnetic induction
0.00 12.50 25.00 37.50
Distance [mm] 0.00
2500.00 5000.00 7500.00 10000.00 12500.00 15000.00 17500.00 20000.00
Bz
_
re
a
l5
Maxwell3DDesign1
XY Plot 11
Curve Info Bz_real5 Setup1 : LastAdaptive
0.00 12.50 25.00 37.50
Distance [mm] 0.00
2500.00 5000.00 7500.00 10000.00 12500.00 15000.00 17500.00 20000.00
Bz
_
re
al6
Maxwell3DDesign1
XY Plot 12
intensity from two detection elements is Bz1= (50+40) mT = 90 mT. In Figure 13(c), 4 magnetic aggregation cylinders and 4 pieces of detection elements are arranged along one circle of the wire rope, and the sum of the z-axis components of the magnetic induction intensity sensed by the 4 measuring elements is Bz2=2×(50+50) mT = 200 mT. In Figure 13(e), 6 magnetic aggregation cylinders and 6 pieces of detection elements are arranged along one circle of the wire rope, and the sum of the z-axis components of the magnetic induction intensity sensed by the 6 measuring elements is Bz3=3×(50+50) mT = 300 mT. In Figure13(g), 8 magnetic aggregation cylinders and 8 pieces of detection elements are arranged along one circle of the wire rope, and the sum of the z-axis components of the magnetic induction intensity sensed by the 8 measuring elements is Bz4=4×(50+50) mT = 400 mT.Compared with the structure in (a), the z-axis component of the magnetic induction intensity using the (c), (d), and (e) structure increased by 1.22 times, 2.33 times, and 3.44 times, respectively. The structures of (c), (e), and (g) are better than the structure of (a). In Figure 13(g), 8 and 16 pieces of detection elements were required to be arranged along two circles of the wire rope, which increases not only the cost, but also the complexity of the subsequent signal analysis and processing circuit and algorithm. Therefore, the structural model of (c) or (e) was used in this study.
(a) cloud map of magnetic effect (b)z-axis components of the magnetic induction intensity
(c) cloud map of magnetic effect (d) z-axis components of the magnetic induction intensity
(e) cloud map of magnetic effect (f) z-axis components of the magnetic induction intensity
0.00 12.50 25.00 37.50
Distance [mm] 0.00
2500.00 5000.00 7500.00 10000.00 12500.00 15000.00 17500.00 20000.00
Bz
_
re
a
l2
Maxwell3DDesign1
XY Plot 7
Curve Info Bz_real2 Setup1 : LastAdaptive
0.00 12.50 25.00 37.50
Distance [mm] 0.00
2500.00 5000.00 7500.00 10000.00 12500.00 15000.00 17500.00 20000.00
Bz
_
re
a
l1
0
Maxwell3DDesign1
XY Plot 2
Curve Info Bz_real10 Setup1 : LastAdaptive
0.00 12.50 25.00 37.50
Distance [mm] 0.00
2500.00 5000.00 7500.00 10000.00 12500.00 15000.00 17500.00 20000.00
Bz
_
re
a
l1
1
Maxwell3DDesign1
XY Plot 2
(g) cloud map of magnetic effect (h) z-axis components of the magnetic induction intensity
Figure 13.Magnetic aggregation effect of different numbers of magnetic aggregation cylinders and magnetic
sensitive elements
5 Analysis method of magnetic aggregation structure model
The structure design of the magnetic aggregation is important, and the size design of the magnetic aggregation ring is more important. In the above magnetic aggregation structure model, a part of magnetic flux Φ can enter the air gap path on both sides, and another part of magnetic flux Φ can go through the magnetic aggregation cylinders. Therefore, all of Φ do not go through the detection elements. In order to quantitatively analyse the aggregation effect of the magnetic aggregation cylinders, the aggregation efficiency η, which is defined as the ratio of the flux through the detection element with total flux, was used [29].
The scheme in Figure 13(e) was used as an example for the analysis and calculation of the magnetic circuit model. Based on the equivalent reluctance method, the calculation formula of η
was deduced, and the magnetisation aggregation rules were analysed.
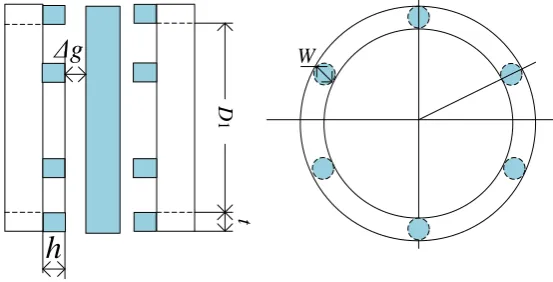
As shown in Figure 14(a), according to the analysis of the magnetic circuit principle, the magnetic flux in the magnetic aggregation ring was divided into 12 paths between the two magnetic aggregation rings. Among them, 6 paths run from the 6 magnetic aggregation cylinders on the left side through the magnetic conductivity ring, the air gap between the magnetic conductivity ring and the magnetic aggregation cylinders, back to the magnetic aggregation ring on the right side. The other 6 paths run from the air gap among the 6 magnetic aggregation cylinders through the magnetic conductivity ring, back to the magnetic aggregation ring on the right side. The equivalent magnetic circuit method was used for the analysis. Assuming that the magnetic resistance of the magnetic aggregation ring is negligible, the equivalent magnetic circuit was obtained (Figure 14(b)). In Figure 14(c), W is the diameter of the magnetic aggregation cylinders, h is the height, and D1 is the inner diameter of the ring. The influence of the magnetic resistance and edge from the magnetic conductivity ring are negligible
The air gap magnetic resistance among the 6 pairs of magnetic aggregation cylinders is calculated as follows:
R1= R2= R3= R4= R5= R6= 0
1
l
S
g
= 01
g
22
2
g
W
π
(5)
where μ0 is the air magnetic conductivity, and
g
is the length of the gas gap between the magnetic aggregation cylinders and the magnetic conductivity ring.The air gap magnetic resistance among the 6 pairs of magnetic aggregation ring and the magnetic conductivity ring is:
0.00 12.50 25.00 37.50
Distance [mm] 0.00
2500.00 5000.00 7500.00 10000.00 12500.00 15000.00 17500.00 20000.00
Bz
_
re
a
l1
2
Maxwell3DDesign1
XY Plot 1
R7= R8= R9= R10= R11= R12= 0
1
g
(
)
'
2
g h
+
S
(6)
where '
S
is the opposite cross-sectional area between the magnetic aggregation ring exceptthe area of the magnetic aggregation cylinders. '
S
is calculated as follows:
2 2 2
' 1 1 2 1 6
6 2 2 2
D t D W
S = + − −
gπ π π (7)
where t is the thickness of the magnetic aggregation ring.
F
Ф
R1-R6 R7-R12
(a)structure of the magnetic aggregation ring (b) equivalent magnetic circuit
h
W
Δg
D
1
t
(c) front view of the magnetic aggregation device (d) side view of the magnetic aggregation device Figure 14. Analysis model of the magnetic resistance method
Therefore, the calculation formula of the ratio η between the magnetic flux Φ1 through the detection elements and the total magnetic flux is:
(
)
(
)
'
7 0
1 1
7 1
2 '
1 7 0 0
2
+
1
6
=
=
=
6
6
+
1
2
+
1
2
+
2
g h
R
S
R
g h
R
R
g
R
R
S
W
=
+
g
g
g
π
(8)
(
)
' 2 2 2 2
1
1 1
2
2
2
1 1 1
=
2 2
1
1+ 6 1
+ 6 2 2 2 3
1 1
2 1
1 2
g S D t D W t D t
g h
W W
h
W h
g g
= =
+ − − + −
+
+
+
+
g g
g
π
(9)
Let α=
(
)
2 1
2
2
1
3
t
D t
W
+
−
,β=1+h
g
, then1
=
1+
(10)
According to formula (10), the following measures can be taken to improve η:
(1) To reduce α, W of the magnetic aggregation cylinders can be increased or t of the magnetic aggregation ring can be decreased under certain conditions of D1. However, if the thickness of the magnetic aggregation ring is too small, the magnetic field through the magnet aggregation ring will become saturated. Therefore, the thickness of the magnetic aggregation ring should not be too small. Under the requirement that W of the magnetic aggregation cylinders should not be greater than the inductive surface width of the detection element, the magnetic efficiency can be improved by increasing the inductive surface width of the detection element. Therefore, components with a wide inductive surface should be selected when using the magnetic sensitivity detection element.
(2) Adding β, it can be achieved by increasing the length of the magnetic aggregation cylinders or by reducing the axial gap distance
g
between the magnetic aggregation cylinders and the magnetic conductive ring. Therefore, when the spacing gap distance of the two magnetic aggregation rings is certain, the width of the magnetic conductive ring or the length h of the magnetic aggregation cylinders can be increased, which will reduce the gap distance between the magnetic aggregation cylinders and the magnetic conductive ring. In practical applications, the objectives of increasing β and improving η can be achieved by using thinner detection elements.In addition, the calculation of the magnetisation efficiency also shows that the magnetisation aggregation effect can be improved by increasing the number of magnetic aggregation cylinders, which is consistent with the simulation results of Figure 13.
6 Analysis and discussion of experimental results
In order to further verify the effectiveness of the sensor model and proposed method, the proposed method was applied to the sensor model design, as shown in Figure 15(a). In order to ensure that the coal mine-hoist wire rope can achieve the expected magnetisation effect, a rare earth permanent magnet material of grade N35 was selected for the excitation device. The magnetic characteristic parameters of the material are shown in Table 1. Figure 15(b) presents the creation of a permanent magnet magnetisation simulation model. Fig. 15(c) and Fig.15 (d) are the PCB circuit boards of the developed magnetic device.
show the front and rear of the brass sleeve, respectively. The magnetic aggregation device was installed in the two middle slots.A magnetic sensor signal pickup PCB board was installed in the middle of the non-penetrating slots. The sensing element was symmetrically installed, and the combination operation weakened the jamming signal of the rope, which is beneficial for the subsequent signal processing. The upper and lower section structure was adopted for the copper sleeve. The wire rope passes through the middle of the copper sleeve, and the concave and convex structure design facilitates the opening and closing of the instrument.
Table 1. Magnetic properties of material NdFeB N35
Grade
Br Hcj Hcb (BH)max D Tc Tw
(L/D≥0.7) μrec
Gs m T Oe
KA/
m Oe KA/m MGOe KJ/m
3 g/cm3 °C °C ----
N35 1180 0
11
80 1200
0 955 10800 860 33–37 263–
295 7.45 310 80 1.05
(a) sensor model (b)permanent magnet magnetisation simulation model
(c) PCB circuit board 1 (d) PCB circuit board 2 Figure 15. Sensor model design
(a) Front of copper sleeve (b) rear of copper sleeve Figure 16 the structure of the copper sleeve
a flaw detector, and Figure 17(b) shows a host computer and a signal collector for data acquisition and analysis processing. In order to test the performance of the new sensor, three local faults were generated on a wire rope, as shown in Figure 18(a). According to Fig.18(b), the three local fault signals could be detected. The signal-to-noise ratio was found to be 28 dB > 25 dB, which suggests sufficient detection performance.
(a) flaw detector (b) host computer and a signal collector Figure 17. Prototype of the wire rope detection equipment
1 2 3 Sampling distance/×0.05mm
V
o
lt
ag
e/
V
0 200 400 600 800 1000 1200
-0.06 -0.04 -0.02 0 0.02 0.04 0.06
(a) wire rope (b) detection signal
Figure 18. Detection results
7 Conclusions
(1) Damage detection of wire ropes, especially mine wire ropes, is still a worldwide problem. Considering the shortcomings of existing wire rope detection equipment, a new type of wire rope damage multi-component array fusion detection method based on multidimensional space multi-loop orthogonal array excitation was proposed in this paper.
(2) The magnetisation structure model of a new type of wire rope flaw detection sensor was established, and the excitation effect of the radial, axial, and circumferential direction of the wire rope was compared and analysed.
(3) The radiation-magnetic filling method of a permanent magnet array block was studied, on the basis of which the influence law of the number of radiation blocks on the magnetisation effect as well as the number of array blocks suitable for the radiation magnetisation of mine wire ropes were determined.
(4) The damage detection method based on the principle of magnetic aggregation was studied, on the basis of which the influence of the shape, structure and size of the magnetic aggregation device on the detection effect was compared and analysed.
(5) The method proposed in this paper was verified experimentally, and the results show that the signal collected based on the new sensor can effectively locate and distinguish damages in wire ropes.
Data availability statement
The detection signal *.xls data used to support the findings of this study were supplied by HONGYAO WANG under license and so cannot be made freely available. Requests for access to these data should be made to HONGYAO WANG,[email protected].
Acknowledgments
51774293), the Yue Qi Young Scholar Project, the Yue Qi Distinguished Scholar Project from China University of Mining & Technology, Beijing, and The Central Business Funds of Colleges (Grant nos. 2014QJ01 and 2015QJ04) for providing the financial support for conducting this research. The authors would like to thank Professors Gang Hua, Zhao Xu, Hongsheng Yin, and Yonggang Xu, and postgraduate students Zhou Juning, Zhu Pufan, Li Xiaowei, Lvxin, and others, for their help during the study. The authors also thank the reviewers for their useful comments and suggestions, which have helped us to improve the manuscript.
Reference
[1]L.L. Liu. Study on the characteristics of steel wire rope fatigue damage detection based on magnetic parameters[D].Qingdao:Qingdao University of Technological,2016.
[2] W. S. Singh, B. P. C. Rao, S. Thirunavukkarasu, Flexible GMR Sensor Array for Magnetic
Flux Leakage Testing of Steel Track Ropes[J], Journal of Sensors,
2012,2012 (1687-725X):276-283.
[3]The University of Reading. Wire Rope Non-Destructive Testing—Survey of Instrument Manufacturers[R]. The Health and Safety Executive,Offshore Technology Report, OTO 2000-064.
[4]D.Slesarev, D. Sukhorukov, I.Shpakov, C.Bonetti. Concept and experience of wire rope condition monitoring[C], 1st World Congress on Condition Monitoring 2017, June 13-16, London, United kingdom, 2017.
[5] S. Winter, U. Briem, J. M. Nussbaum. High Resolution Magnetic Wire Rope Test-case Study[C]. OIPEEC Technical meeting“The nondestructive testing of rope”, Krakow, September, 1999: 143-151.
[6] Y.N. Cao,D.L.Zhang,D.G. Xu.Present Research Status of Quantitative Non-destructive Testing of Wire Rope[J].Nondestructive Testing.2005(02):91-95,106.
[7] Ju-Won. Kim, Seunghee. Park. Magnetic Flux Leakage Sensing and Artificial Neural Network Pattern Recognition-Based Automated Damage Detection and Quantification for Wire Rope Non-Destructive Evaluation[J]. Sensors, 2018, 18(1):109-128.
[8]Y. Byoungjoon, J.W. KIM, P. Senughee. Magnetic-Flux-Leakage-Based Pressure Deformation Detection of Elevator Wire Rope[J]. Journal of the Korean Society for Nondestructive Testing, 2017, 37(4):269-275.
[9]D.A.Slesarev, A.N.Vorontsov. The probabilistic characteristics of estimation of the residual strength and operation lifetime of steel wire rope based on the results of non-destructive testing [J]. Russian Journal of Nondestructive Testing, 2016, 52(2): 95-101.
[10]Y.H.Kang,K.C.Yang,S.Z.Yang, etc.Detection method of magnetic leakage Hall effect of broken wire based on the structure characteristics of wire rope[J].Journal of Huazhong University of Science and Technology,1992,(S1):188-194.
[11]Y.H. Kang, K.C.Yang, H.J. Xie, et al. Model-based quantitative inspection for broken wires in wire ropes[C]. In: the 2th international conference on measurement and intelligent instrument, Wuhan, China, Aug.1993.
[13] B. Wu.Study on damage mechanism and electromagnetic sensor detection technology of
wire rope [D].Jinan:Jinan University,2016.
[14] TCK wire rope detection
technology.http://www.wmndt.com/index.php/Products/index/pid/bx.html,2018.3
[15]J.W. Tan.Principle and technology of safety inspection of wire rope [M].Beijing:Science
Press,2009.
[16]J.Z. Feng,J. Wang,J.W. Tan.Study on LMA detection of steel ropes based on magnetic bridge[J].Journal of Qingdao Technological University,2012,33(5):73-77.
[17]Z. Wang,J.W. Tan,X,Q. Hu.Strength detection method of wire rope [J].Safety in Coal Mines,
2007,38(1):32-34.
[18]W.X. Zhan. Study on signal processing and quantitative identification method of wire rope broken wire damage [D].Qingdao:Qingdao University of Technology,2013.
[19]Gu Wei, Chu Jianxin. A transducer made up of fluxgate sensors for testing wire rope defects[J]. IEEE Transaction on Instrumentation and Measurement, 2002, 51(1):120-124.
[20]D.L.Zhang, Y.N.Cao, C.Wang and D.G.Xu. A new method of defects identification for wire rope based on three-dimensional magnetic flux leakage [J]. Journal of Physics: Conference Series, 2006, (48):334-338.
[21]Y.N. Cao,D.L. Zhang,D.G. Xu.Study on Algorithms of Wire rope Localized Flaw Quantitative Analysis Based on Three-Dimensional Magnetic Flux Leakage [J].ACTA ELECTRONICA SINICA,2007,35(6):1170-1173.
[22]C. Wang,G.Hua.Research on Damage Detecting of Mine Steel Cable with Wavelet Denoising
[J].Coal Engineering,2014,46(12):105-107.
[23]Y.H. Lu,G. Hua,F.J. Chen,J.J. Zhang.Study on quantitative detection technology of wire
rope broken wire based on least squares method [J].Mining & Processing Equipment,2010,
38(1):55-59.
[24]Q. Du,G. Hua,C. Jiang,J.J. Zhang.Design of software for damage detection system of mine
wire rope[J].Safety in Coal Mines,2011,42(9):85-87,94.
92:221-227.
[26] LEON H I, ALVIN B . Apparatus for detecting longitudinal and transverse
imperfections in elongated ferrous work pieces:USA, 4218651 [P]. 1980-08-19.
[27] RANDEL B. Apparatus and method for detection of defects using flux
leakage techniques:USA, 11411235 [P]. 2006-04-26.
[28] UETAKE I, NAGAI K. Magnetic flux leakage testing method using rotating
field for detection of all-directional surface flaw [J]. Journal of JSNDI, 2003, 52:246-253.
[29] YANG Shuzi, KANG Yihua. The principle and technology of qualitative test of