c
Owned by the authors, published by EDP Sciences, 2010
How Greenland melts
M.R. van den Broeke
Institute for Marine and Atmospheric research, Utrecht University, PO Box 8005, 3508 TA Utrecht, The Netherlands
Abstract. Satellite altimetry and gravimetry show that the Greenland ice sheet has been losing volume and mass since the beginning of this century. However, from these short time series of direct measurements we cannot infer what the causes of the mass loss are, i.e. ice dynamics or surface processes, or that maybe the ice sheet returns to normal after a period of volume increase and mass gain. By modelling and observing the individual components of the ice sheet mass balance, i.e. snowfall, meltwater runoffand iceberg production, we are able to identify the processes that led to the recent mass loss. We conclude that the Greenland ice sheet is significantly out of balance. Acceleration of outlet glaciers and increased runoffhave contributed equally to recent Greenland mass loss. The potential for mass loss by surface processes, however, was three times greater than actually observed, due to refreezing and enhanced snowfall.
1 Introduction
Satellite measurements from the Gravity Recovery And Climate Experiment (GRACE) mission have revolutionized Greenland mass balance research by proving beyond a doubt that the Greenland ice sheet (GrIS) loses mass, and contributes significantly to ongoing sea level rise (SLR) [1, 2]. In Green-land, GRACE data show that the mass loss is concentrated along the ice sheet margins and is progress-ing towards the northwest [3]. The mass loss is caused by outlet glacier acceleration [4–6] as well as enhanced runofffrom the widening ablation zone, following recent atmospheric warming over the ice sheet [7].
Unfortunately, direct observations of mass changes from GRACE do not discriminate between mass losses caused by ice dynamics or surface processes. Can satellite altimetry help? Accurate, high-resolution (in the along-track direction) laser altimetry observations from ICESat show that pro-nounced thinning in the order of one or more metres per year occurs on the fast flowing parts of nearly all the marine-terminating outlet glaciers in Greenland [8]. This suggests that ice dynamics are respon-sible for an important part of the mass losses, and that warming ocean waters are, at least partly, driving these changes [9]. Superimposed are smaller yet widespread elevation changes over much larger areas [10, 11], caused by temporal variability in snow accumulation and firn densification [12]. Although smaller than the rapid thinning of glaciers, these widespread signals are often very significant for total ice sheet mass balance because of the much larger area they represent.
To convert volume changes, as measured by satellite altimetry, to mass changes requires knowl-edge of the density at which the elevation change takes place. If a glacier is thinning far below the surface, the change is of ice-dynamical nature (faster ice deformation or enhanced sliding) and the density at which the volume loss occurs is that of ice (∼900 kg m−3). If elevation changes occur in the firn layer that covers the glacier, for instance owing to changes in the firn densification rate or
This is an Open Access article distributed under the terms of the Creative Commons Attribution-Noncommercial License 3.0, which permits unrestricted use, distribution, and reproduction in any noncommercial medium, provided the original work is properly cited.
accumulation variability, the density at which the volume loss occurs can be anything between typical values for surface snow (∼300 kg m−3) and that of ice. The density problem represents one of the major uncertainties in altimetry, another one being the unknown penetration depth of radar altimeters in firn [13].
2 The mass budget method
Ice sheet mass balance (MB) is defined as the change of ice sheet mass in time (dM/dt, Gt yr−1). If we neglect basal melting of grounded ice and assume that migration of the grounding line is accounted for, MB is governed by the difference between surface mass balance (SMB) and ice discharge across the grounding line (D):
MB=dM/dt=SMB−D (1)
In turn, the surface mass balance (SMB, Gt yr−1) sums all mass fluxes towards and away from the ice sheet surface, i.e. accumulation by precipitation (snow and rain), and ablation by runoffand sublima-tion (including snowdrift sublimasublima-tion but neglecting snowdrift erosion/deposition, which is thought to be small when integrated over the ice sheet):
SMB=Snow+Rain−Sublimation−Runoff (2)
Finally, runoffis determined by the liquid water balance (LWB, Gt yr−1), which sums all sources (water vapour condensation, rainfall and melt) and sinks (refreezing and capillary retention) of liquid water:
Runoff =Condensation+Rain+Melt−Re f reezing−Retention (3)
The only way to separate the role of surface and ice dynamical processes in the mass loss of the GrIS is to quantify the individual components of MB, SMB and LWB: the mass budget method. The mass budget method is elaborate, as it relies on separately quantifying all surface mass fluxes as well as iceberg production, both of which are prone to uncertainties.
3 Application to the GrIS
Solid ice discharge is quantified from ice flow velocity and the thickness of outlet glaciers. Ice flow velocity can be accurately determined using speckle tracking from satellite radar interferometry [14, 15]. Combined with ice thickness observations [16], the flux of solid ice can be determined within ∼10% accuracy. Surface mass balance (SMB) can be quantified in two different ways: by interpola-tion of in situ SMB observainterpola-tions [17, 18] or from regional climate models [19, 20]. Figure 1 shows an example of a modelled SMB field for the GrIS, combined with∼500 in situ SMB observations and averaged for the period 1958–2008 [20]. The correlation between modelled and observed SMB is very high, especially if only observations are selected that cover a period that overlap with the model period (N=265,r=0.95).
Note that large spatial contrasts exist: coastal southeast Greenland shows accumulation rates in excess of 3000 kg m−2yr−1, while northeast Greenland receives less than 100 kg m−2, yr−1. Due to summertime melt and runoff, the GrIS has a well-defined marginal ablation zone. The ablation zone is more then 100 km wide in the southwest, where ablation in excess of 3000 kg m−2yr−1occurs. Because observations are sparse in high-accumulation/high ablation areas, compilations that rely purely on interpolation of available observations tend to under/overestimate SMB in these regions.
Fig. 1. Modelled and observed SMB (circles, same colour scale), in kg m−2year−1. From [20].
the ice sheet could be out of balance (red line in Fig. 2). Because M0is not known, neither of these scenarios can be rejected based on the short GRACE time series. This also means that it is allowed to vertically shift GRACE mass time series, e.g. for visual clarity when comparing it to other methods (see Fig. 3).
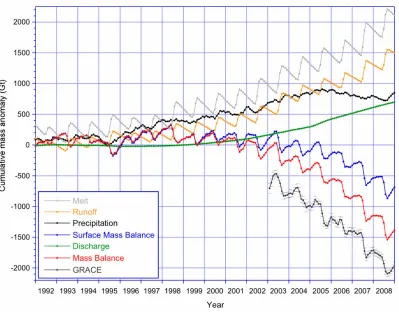
Following recent work [15, 21] we use 1961–1990 as a reference period during which we assume that the GrIS was in approximate balance. Using monthly GrIS SMB components from [20] we obtain a reference SMB of 480 Gt yr−1, considerably more than values used in previous studies (∼300 Gt yr−1) but confirmed by recent estimates of total GrIS discharge [15]. Using furthermore annual estimates of D from [22], a time series of SMB-D anomalies can be constructed. Because no discharge data are available before 1992, we focus on the period 1992–2008 (Fig. 3). The mass anomaly due to discharge (green line) is smooth, because we only have a single data point each year for the years 1992, 1996, 2000, 2004, 2005, 2006, 2007 and 2008, linearly interpolating for missing years and assuming changes in D to be slow.
Fig. 2. Schematic GRACE mass curves for scenarios in which the ice sheet is in (long-term) balance (green line),
and out of balance (red line).
Fig. 3. Cumulative mass anomalies (Gt) of major LWB, SMB and MB components, relative to 1961–1990,
adjusted from [21]. GRACE data for 2003–2008 are from [2].
Figure 3 shows cumulative anomalies of melt, runoffand precipitation. A positive melt anomaly starts to develop in the early 1990s, significantly earlier than the negative SMB anomaly. The reason for this delay is twofold: first, the melt increase occurs primarily higher on the GrIS, and most melt-water refreezes in the cold snowpack. Secondly, when the cumulative runoffanomaly finally starts to increase in the mid-to-late 1990s, the precipitation increased simultaneously, keeping the SMB anom-aly around zero. Only when the precipitation anomanom-aly levels offafter 2004, does the SMB anomaly quickly become negative. Without these moderating effects of refreezing and precipitation, the 1992– 2008 cumulative SMB anomaly would have been similar to the melt anomaly, i.e.∼2100 Gt, triple the value that actually occurred and also triple the mass anomaly due to glacier acceleration. Together with the discharge anomaly, this would have led to a 1992–2008 cumulative mass loss for the GrIS of 2800 Gt, double the value that actually occurred.
4 Conclusions
The mass balance of the Greenland ice sheet (GrIS) can be quantified at sub-annual resolution using regional climate modelling for surface processes and satellite interferometry for solid ice discharge. Direct gravity measurements from the GRACE mission are used to validate/calibrate the results. No such calibration was necessary here. During the period 1992–2008, the acceleration of marine termi-nating outlet glaciers has led to a cumulative mass loss of 700 Gt. Melting started to increase in the early 1990s, but owing to enhanced refreezing and simultaneously increasing precipitation, surface mass losses were delayed. Only when precipitation returned to normal in 2004 did surface mass losses become evident. Without the moderating effects of refreezing and above-normal precipitation, the total GrIS mass loss since 1992 would have been twice the amount that actually occurred. Given that the surface melt anomalies started before glacier acceleration, there might be a connection between the two. Finally, based on the trajectory of the mass balance curve in Fig. 3 (red line), we conclude that the curve in Fig. 2 in which the GrIS is significantly out of balance represents the most likely scenario of recent Greenland mass loss.
References
1. B. Wouters, D. Chambers, E.J.O. Schrama, GRACE observes small-scale mass loss in Greenland, Geophys. Res. Lett. 35, L20501, doi:10.1029/2008GL034816 (2008)
2. I. Velicogna, Increasing rates of ice mass loss from the Greenland and Antarctic ice sheets revealed by GRACE, Geophys. Res. Lett. 36, L19503, doi:10.1029/2009GL040222 (2009)
3. S. A. Khan, J. Wahr, M. Bevis, I. Velicogna, E. Kendrick , 2010, Spread of ice mass loss into northwest Greenland observed by GRACE and GPS, Geophys. Res. Lett. 37, L06501, doi:10.1029/ 2010GL042460 (2010)
4. I. Joughin, I.W. Abdalati, M. Fahnestock, Large fluctuations in speed on Greenland’s Jakobshavn Isbrae glacier, Nature 432, 608–610 (2004)
5. I.M. Howat, I. Joughin, S. Tulaczyk, S. Gogineni, Rapid retreat and acceleration of Helheim Glacier, east Greenland, Geophys. Res. Lett. 32, L22502, doi:10.1029/2005GL024737 (2005) 6. I.M. Howat, I. Joughin, T. Scambos, Rapid changes in ice discharge from Greenland outlet
glaciers, Science 315, DOI: 10.1126/science.1138478, 1559 (2007)
7. E.Hanna, P. Huybrechts, K. Steffen, J. Cappelen, R. Huff, C. Shuman, T. Irvine-Fynn, S. Wise, M. Griffiths, ncreased Runofffrom Melt from the Greenland Ice Sheet: A Response to Global Warming, J. Climate 21, 331–341 (2008)
8. H.D. Pritchard, R.J. Arthern, D.G. Vaughan, L.A. Edwards, Extensive dynamic thinning on the margins of the Greenland and Antarctic ice sheets, Nature 461, 971–975 (2009)
9. D.M. Holland, R.H. Thomas, B. de Young, M.H. Ribergaard, B. Lyberth, Acceleration of Jakob-shavn Isbræ triggered by warm subsurface ocean waters, Nature Geosc. 1, 659–664 (2008) 10. H.J. Zwally, M.B. Giovinetto, J. Li, H.G. Cornejo, M.A. Beckley, A.C. Brenner, J.L. Saba, D. Yi,
11. D.C. Slobbe, P. Ditmar, R.C. Lindenbergh, Estimating the rates of mass change, ice volume change and snow volume change in Greenland from ICESat and GRACE data, Geophys. J. Int. 176, 95–106 (2009)
12. J.R. McConnell, R.J. Arthern, E. Mosley-Thompson, C.H. Davis, R.C. Bales, R. Thomas, J.F. Burkhart, J.D. Kyne, Changes in Greenland ice sheet elevation attributed primarily to snow accu-mulation variability, Nature 406, 877–879 (2000)
13. R. Thomas, C. Davis, E. Frederick, W. Krabill, Y. Li, S. Manizade, C. Martin, A comparison of GrIS volume changes derived from altimetry measurements, J. Glaciol. 54, 203–212 (2008) 14. E. Rignot, P. Kanagaratnam, Changes in the velocity structure of the Greenland ice sheet, Science
311, 986–990 (2006)
15. E.Rignot, J.E. Box, E. Burgess, E. Hanna, 2008, Mass balance of the Greenland ice sheet from 1958 to 2007, Geophys. Res. Lett. 35, L20502, doi:10.1029/2008GL035417
16. J.L. Bamber, S. Ekholm, W.B. Krabill, A new, high-resolution digital elevation model of Green-land fully validated with airborne altimeter data, J. Geophys. Res. 106, 6733–6745 (2001) 17. R.C. Bales, Q. Guo, D. Shen, J.R. McConnell, G. Du, J.F. Burkhart, V.B. Spikes, E. Hanna,
J. Cappelen, Annual accumulation for Greenland updated using ice core data developed during 2000–2006 and analysis of daily coastal meteorological data, J. Geophys. Res. 114, D06116, doi:10.1029/2008JD011208 (2009)
18. E.W. Burgess, R.R. Forster, J.E. Box, L.C. Smith, D.H. Bromwich, Greenland ice sheet annually-resolved accumulation rates (1958–2007), a spatially calibrated model, J. Geophys. Res. 115, F02004, doi:10.1029/2009JF001293 (2010)
19. X. Fettweis, Reconstruction of the 1979–2006 Greenland ice sheet surface mass balance using the regional climate model MAR, The Cryosphere 1, 21–40 (2007)
20. J. Ettema, M.R. van den Broeke, E. van Meijgaard, W.J. van de Berg, J.L. Bamber, J.E. Box, R.C. Bales, Higher surface mass balance of the Greenland ice sheet revealed by high-resolution climate modeling, Geophys. Res. Lett. 36, L12501, doi:10.1029/2009GL038110 (2009)
21. M.R. van den Broeke, J. Bamber, J. Ettema, E. Rignot, E. Schrama, W.J. van de Berg, E. van Meijgaard, I. Velicogna, B. Wouters, Partitioning recent Greenland mass loss, Science 326, 984–986 (2009)
![Fig. 1. Modelled and observed SMB (circles, same colour scale), in kg m−2 year−1. From [20].](https://thumb-us.123doks.com/thumbv2/123dok_us/8093482.1350912/3.595.155.393.81.428/fig-modelled-observed-smb-circles-colour-scale-year.webp)