Characterization of the mechanical behavior of ultrafine-
grained metals using digital image correlation
M. Hokka1,2,a, J. Seidt2, T. Matrka2, A. Gilat2, V.-T. Kuokkala1, J. Kokkonen1 and S. Müller3
1Tampere University of Technology, Department of Materials Science, POB 589, Tampere, Finland 2The Ohio State University, Department of Mechanical Engineering, 201 West 19th Avenue,
Columbus OH, 43210 USA
3Technische Universität Berlin, Extrusion Research and Development Center, Gustav-Meyer-Allee
25, D-13355 Berlin, Germany
Abstract. Nanocrystalline and ultrafine-grained materials show many very interesting properties compared to the conventional coarse-grained materials. For example, their strength values are usually much higher but, on the other hand, their ductility and deformability can be significantly lowered by the grain size refinement processes. One of the methods used to refine the grain size of metals is severe plastic deformation (SPD), which usually produces highly oriented structures that are strong but may deform non-homogeneously. In this paper, the deformation behavior of severe plastic deformation processed AZ31 magnesium alloy and commercially pure 1070 aluminum were characterized in compression and torsion using mechanical testing and high speed photography with digital image correlation. The results show that the AZ31 magnesium alloy deforms fairly uniformly in compression until fracture and the strains calculated from the movements of the ends of the anvils and the Lagrange strain on the surface of the specimen describe the overall deformation quite well. For the 1070 UFG aluminum, the shear deformation localizes very rapidly and the average strains measured from the surface or calculated from the displacements of the bars underestimate the true strain in the shear bands significantly. Also, the deformation in the torsion tests was not uniform shear but substantial strains were also measured in the axial direction. These strains were most likely due to small experimental errors, such as slight misalignment of the bars and the specimen in the test.
1 Introduction
The mechanical properties of most materials are strongly affected by strain rate. Usually the strength of material increases with increasing strain rate, especially at strain rates around 103 s-1, where a rapid increase in strength is often observed. In practice, high strain rates in the range of 103 s-1 to 104 s-1 occur in many industrial applications and high speed material forming methods, such as dynamic loading of structures and cold heading, as well as in many events of practical importance such as automotive crashes and various defense and aerospace applications. At quasi-static and intermediate
a e-mail : [email protected]
© Owned by the authors, published by EDP Sciences, 2010 DOI:10.1051/epjconf/20100605005
strain rates (<~500 s-1), the deformation behavior of crystalline materials such as coarse-grained
metals is readily explained by the thermally activated dislocation motion. At higher strain rates (>~1000 s-1), the dislocation drag mechanisms start to control the deformation behavior, and usually
the strength of the material increases much faster than in the thermally activated region due to the change in the deformation and transient hardening mechanisms. However, when the crystal sizes are decreased to nanometer scale, the movement of dislocations becomes more and more difficult and new phenomena may take place. At the moment, the strain rate dependent deformation and strain hardening mechanisms of nanocrystalline metals are not yet properly understood, despite the quite extensive research that has been done on these materials over the past decade.
Bulk nanocrystalline (nc) metals have significantly improved strength properties and usually lower deformability and ductility compared to the coarse-grained metals. These materials can be produced using several techniques, but the two main competing technologies are compaction and sintering of nanopowders and severe plastic deformation (SPD) of bulk metals. However, only SPD techniques enable production of impurity and porosity free bulk metals from basically any metal, which cannot be done with conventional powder metallurgical techniques. In addition, severe plastic deformation does not require atomization of the metal as the nanocrystallization is performed in bulk form, which is environmentally more friendly and less hazardous since there is no need to handle the nanoparticle powders. In principle, any coarse-grained bulk metal may be plastically deformed in such a way that its grain size is reduced to submicroscopic level, but so far the most commonly studied nanocrystalline bulk metals are copper, aluminum and its alloys, titanium and its alloys, and tantalum. Ultrafine-grained (ufg) materials have similar properties as the nanocrystalline metals, i.e., very high strength, generally low ductility due to tensile or shear instability, low strain hardening capability, high fatigue strength, and altered strain rate sensitivity compared to coarse-grained materials [1]. Usually materials with grain size below 100 nm are referred to as nanocrystalline and those with grain size between 100 nm and 1 µm as ultrafine-grained. The potential applicability of both nanocrystalline and ultrafine-grained materials is wide, including aerospace applications, transportation, health care equipment and components, defense applications, and even implant technology due to the high purity of the materials.
1.1 Digital image correlation
Digital image correlation (DIC) can be used to measure 3D surface displacement fields of the specimen during dynamic or static loading. Typically two digital cameras viewing the specimen at different angles are used to acquire pairs of images of the specimen. The displacements are then calculated by dividing the images into smaller subsets or facets and by matching the facets in each image pairs to track their movement in subsequent images. Theoretically, the accuracy of the image subset matching can be even as high as 1/200 of a pixel [7]. The strains on the surface of the specimen can therefore be determined with a very high spatial resolution even with relatively poor pixel resolution of the image.
The digital image correlation has been found very useful in the characterization of strain distributions in compression and tension experiments [2-4]. In high strain rate tension experiments, in particular, the strains calculated based on the relative motions of the ends of the specimen can give erroneous results due to the localization of strain after necking, but also because of the yielding of the rounded fillet regions of the specimens and the uncertainties in the true gage length determination of the specimen.
14th International Conference on Experimental Mechanics
using conventional material testing methods. Also, while conducting mechanical testing at a very wide range of strain rates, the average strain in the specimen is usually measured using several different techniques that may lead to problems when comparing the properties in different strain rate regimes. The digital image correlation can be used virtually at any strain rate provided that the frame rates of the cameras are sufficient. In this paper, the mechanical properties of a reciprocating extrusion processed AZ31 magnesium alloy were tested in compression and ECAP processed 1070 commercially pure (99.7-wt%) aluminum in torsion. The tests were monitored with two digital cameras and the strains were calculated using the digital image correlation technique. Special emphasis was placed on how the digital image correlation can be effectively used to analyze the development of strains during the test.
2 Materials and experiments
The materials studied in this work were ultrafine-grained AA1070 (99.7 wt-% Al) commercial purity aluminum and near-UFG AZ31 magnesium alloy. Torsion tests at a wide range of strain rates were performed on the UFG aluminum, whereas compression tests were performed on the near-UFG AZ31 magnesium alloy. Some torsion tests were also performed on the standard AA7075 aluminum alloy for comparison.
The grain size of the 1070 aluminum was refined by Equal Channel Angular Pressing by passing the billet four times through a 2-turn 90° channel die at room temperature, leading to a total accumulated shear strain of about 9.4. The average grain size after the ECA –pressing was estimated to be roughly 750 nm based on transmission electron micrographs [5]. The aluminum was produced at the Institute of Materials Processing Technology at Warsaw University of Technology. The technique and equipment used for the processing are described in more details in refs. [9-10]
The original size of the billets was 26*26*120 mm3, from which the torsion specimens were
manufactured. First the billets were dissected into four rectangular blocks of 12*12*120 mm3 and
then machined into thin walled tube specimens. The gage length of the specimens was 5.08 mm (0.2 in) or 2.54 mm (0.1 in), the mean gage diameter 9.27 mm (0.365 in), and the wall thickness 0.38 mm (0.015 in) and 0.76 mm (0.03 in) for the 7075 aluminum alloy and ultrafine grained 1070 aluminum, respectively.
a) b)
Fig. 1. Schematics of the grain size refinement procedures used for the tested materials, a) the reciprocating extrusion used for the AZ31 magnesium alloy [after 6], and b) the ECAP die used for the 1070
aluminum.
Mechanical testing at low strain rates was performed using a servohydraulic materials testing machine equipped with both axial and angular actuators and load cells, whereas the high strain rate testing was done using Split Hopkinson Pressure Bar devices.
The compression Split Hopkinson Pressure Bar consisted of two 12.7 mm (0.5 in) titanium bars, between which the specimen was sandwiched. The SHPB test is performed by impacting a striker bar on the free end of the incident bar, producing a compressive stress pulse that propagates in the incident bar towards the specimen. As the pulse reaches the bar-specimen interface, part of the pulse is reflected back as a wave of tension while part of the incident wave is transmitted through the specimen into the transmitted bar. The three stress pulses, incident, reflected, and transmitted, are measured using resistive strain gages bonded on the surfaces of the bars, amplified and finally recorded on a digital oscilloscope. The stress, strain, and strain rate in the specimen can then be easily calculated from the stress pulses using Matlab based calculation routines.
The torsion Split Hopkinson Pressure Bar device is somewhat more complicated than the compression equipment. The torsional stress is first stored in the incident bar by a hydraulic pulley and a clamp-release system. The torsion stress pulse is generated simply by releasing the stored torque by breaking the clamp pin by a second hydraulic press. The bar stresses are measured by three strain gage stations and the pulses are calculated from the measured signals by applying the appropriate time shifts [8].
2.1 Strain Measurements
Measuring strain at a wide range of strain rates usually requires several different measurement techniques to cover each strain rate regime. At low strain rates, the strain is usually measured directly from the specimen using extensometers, or calculated from the motion of the anvils from the LVDT transducer signals. At high strain rates, on the other hand, the strains are usually calculated from the time resolved strain signals measured from the stress bars with strain gages. With digital image correlation, the strains can be measured using the same method at a very wide range of strain rates, and the maximum strain rate is only limited by the maximum frame rate, resolution, and optical properties of the digital cameras. In this study, two Grasshopper (Point Gray Research) 2 megapixel cameras were used in the low strain rate tests at the maximum frame rate of 19 s-1. Two
N
E
N i i E∑
=−
+
=
1 111
2
1
ε
(1)In the torsion tests, the strain measurements were complicated by the very high degrees of strain and the problems in maintaining a good contrast pattern on the surface of the specimen. First, a black base coat with hand painted white coarse dots were used for maximum contrast, but the paint chipped off from the surface after 30-40% of strain and the DIC signal was lost. A white Krylon base coat and spray painted black contrast patterns were found to have better adhesion to the surface, but the lower contrast lead to slightly lower spatial accuracy of the measurements.
To overcome the problem of losing the contrast pattern at high strains, the ends of the specimen outside the gage section were also painted and the displacements of the ends of the gage section were calculated from the images. From these displacements, the rotation or the twist angle of the specimen was calculated, and finally the average strains in the specimen were calculated using Equation 2, where rs and ls are the average radius and length of the gage section of the specimen, θ is
the angle of twist, and a and b are the vectors from the centerline of the specimen to the surface at
the opposite ends of the gage section.
)
||
||
*
||
||
arccos(
b
a
b
a
l
r
l
r
s s ss
=
•
=
θ
γ
(2)
3 Results and discussion
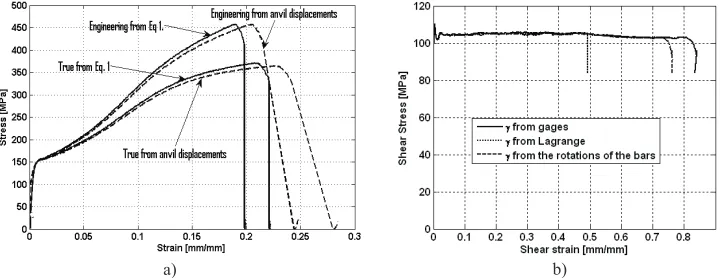
In Figure 2a, compressive stress-strain curves for the cast, extruded and SPD processed near-UFG AZ31 alloy measured at the strain rate of 10-3 s-1 are plotted using both the strains measured directly
from the specimen and the strains calculated from the displacements of the anvils of the materials testing machine. The difference between the curves is quite small at low strains, but at higher strains there is an increasing shift between the curves, indicating that the strains measured directly from the specimen are much smaller than those calculated from the displacements of the anvils. This is typical for a compression test, and the difference is mainly due to the barreling of the specimen during compression. The different compressive strains measured from the anvil displacements with DIC or directly from the surface of the specimen are well comparable for this type of a material, which deforms fairly uniformly and fractures at a fairly low strain. If the strains were much higher, the strains would most likely differ more due to the increasing barreling at higher strains.
In the dynamic torsion test, the shear strain can be calculated either from the stress pulses in the bars, from the Lagrange shear strain (γ=2*εxy) measured directly from the surface of the
specimen, or from the displacement of the ends of the specimen using Eq. 2. Figure 2b shows the comparison of the shear stress-shear strain curves obtained with strains determined with the three above mentioned methods for the UFG 1070 aluminum at the strain rate of 1000 s-1. The Lagrange
a) b)
Fig. 2. Stress-strain curves obtained with different strain determination methods for a) cast, extruded and SPD processed AZ31 in compression at the strain rate of 10-3 s-1, and b) UFG 1070 aluminum in torsion at
the strain rate of 1000 s-1.
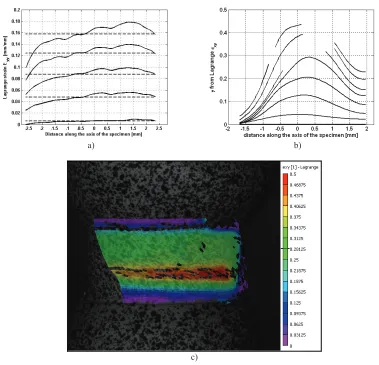
The strains measured and calculated from the torsion specimens are better shown in Figure 3, which shows the transverse and axial strain components, εxx, εyy, and the three different shear strains
measured with digital image correlation and using the stress waves in the bar. Figure 3a shows the strains for the 7075-T6 aluminum alloy at the strain rate of 480 s-1, and Figure 3b for the UFG 1070
aluminum at the strain rate of 1000 s-1. For both materials it is clear that the deformation is not
uniform shear, as assumed by the one dimensional wave propagation that is used in calculating the specimen strain from the stress pulses measured from the pressure bars. The specimen undergoes deformation also in other directions, especially in the direction of the axis of the specimen (εyy),
whereas the transverse strain component εxx is very small. The shear strain calculated from the stress
pulses increases quite linearly, whereas the strain calculated from the displacements of the ends of the bars shows somewhat less linear behavior. The average shear strain measured directly from the surface of the specimen over the gage section is clearly higher than the average shear strain calculated from the rotations of the bars. The strains εxx and εyy are most likely caused by a
combination of several small experimental errors, including slight misalignment of the bars, bending of the bars near the specimen, eccentric positioning of the specimen, and eccentric machining of the tubular specimen.
a) b)
Fig. 3. Lagrange strains measured from the surface of the specimen (εxx,εyy) and the shear strains calculated
14th International Conference on Experimental Mechanics
the strain is somewhat asymmetric with respect to position but increases quite uniformly with time. In different tests, however, the degree of asymmetry varied quite much for reasons that are not completely understood. The average strain (dashed lines in Figure 4a) represent fairly well the overall deformation of the specimen, especially at low strains, which is typical for compression tests [2]. In the compression tests of AZ31, the strain localized and shear bands were formed just before the final fracture. In the torsion tests of UFG aluminum, strain localizes very rapidly after yielding and most of the deformation occurs in a very narrow region roughly in the middle of the gage section. A fully developed shear band can be seen in Fig 4c. Therefore, in a torsion test the average strain over the whole gage section is significantly lower than the local strains in the shear band. As seen in Figure 4b, the maximum strain at the ends of the specimen is around 5% at one end and 25% at the other end, whereas in the shear band it is around 45%. The average shear strain calculated over the whole gage section of the specimen from the Lagrange strain (γ=2*εxy) is significantly higher
than the other average shear strains, i.e., shear strain calculated from the stress pulses and from the displacements of the ends of the specimen, but it still is much lower than the shear strains in the shear band. Therefore, the “true” shear strain should be calculated only from the localized region instead of using an average over the whole gage section of the specimen.
a) b)
c)
3 Summary
Mechanical testing was performed on reciprocating extrusion processed near-ultrafine-grained AZ31 magnesium alloy, ECAP processed ultrafine-grained commercially pure AA 1070 aluminum, and standard 7075-T6 aluminum alloy. Compression tests were performed on the AZ31 alloy and torsion tests on the UFG aluminum and 7075 aluminum alloy. The tests were monitored using digital cameras, and the strain distributions on the specimen surfaces were calculated using the digital image correlation technique. In the compression tests of AZ31, the strains in the specimen were relatively homogeneously distributed and uniform, and no localization of strain was observed until the final 45º shear fracture of the specimen that was preceded by the formation of a shear band with very high local strains. The behavior of the ultrafine-grained aluminum in the torsion tests was more complicated, and the strains localized very rapidly already in the early stages of the test. In general, the shear band that is formed during the deformation has much higher strains than the surrounding areas, and the average strain measured from the displacements of the ends of the bars do not describe the material’s true behavior correctly. Also, the deformation in the torsion tests was found not to be uniform shear, but also significant axial strains were observed during the tests. These axial strains were obviously due to slight experimental errors such as the slight misalignment of the bars and the specimen. Strain measured from the rotational displacements of the ends of the specimen seem to be more accurate than the strain obtained from the signals of the strain gages glued in the stress bars, which do not take into account the possible eccentric motions of the ends of the bars.
Acknowledgements
Dr. A. Rosochowski and Dr. L. Oljenik are thanked for providing the ultrafine-grained 1070 aluminum material. This work was partly funded by the Finnish FundingAgency for Technology and Innovation (MIVA project) and the Academy of Finland under the grant No. 130780. The support from the Finnish Foundation for Technology Promotion is also acknowledged.
References
1. R. Valiev, T. Langdon, Progress in Materials Science. 51, (2006) 2. A. Gilat, T. Schmidt, A. Walker, Experimental Mechanics, 49, (2009) 3. A. Gilat, T. Schmidt, J. Tyson, Society for Experimental Mechanics, (2006) 4. A. Gilat, A. Walker, J. Seidt, Society for Experimental Mechanics, (2008)
5. J. Kokkonen, V.-T. Kuokkala, L. Olejnik, A. Rosochowski, Society for Experimental Mechanics, (2008)
6. K. Müller, S. Müller, Journal of Materials Processing Technology, 178-188, (2007)
7. M. Sutton, J.-J. Orteu, H. Schreier, Image Correlation for Shape, Motion and Deformation Measurements (Springer Science, New York, NY, USA, 2009)
8. A. Gilat, ASM Handbook, Volume 8, Mechanical Testing and Evaluation (ASM International, Materials Park, OH, USA, 2000)
![Fig. 1. Schematics of the grain size refinement procedures used for the tested materials, a) the reciprocating extrusion used for the AZ31 magnesium alloy [after 6], and b) the ECAP die used for the 1070 aluminum](https://thumb-us.123doks.com/thumbv2/123dok_us/8094891.1351199/4.482.49.419.44.178/schematics-refinement-procedures-materials-reciprocating-extrusion-magnesium-aluminum.webp)