COST OPTIMIZATION AND EFFECT OF ACO
PARAMETERS ON OPTIMIZED COST OF THE
WIRELESS NETWORK
Nishtha Gupta
Electronics and Communication, ABES Engineering College, Noida (India)
ABSTRACT
Wireless is increasing day by day in the revolution of information technology. To formulate a design of wireless
access network, by optimizing the objective function with the help of various set of constraints like total cost,
data rate enhancement, throughput etc. The biggest challenge is to deal with optimizing problem. This paper
focuses on optimizing or reducing the cost of wireless networks by improving the performance of the network
i.e. maximizing throughput, minimizing end to end delay and jitter. The goal is to implement such an ACO
algorithm that optimizes the cost by improving the performance of the network and how the ACO parameters
effects optimized cost.
Keywords- ACO, Quality of Service, Wireless Network
I. INTRODUCTION
In the previous papers various algorithms are proposed to optimized the cost of the wireless network by
considering different set of constrains [1, 2, 4]. Wireless network consist of a large number of mobile nodes with
the help of which communication can be done. Complexity increases with increase in mobile nodes.
In networking and computer science, the traffic handling term known as quality of service (QoS) which refers to
resource control mechanisms rather than the service quality which can be achieved. With the help of Quality of
service priority can be assigned to various applications, users, or data flows, or to assure a level of performance
to a data flow. There are many QOS metrics and those metrics are divided into two parts additive and concave.
Throughput is the concave metrics i.e. non additive metrics whereas end to end delay and jitter are the additive
metrics. Finding the best path i.e. the shortest path between the sources to destination is a difficult problem and
to deal with additive and concave metrics optimization technique is used. In this paper, we propose an algorithm
to minimized the cost using QOS parameters as a set of constraints and effect of ACO parameters on the
optimized cost.
II. METHODOLOGY
Ant colony optimization is the technique which has been implemented for solving various optimization
problems with best results. Ants don’t use any direct communication they use indirect communication for
2.1 Problem Formulation
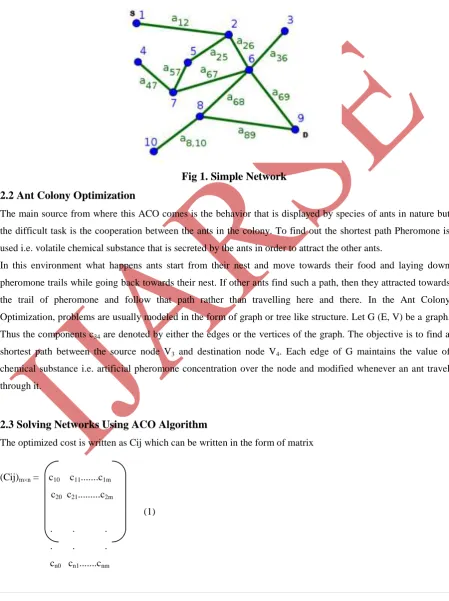
A simple network is considered in which objects are referred as nodes and connection between these nodes are
vertices. Let N be the number of nodes (N1, N2, Nn) and M number of connections. Let Cj is the optimized cost
of wireless network. Now the packet should be reached from source to destination by finding the shortest path
using ACO.
Fig 1. Simple Network
2.2 Ant Colony Optimization
The main source from where this ACO comes is the behavior that is displayed by species of ants in nature but
the difficult task is the cooperation between the ants in the colony. To find out the shortest path Pheromone is
used i.e. volatile chemical substance that is secreted by the ants in order to attract the other ants.
In this environment what happens ants start from their nest and move towards their food and laying down
pheromone trails while going back towards their nest. If other ants find such a path, then they attracted towards
the trail of pheromone and follow that path rather than travelling here and there. In the Ant Colony
Optimization, problems are usually modeled in the form of graph or tree like structure. Let G (E, V) be a graph.
Thus the components c34 are denoted by either the edges or the vertices of the graph. The objective is to find a
shortest path between the source node V3 and destination node V4. Each edge of G maintains the value of
chemical substance i.e. artificial pheromone concentration over the node and modified whenever an ant travel
through it.
2.3 Solving Networks Using ACO Algorithm
The optimized cost is written as Cij which can be written in the form of matrix
(Cij)m×n = c10 c11...c1m
c20 c21...c2m
(1)
. . .
. . .
A network can be defined as:
(yij)m×n = y10 y11...y1m
y20 y21...y2m
(2)
. . .
. . .
yn0 yn1...ynm
where yij in (2) is defined as
yij = {1 if node 1 is connected to 2
0 if node is not connected
Algorithm proposed for optimizing the cost
2.4 Algorithm In Pseudo Code
– Initialize Trail
– Do While (Stopping Criteria Not Satisfied) – Cycle Loop • Do Until (Each Ant Completes a route) – route Loop • Local Trail Update
• End Do
• Analyze Routes
• Calculate routing metrics • Global Trail Update
• Calculate Throughput, delay and jitter • Determine the objective function
– End Do
2.5 Key Parameters
1. Trail intensity 34 which indicates the intensity of the pheromone on the trail segment, (34)
2. Trail visibility is 34 = 1/d34
3. The importance of intensity is given by
4. The importance of visibility is given by
5. The trail persistence or evaporation rate is given as
2.6 Edge Selection
An ant is a simple communicating agent who communicates indirectly in the ant colony optimization algorithm.
It iteratively constructs a solution to any type of problem whereas solution states are given by intermediate
solutions and in this algorithm, each iteration ant moves from colony to food in order to complete the
intermediate solution. Thus, each ant computes a set of feasible solutions. For ant n, the probability p of moving
the attractiveness η34 of the move, and the trail level τ34 of the move. The nth ant moves from state 3 to
state 4 with probability i.e. the probability of moving towards next node is given by
= (3)
2.7 Pheromone Update
When all the ants have completed a solution i.e. reach towards their food from nest then the trails are updated by
= (1- ) + (4)
Where is the amount of pheromone deposited for a state transition 34, ρ is the pheromone evaporation
coefficient and is the amount of pheromone deposited.
2.8 Objective Function
The network cost D is defined as:
D=sum(C×m1)+(C×m2)+ (C×m3) (5)
where m1, m2 and m3 are the performance metrics i.e. throughput, delay and jitter
D i.e. the objective function should be minimum whereas
m1 is maximum and m2 , m3 are minimum.
III. SIMULATION MODEL
Cost is evaluated using QUALNET 5.0.2 and MATLAB 7.0.
Performance metrics throughput, average end to end delay and average jitter are used to evaluate the cost of the
wireless network. Optimized parameters alpha, beta and rho are considered for finding the minimum cost.
3.1 SIMULATION PARAMETERS
For the experiment, we have considered different nodes of different difficulty levels. We have tried the different
combinations of ACO parameters to get the best optimized result. The experiment was conducted on different
problems at frequency 2.4GHz and data rate 2Mbps.
Table1: Beta =5 and rho = 0.65
Alpha Delay and
Jitter
Throughput Cost
0.2 56.0022 1448.0023 804
0.5 56.0022 1384.0024 588
1 52.0022 1454.0023 414
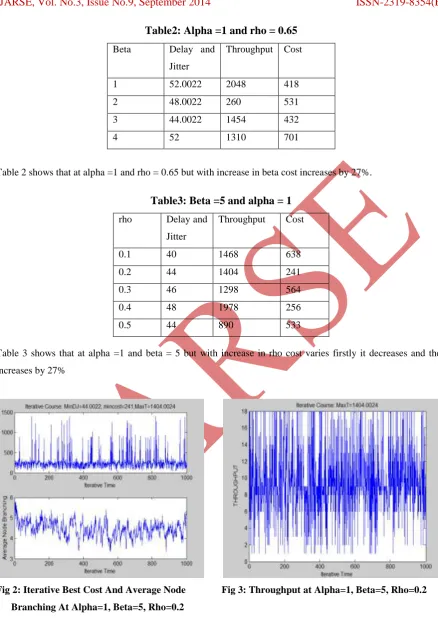
Table2: Alpha =1 and rho = 0.65
Beta Delay and
Jitter
Throughput Cost
1 52.0022 2048 418
2 48.0022 260 531
3 44.0022 1454 432
4 52 1310 701
Table 2 shows that at alpha =1 and rho = 0.65 but with increase in beta cost increases by 27%.
Table3: Beta =5 and alpha = 1
rho Delay and
Jitter
Throughput Cost
0.1 40 1468 638
0.2 44 1404 241
0.3 46 1298 564
0.4 48 1978 256
0.5 44 890 533
Table 3 shows that at alpha =1 and beta = 5 but with increase in rho cost varies firstly it decreases and then
increases by 27%
Fig 2: Iterative Best Cost And Average Node Fig 3: Throughput at Alpha=1, Beta=5, Rho=0.2 Branching At Alpha=1, Beta=5, Rho=0.2
IV. CONCLUSION AND FUTURE SCOPE
From the above results it is concluded that wireless network is proposed to optimize three performance metrics
i.e. throughput, end to end delay and jitter and determines the optimized cost of the network. This will optimized
function at various combinations of ACO parameters like at alpha=2, beta= 2 and rho = 0.4 and so on but the
best optimized cost function is at alpha=1, beta= 5 and rho= 0.2. Further it can be implemented using tabu
search method and by considering more than three parameters.
REFERENCES
[1] Dac-Nhuong Le, Nhu Gia Nguyen, and Trong Vinh Le, A Novel PSO-Based Algorithm for the Optimal
Location of Controllers in Wireless Networks, International Journal of Computer Science and Network
Security, Vol.12 No.8,23--27 (2012).
[2] Rajeshwar Singh, “Performance Evaluation of ACO based on demand routing algorithm for mobile Adhoc
network”, IJEST, vol 3, No. 3, March 2011
[3] Singh Rajeshwar, D.K Singh and Lalan Kumar, “Ants Pheromone for Quality of Service provisioning in
mobile Adhoc networks”, International Journal of Electronics Engineering and Research, 2(1): 101-109,
April 2010
[4] Al Huda Amri and et. al., “Scalability of manet routing protocols for heterogeneous and homogenous
networks”, Computers and Electrical Engineering, 2008 Problem using Ant Colony Algorithm
[5] R.Asokan, A.M. Natarajan and A. Nivetha, “A swarm-based distance vector routing to support multiple
Quality of Service (QOS) metrics in mobile Adhoc Networks”, Journal of computer science, 2007
[6] M. Dorigo, M. Birattari, and T. Stitzle, Ant Colony Optimization: Artificial Ants as a Computational
Intelligence Technique”, IEEE computational intelligence magazine, (2006).
[7] Gianni Di Caro, Frederick Ducatelle and Luca Maria Gambardella, “Swarm intelligence for routing in
mobile Adhoc Networks”, IEEE, 2005
[8] K. Kraimeche, B. Kraimeche, K. Chiang, Optimization of a wireless access network (2005).
[9] M. Dorigo, V. Maniezzo, and A. Colorni, Ant system: Optimization by a colony of cooperating agents,