Eight-year follow-up study of brain
atrophy in patients with MS
E. Fisher, PhD; R.A. Rudick, MD; J.H. Simon, MD, PhD; G. Cutter, PhD; M. Baier, MS; J.-C. Lee, MS;
D. Miller, PhD; B. Weinstock-Guttman, MD; M.K. Mass, MD; D.S. Dougherty, MD; and N.A. Simonian, MD
Abstract—Objective: To characterize whole-brain atrophy in relapsing-remitting MS (RRMS) patients over an 8-year period. The specific goals of this study were to determine if brain atrophy is related to subsequent disability status and to identify MRI correlates of atrophy progression. Methods: A follow-up study was conducted to reassess patients from a phase III trial of interferon-1a (IFN-1a) 8 years after randomization. Clinical and MRI data from 172 patients followed over 2 years in the original trial were used as baseline data. Follow-up data were obtained on 160 patients, including 134 patients with follow-up MRI examinations. Brain atrophy was estimated by automated calculation of brain parenchymal fraction. The relation between atrophy during the original trial and disability status at follow-up was determined. Correlations were also determined between lesion measurements from the original trial and the brain parenchymal fraction at follow-up.Results: Brain atrophy was correlated with subsequent disability status. Atrophy rate during the original trial was the most significant MRI predictor of disability status at follow-up. Brain atrophy at follow-up was related to lesion volumes measured during the original trial.Conclusions:The relation between atrophy progression and subsequent neurologic disability status suggests that atrophy progression during RRMS is clinically relevant. Therefore, atrophy progression may be a useful marker for disease progression in clinical trials. The relation between lesions and subsequent atrophy indicates that brain atrophy may be related to focal tissue damage at earlier points in time, but important predisposing or other factors contributing to atrophy remain undefined.
NEUROLOGY 2002;59:1412–1420
MRI has fallen short of expectations in terms of
pro-viding a surrogate marker in MS. The lack of robust
correlations between conventional MRI measures of
pathology and clinical measures of disability has
been attributed to various shortcomings of both MRI
and clinical assessments. At least part of the
discrep-ancy may be due to the use of MRI measurements
that include both reversible and irreversible
compo-nents of MS pathology. Conventional MRI lesion
measurements also neglect to account for diffuse
ab-normalities in normal-appearing tissue in MS. One
of the alternative MRI measures that have been
pro-posed to monitor MS progression is the estimation of
CNS atrophy.
1-11In contrast to MRI-visible lesions,
CNS atrophy is believed to reflect the net effect of
severe and potentially irreversible processes such as
demyelination and axonal loss. Measurement of the
size of CNS structures may provide an indication of
the total amount of tissue damage that has occurred
up to a given point in time. New computer-assisted
methods have been developed to precisely and
reli-ably quantify tissue loss in MRI,
5-13and atrophy has
been shown to occur even in the early stages of
MS.
3,4,6-9However, previous longitudinal studies in
MS
3,6-9,14-16have not shown very strong or consistent
relations between brain atrophy and disability.
These studies have been limited to relatively short
follow-up periods of 6 months to 3 years.
The goals of this study were to determine if brain
atrophy was related to progression of disability over
a longer period of time and to identify MRI correlates
of atrophy progression in patients with
relapsing-remitting MS (RRMS). To address these questions,
we analyzed data that had previously been acquired
during a phase III trial of IFN

-1a in conjunction
with new data that were acquired as part of an
8-year follow-up study to validate the MS Functional
Composite (MSFC).
17Initial results from this
follow-up study on the significant cross-sectional
cor-relations between brain atrophy and disability have
been recently reported.
17,18This report presents a
more complete analysis of the longitudinal and
pre-From the Whitaker Biomedical Imaging Laboratory (Dr. Fisher), Department of Biomedical Engineering, Mellen Center for Multiple Sclerosis Treatment and Research (Drs. Rudick and Miller), and Department of Biostatistics and Epidemiology (Dr. Lee), The Cleveland Clinic Foundation, OH; Department of Radiology (Dr. Simon), University of Colorado Health Sciences Center, Denver; University of Nevada (Dr. Cutter), Reno; Center for Research Methodology and Biometrics (Dr. Baier), AMC Cancer Research Center, Denver, CO; Department of Neurology (Dr. Weinstock-Guttman), Buffalo General Hospital, NY; Department of Neurology (Dr. Mass), Oregon Health Sciences University, Portland; Department of Neurology (Dougherty), Thomas Jefferson University, Philadelphia, PA; and Millennium Pharmaceuticals, Inc. (Dr. Simonian), Cambridge, MA.
Supported by NINDS RO1 26321, NMSS RG3099, and Biogen, Inc. (original clinical trial) and by NIH PO1 NS38667 (long-term follow-up study). Presented in part at the 52nd annual meeting of the American Academy of Neurology; San Diego, CA; April 29, 2000; and the 53rd annual meeting of the American Academy of Neurology; Philadelphia, PA; May 2, 2001.
Received December 3, 2001. Accepted in final form August 9, 2002.
dictive relations between brain atrophy, MRI lesion
measurements, and disability. Three specific
ques-tions are addressed: 1) Is the rate of atrophy in
RRMS predictive of the subsequent development of
disability? 2) What are the characteristics of atrophy
progression over the course of 8 years? and 3) Are
MRI lesion measurements in RRMS related to the
subsequent progression of brain atrophy?
Methods. Clinical trial (1990 through 1994). Clinical and MRI data for the first 2 years were collected during the MS Collaborative Research Group (MSCRG) phase III trial of IFN-1a (AVONEX, Biogen, Cambridge, MA). Three hundred one patients with RRMS were enrolled at four sites (Buffalo, NY; Cleveland, OH; Portland, OR; and Washington, DC). To meet the inclusion criteria, patients had to score between 1.0 and 3.5 on the Kurtzke Expanded Disability Status Score (EDSS)19 and had to have had at least two relapses in the prior 3 years. Details of the trial design have been reported elsewhere.20 Clinical measures of disability included (among others) the EDSS, a timed 25-foot walk, the Nine-Hole Peg test, and the 3-second Paced Serial Addition Test. The MSFC21was computed as described.17 MRI examinations included a dual-echo, pro-ton density, T2-weighted spin-echo series (repetition time [TR] ⫽ 2000 ms, echo time [TE] ⫽ 30 and 90 ms) and T1-weighted spin-echo series (TR⫽600 ms, TE⫽20 ms) acquired before and after injection of contrast. Images were acquired with 192⫻256 matrix size, 240 mm field of view, and 5-mm-thick contiguous slices on 1.5-T scanners. MRI lesion measurements included T2-hyperintense lesion volume, contrast-enhancing lesion number and volume, and T1-hypointense lesion volume.22 The number of new and enlarging T2 lesions at year 2 and the cumulative number of contrast-enhancing lesions over 2 years were also determined. Lesion measurements were performed as part of the original trial at the University of Colorado Health Sciences Center in Denver. Brain parenchymal fraction (BPF) was calculated blindly with automated seg-mentation software developed at The Cleveland Clinic Foundation, as previously described.7
Follow-up study (1999). The follow-up study protocol was reviewed and approved by the Institutional Review Board (IRB) of each of the four participating sites. Patients who were enrolled for at least 2 years in the phase III study were eligible for this study. This requirement was included to ensure baseline, year 1, and year 2 data for the MSFC for each subject in the follow-up study. All patients who agreed to participate signed an IRB-approved in-formed consent form. Follow-up study visits consisted of a neurologic examination (EDSS, relapse history, current disease category, and history of disease-modifying drugs), an examination by a trained technician (MSFC, visual con-trast letter acuity), a patient quality-of-life questionnaire (Sickness Impact Profile23), and an MRI examination. Pa-tients who were not able to participate in a clinic visit were asked to complete an EDSS self-report,19disease-modifying therapy questionnaire, and Sickness Impact Profile ques-tionnaire. Family members of patients who had died in the interim were interviewed to record the cause of death and EDSS prior to death.
Image acquisition and analysis. As in the original clin-ical trial, a dual-echo, proton density, T2-weighted
spin-echo image series was acquired (TR⫽ 2000 ms; TE⫽ 30 and 90 ms) with 256⫻ 256 matrix size, 240 mm field of view, and 5-mm-thick contiguous slices on 1.5-T scanners at each of the original sites. The images were sent in digital format to the Cleveland Clinic, transferred to a UNIX file server, and converted to an internal image for-mat (BIP, Whitaker Biomedical Imaging Lab, Cleveland Clinic Foundation). All images were visually inspected and compared to images acquired during the phase III trial to verify consistency.
Brain atrophy was assessed with the same method that was used for the retrospective analysis of the phase III trial images.7In summary, a program was used to auto-matically measure the brain parenchymal volume (BV) and the total volume within the outer contour of the brain (TCV) using a knowledge-based, three-dimensional seg-mentation algorithm.24 The BPF was calculated as the ratio BV/TCV to provide a size-normalized measure of whole-brain atrophy. Previous validation studies showed that the accuracy is approximately 99% for brain volume measurement and the scan–rescan variability is approxi-mately 0.2% for BPF.7To process dual-echo image sets, the complete analysis pipeline included the following steps in one program: 1) correct intensity nonuniformities; 2) nor-malize the gray levels; 3) perform optimal linear combina-tion of the early and late echo images to null the signal from cerebral spinal fluid; 4) filter out noise if necessary; 5) perform the segmentation; and 6) calculate volumes ac-counting for partial volume effects. Following segmenta-tion, the image results were visually verified using custom display software. In cases where the segmentation failed with the default program settings, the process was re-peated with adjustments to parameters that control the filtering operations. BPF analysis was fully automated and performed blinded to clinical disability scores and other clinical information. Lesion analysis was not included in the follow-up study because it was considered to be outside the scope of the study (which was primarily to validate the MSFC and, secondarily, to study the predictive value of atrophy measurements for disability).
Analysis subgroups. The numbers of patients with available MRI measurements were different at each point in time. The numbers varied because some patients did not have MRI scans at the 8-year follow-up, and images from the original trial were omitted from analysis if the elec-tronic data were corrupted or lost in transfer or if the images were not acquired according to protocol—that is, with gaps between the slices or varying pixel sizes. There-fore, two different subgroups of patients were considered to address the specific questions of this study.
avail-able (n ⫽ 13), the 2-year atrophy rate was estimated as twice the annual percent change in BPF.
For the second two questions on the progression of atro-phy, the subgroup of all patients who had analyzable MRI scans at all four time points was considered. This subgroup was defined to ensure that all patients would have BPF measurements from the original trial and from the 8-year follow-up examination. MRI lesion measurements were also available for the majority of these patients during the original trial.
Statistical analyses. Correlations were calculated be-tween BPF and disability measurements at each time point using Spearman rank statistics. Patients were cate-gorized into two outcome groups based on whether their EDSS score at 8-year follow-up was less than 6.0 or greater than or equal to 6.0. This particular cutoff value was selected because it is a clinically meaningful and rela-tively objective milestone: EDSS 6 is the point at which a patient needs assistance to walk. Patients were subclassi-fied into quartiles based on percent BPF change during the 2-year phase III trial. The percent of patients in each quar-tile who reached EDSS 6 or greater were determined. Mean BPF at each time point was compared between the two EDSS outcome groups using the Mann–Whitney test. Logistic regression analyses were performed to determine which variables during the original trial were significant predictors of disability status at the 8-year follow-up. The following demographic and disease-related variables were considered in all models: age, sex, treatment group, dis-ease duration, number of relapses during the trial, time from baseline to the 8-year follow-up, and total percent time on treatment over the 8-year period. In addition, spe-cific disability and MRI variables were also considered for inclusion in each model. Continuous factors considered for the logistic regression models were plotted using a locally weighted smoothing scatterplot technique to assess linear-ity on the logit scale. A forward stepwise selection proce-dure was used with apvalue of 0.15 required to enter the model and a p value of 0.05 required to remain in each model.
Spearman correlations were also calculated to deter-mine the relation between MRI lesion measurements from the phase III trial and subsequent atrophy. Multiple re-gression analysis was performed to determine which pa-rameters from the original trial were significant predictors of the change in BPF from year 2 to the 8-year follow-up. The same demographic and disease-related variables as those used for the logistic regression analyses were consid-ered for inclusion in all models, in addition to model-specific disability and MRI variables. Linearity between each independent variable and the dependent variable was confirmed. A forward stepwise selection procedure was
used withpvalues of 0.15 to enter and 0.05 to remain in the model.
Results. Descriptive statistics. Follow-up clinical data were obtained on 160 (93%) of the 172 patients who were eligible for the study, including 3 patients who returned for a neurologic examination but refused MRI, 16 patients who completed self-reports for EDSS but did not have neu-rologic or MRI examinations, and 7 patients who died. EDSS scores prior to the terminal event for these seven patients were assigned by the neurologist after interview with the family and record review. The mean follow-up time was 8.1 years (SD 0.4, range 7.2 to 8.8 years) and disease duration at follow-up was 14.3 years (SD 5.5, range 8.5 to 39.0 years). MRI scans at the 8-year follow-up were acquired on 134 patients. All images were analyzable with the BPF software.
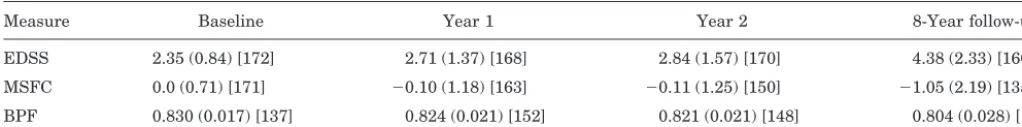
As a whole, the group worsened in terms of both disabil-ity and brain atrophy. The mean disabildisabil-ity level, measured with either the EDSS or MSFC, and the severity of brain atrophy worsened significantly between baseline and the 8-year follow-up point (table 1). At baseline, the mean EDSS was 2.4 (SD 0.9) and at follow-up it had increased to 4.1 (SD 2.0). Fifty-seven (35%) patients had progressed to EDSS ⱖ 6.0 by the 8-year follow-up. Similarly, mean MSFC worsened from 0.0 (SD 0.7) at baseline to⫺1.1 (SD 2.2) at the 8-year follow-up. The mean BPF decreased 3.1% from 0.83 (SD. 0.02) at baseline to 0.80 (SD 0.03) at the 8-year follow-up.
During the placebo-controlled 2-year trial, 49% of the patients in the follow-up group were taking IFN treat-ment. Treatment was uncontrolled and variable in the 6-year interim between the end of the phase III trial and the follow-up examination. Patients were taking disease-modifying drugs (IFN, glatiramer acetate, pulsed steroids, methotrexate, cyclophosphamide, or azathioprine) during the interim time from the end of the phase III trial until follow-up. The percent time on treatment during the year 2 to follow-up interval was 54.2% for the original treatment group and 46.5% for the original placebo group.
Available images. As described in the Methods section, two different subgroups of patients were considered to ad-dress the specific questions of this study. There were 138 patients who had at least two analyzable MRI scans dur-ing the original trial and an EDSS measurement at the 8-year follow-up (including 5 of the patients who died). This subgroup was considered for the first question regard-ing the relation between atrophy and subsequent disabil-ity. For the second two questions on the progression of atrophy, there were 106 patients who had analyzable MRI scans at all four time points. Baseline demographic and
Table 1Brain volume and disability measurements at each time point
Measure Baseline Year 1 Year 2 8-Year follow-up EDSS 2.35 (0.84) [172] 2.71 (1.37) [168] 2.84 (1.57) [170] 4.38 (2.33) [160] MSFC 0.0 (0.71) [171] ⫺0.10 (1.18) [163] ⫺0.11 (1.25) [150] ⫺1.05 (2.19) [135] BPF 0.830 (0.017) [137] 0.824 (0.021) [152] 0.821 (0.021) [148] 0.804 (0.028) [134] Values are expressed as mean (SD) [no. of patients].
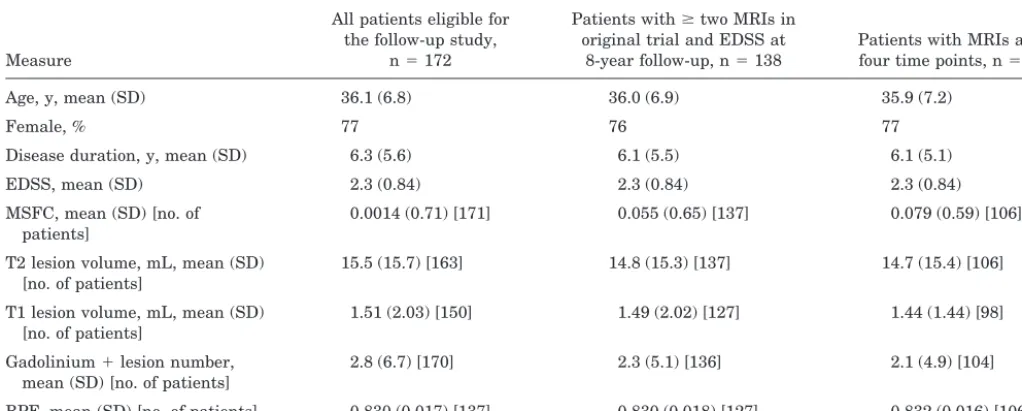
disease-related characteristics of these patient subgroups are given in table 2. There were no substantial differences between the subgroups at baseline for any of the variables measured.
Question 1: Relations between atrophy and disability.
As previously reported,17,18 BPF was correlated with con-current disability measurements at each of the four time points (baseline, year 1, year 2, and the 8-year follow-up). The concurrent correlations ranged from⫺0.27 (BPF and EDSS at year 1) to 0.51 (BPF and MSFC at year 1). The correlation between BPF and MSFC was consistently stronger than the magnitude of the correlation between BPF and EDSS at each time point. The change in BPF from year 2 to 8-year follow-up was correlated with change in EDSS in the same period (r⫽ ⫺0.31, p⫽0.0005) and with change in MSFC in the same period (r⫽ 0.30, p ⫽
0.001).
The relation between brain atrophy during the original trial andsubsequent progression of disability progression was studied in the subgroup of patients (n⫽138) with at least two analyzable MRI scans from the original trial and an EDSS measurement at the 8-year follow-up. In this subgroup, the mean EDSS at baseline was 2.3 (SD 0.8) and at the 8-year follow-up it had increased to 4.2 (SD 2.3). Forty-four (32%) of these patients had progressed to EDSS ⱖ 6.0 by follow-up. The mean MSFC had decreased from 0.055 (SD 0.65) at baseline to⫺0.95 (SD 2.1) at the 8-year follow-up. The mean percent change in BPF during the original trial was⫺1.1% (SD 1.3%) over 2 years.
Brain atrophy during the original phase III trial was related to EDSS, MSFC, and disability status at the 8-year follow-up. Percent change in BPF from baseline to year 2 was correlated with EDSS at the 8-year follow-up (r ⫽
⫺0.27,p⫽0.001) and with MSFC at the 8-year follow-up (r⫽ 0.35,p⬍0.0001). Quartile analysis showed that the patients with the least amount of atrophy during the trial were less likely to have reached EDSS 6.0 at the 8-year follow-up than those with the most amount of atrophy (figure 1). In the quartile of patients with little or no atro-phy from baseline to year 2 (change in BPF ⫹1.3% to ⫺0.26%), only 14.3% (SE 6.0%) had reached EDSS ⱖ 6.0
by the 8-year follow-up, whereas in the quartile of patients with the largest amount of atrophy during the 2-year trial (change in BPF ⫺.7 to ⫺6.5%), 55.9% (SE 8.4%) had reached EDSSⱖ6.0 by the 8-year follow-up. BPF change remained a significant predictor of disability status after adjusting for baseline EDSS score in a logistic regression model. The mean BPF at baseline, year 2, and the 8-year follow-up for each of the two EDSS outcome groups are shown in figure 2. In addition to the significant difference in the rate of atrophy during the original 2-year trial, the mean BPF was also significantly different at each time point for the group who reached EDSSⱖ6.0 by the 8-year follow-up as compared with those who did not.
Logistic regression analysis was performed to deter-mine which variables from the original trial were indepen-dently related to disability status at the 8-year follow-up. Since correlations were stronger between year 2 values
Table 2Baseline characteristics of patient subgroups
Measure
All patients eligible for the follow-up study,
n⫽172
Patients withⱖtwo MRIs in original trial and EDSS at
8-year follow-up, n⫽138
Patients with MRIs at all four time points, n⫽106 Age, y, mean (SD) 36.1 (6.8) 36.0 (6.9) 35.9 (7.2)
Female, % 77 76 77
Disease duration, y, mean (SD) 6.3 (5.6) 6.1 (5.5) 6.1 (5.1) EDSS, mean (SD) 2.3 (0.84) 2.3 (0.84) 2.3 (0.84) MSFC, mean (SD) [no. of
patients]
0.0014 (0.71) [171] 0.055 (0.65) [137] 0.079 (0.59) [106] T2 lesion volume, mL, mean (SD)
[no. of patients]
15.5 (15.7) [163] 14.8 (15.3) [137] 14.7 (15.4) [106] T1 lesion volume, mL, mean (SD)
[no. of patients]
1.51 (2.03) [150] 1.49 (2.02) [127] 1.44 (1.44) [98] Gadolinium⫹lesion number,
mean (SD) [no. of patients]
2.8 (6.7) [170] 2.3 (5.1) [136] 2.1 (4.9) [104] BPF, mean (SD) [no. of patients] 0.830 (0.017) [137] 0.830 (0.018) [127] 0.832 (0.016) [106] EDSS⫽Expanded Disability Status Scale; MSFC⫽MS Functional Composite; BPF⫽brain parenchymal fraction.
and follow-up than between baseline values and follow-up (data not shown), only the year 2 values were considered. The results are summarized in table 3. The following dis-ability and MRI variables were considered for inclusion in the first model (in addition to the demographic and disease-related variables): EDSS at year 2, MSFC at year 2, T2 lesion volume at year 2, T1 lesion volume at year 2, number of enhancing lesions at year 2, and BPF at year 2. A forward stepwise selection procedure was used. None of the demographic or MRI variables at year 2 was an inde-pendent predictor of disability status at the 8-year follow-up. Only EDSS and MSFC at year 2 were significant predictors of reaching EDSSⱖ6 at the 8-year follow-up.
A second model consisting of changes during the origi-nal 2-year trial was also tested. In addition to the demo-graphic and disease-related variables, the following disability and MRI variables were considered for inclusion in this model: EDSS change from baseline to year 2, MSFC change from baseline to year 2, number of new and enlarg-ing T2 lesions at year 2, change in T1 lesion volume from baseline to year 2, cumulative number of enhancing lesions from baseline to year 2, and BPF change from baseline to year 2. MSFC change and percent BPF change from base-line to year 2 were the only significant predictors of reach-ing EDSSⱖ6 at the 8-year follow-up.
Finally, both models were rerun without EDSS and MSFC in order to determine significant MRI predictors. For the first model (with year 2 values as independent variables), BPF at year 2 and number of relapses during the trial were the only significant predictors of reaching EDSS ⱖ 6 at the 8-year follow-up. For the second model (with baseline to year 2 changes as independent variables), percent change in BPF from baseline to year 2 and number
of relapses during the trial were the only significant pre-dictors of reaching EDSSⱖ6 at the 8-year follow-up.
Questions 2 and 3: Progression of atrophy over 8 years. The progression of brain atrophy over the course of 8 years was studied in the subgroup of patients (n⫽106) with analyzable MRI scans at all four time points (base-line, year 1, and year 2 of the original trial and the 8-year follow-up). The severity of brain atrophy worsened signifi-cantly between baseline and the 8-year follow-up. The mean percent change in BPF over the 6 years from the end of the phase III trial to the 8-year follow-up was ⫺2.0% (SD 1.9%). Patients who were originally in the placebo group of the phase III trial (n ⫽ 52) had a mean BPF change of ⫺3.0% from baseline to follow-up, whereas pa-tients who were originally in the treated group (n ⫽ 54) had a mean BPF change of⫺2.5% from baseline to follow-up. This difference was not significant (p⫽0.18). BPF and BPF percent change were not related to the total time on disease-modifying therapies from baseline to the 8-year follow-up.
In general, baseline BPF, follow-up BPF, and percent change in BPF were not correlated with age, sex, or dis-ease duration. The exceptions were that baseline BPF was weakly correlated to age (r ⫽ ⫺0.18, p⫽ 0.039) and dis-ease duration (r ⫽ ⫺0.29, p ⬍ 0.001), but these correla-tions were not observed at the 8-year follow-up. There was a weak correlation between the percent change in BPF from baseline to 8-year follow-up and the number of re-lapses during the 2-year controlled study (r⫽ ⫺0.26,p⫽
0.007). There was a strong correlation between baseline BPF and 8-year follow-up BPF (r⫽0.71,p⬍0.0001).
Figure 2. Mean brain parenchymal fraction (BPF) over the course of 8 years for all patients who had BPF mea-surements at all time points (diamonds, n⫽106), for the subgroup of these patients who had reached EDSSⱖ6.0 by the follow-up examination (squares, n⫽32) and for the subgroup who had not reached EDSSⱖ6.0 by the
follow-up examination (circles, n⫽74). Error bars indi-cate⫾SEM. Differences in mean BPF between the outcome groups were significant at each point in time. The rate of BPF change during the original 2-year trial was also sig-nificantly different between the outcome groups.
Table 3Logistic regression results for predicting EDSSⱖ6
Model no./variable Regression coefficient SE pValue 1*
Intercept ⫺2.75 0.74
EDSS (year 2) 0.64 0.24 0.0070 MSFC (year 2) ⫺0.98 0.39 0.012 2†
Intercept ⫺1.51 0.34
BPF change ⫺0.42 0.22 0.056 MSFC change ⫺2.21 0.53 ⬍0.0001 3‡
Intercept 24.39 8.06
BPF (year 2) ⫺31.95 9.89 0.0012 No. of relapses 0.50 0.12 ⬍0.0001 4§
Intercept ⫺2.15 0.37
BPF change ⫺0.45 0.18 0.0107 No. of relapses ⫺0.42 0.11 0.0001 * All risk factors at year 2, n⫽126.
† All on-study changes, n⫽125. ‡ Year 2 MRI, n⫽126.
§ MRI on-study changes, n⫽125.
BPF was correlated to lesion measurements from the phase III trial (table 4). The volumes of T2 lesions and T1-hypointense lesions were significantly correlated with BPF concurrently and at subsequent time points, with Spearman r values ranging from ⫺0.35 to ⫺0.55. The number and volume of enhancing lesions were only very weakly associated with BPF, if at all. However, in terms of predicting the rate of atrophy over the long term, ex-pressed as the change in BPF from year 2 to the 8-year follow-up, the number of enhancing lesions at year 2 was correlated with subsequent BPF change (r ⫽ ⫺0.31, p ⫽
0.002). Other lesion measures, especially at year 2, were also correlated with long-term atrophy rate, including the number of new and enlarging T2 lesions (r⫽ ⫺0.36,p ⬍
0.0001), the volume of T2 lesions (r⫽ ⫺0.35,p⫽0.0002), the volume of T1-hypointense lesions (r ⫽ ⫺0.36, p ⫽
0.0003), and the cumulative number of enhancing lesions during the trial (r⫽ ⫺0.26,p⫽0.008).
Multiple regression analysis was performed to deter-mine which variables at year 2 were independent predic-tors of subsequent atrophy (i.e., change in BPF from the end of the original trial to the 8-year follow-up). The re-sults are summarized in table 5. The following disability and MRI variables were considered for inclusion in the first model (in addition to the demographic and disease-related variables): EDSS at year 2, MSFC at year 2, T2 lesion volume at year 2, T1 lesion volume at year 2, and number of enhancing lesions at year 2. A forward stepwise selection procedure was used. The only significant predic-tors of subsequent atrophy were the number of enhancing lesions at year 2 and the volume of T2 lesions at year 2 (R2⫽0.29, adjustedR2⫽0.27).
A second model including changes during the original trial was also tested. In this model, the following disability and MRI variables were considered for inclusion (in addi-tion to the demographic and disease-related variables): EDSS change from baseline to year 2, MSFC change from baseline to year 2, number of new and enlarging T2 lesions at year 2, change in T1 lesion volume from baseline to year 2, and cumulative number of enhancing lesions from base-line to year 2. The only significant predictors of subsequent
atrophy were the number of new and enlarging T2 lesions at year 2 and the MSFC change from baseline to year 2 (R2⫽0.29, adjustedR2⫽0.28).
Discussion.
The follow-up study showed that
brain atrophy continued to progress in this group of
patients with RRMS during the 6 years after the
original trial. The degree of brain atrophy was
re-lated to disability, measured by both EDSS and
MSFC, as well as to T1, T2, and enhancing lesion
volumes. Atrophy rate during the phase III trial was
the only significant MRI predictor of disability status
at the 8-year follow-up, and it was more strongly
related to disability than were lesion volumes.
Sev-eral important aspects of brain atrophy in RRMS
were noted in the course of this work.
One of the main questions addressed by this study
is the relation between brain atrophy and
subse-Table 4BPF/lesion correlations (Spearman rank correlation coefficients)
Parameter Baseline BPF Year 2 BPF Follow-up BPF
BPF change (year 2 to follow-up) Baseline T2 lesion volume (n⫽106) ⫺0.41 (⬍0.0001) ⫺0.47 (⬍0.0001) ⫺0.54 (⬍0.0001) ⫺0.31 (0.001) Year 2 T2 lesion volume (n⫽106) ⫺0.37 (⬍0.0001) ⫺0.45 (⬍0.0001) ⫺0.55 (⬍0.0001) ⫺0.35 (0.0002) Year 2 new and enlarging T2 lesions
(n⫽106)
NS NS ⫺0.20 (0.04) ⫺0.36 (0.0002) Baseline T1 lesion volume (n⫽98) ⫺0.41 (⬍0.0001) ⫺0.50 (⬍0.0001) ⫺0.52 (⬍0.0001) ⫺0.25 (0.01) Year 2 T1 lesion volume (n⫽98) ⫺0.35 (0.0005) ⫺0.43 (⬍0.0001) ⫺0.54 (⬍0.0001) ⫺0.36 (0.0003) Baseline no. of
gadolinium-enhancing lesions (n⫽104)
0.25 (0.01) NS NS ⫺0.19 (0.056) Year 2 no. of gadolinium-enhancing
lesions (n⫽103)
NS NS ⫺0.17 (0.087) ⫺0.31 (0.002) Cumulative no. of gadolinium lesions
at year 2 (n⫽103)
0.21 (0.03) NS NS ⫺0.26 (0.008)
pValues are indicated in parentheses.
BPF⫽brain parenchymal fraction; NS⫽not significant.
Table 5Linear regression results for predicting percent change in BPF from year 2 to year 8 follow-up
Model no./variable
Regression
coefficient SE pValue 1*
Intercept ⫺1.24 0.21
No. of enhancing lesions ⫺0.36 0.07 ⬍0.0001 T2 lesion volume ⫺0.026 0.009 0.003 2†
Intercept ⫺1.12 0.22 No. of new and enlarging T2
lesions
⫺0.23 0.04 ⬍0.0001 MSFC change 0.49 0.19 0.011 * All risk factors at year 2, n⫽115.
† All on-study changes, n⫽10%.
quent progression of disability. BPF is a proposed
marker of disease progression that, unlike lesion
measurements, does not fluctuate over time and
pri-marily reflects severe tissue damage. However, the
rate of tissue loss may not be strongly related to
concurrent changes in disability in RRMS due to
compensatory mechanisms at this early stage of
dis-ease. One hypothesis is that the rate of irreversible
tissue damage in the relapsing-remitting stage of
disease will be predictive of
later
disability. There
have not been any previous studies on the long-term
predictive value of brain atrophy in MS. In this
study, the relation between BPF change and
disabil-ity measured at subsequent time points indicate that
patients with more atrophy during the original trial
had greater disability at the 8-year follow-up. The
quartile of patients with the largest amount of
atro-phy during the phase III trial were approximately
four times as likely to reach EDSS 6 or greater by
the time of the follow-up examination than the
quar-tile of patients with the smallest amount of brain
atrophy during the original trial. The logistic
regres-sion analysis showed that the amount of atrophy
during the original trial was an independent
predic-tor of EDSS status at the 8-year follow-up, whereas
the MRI lesion measurements and change in EDSS
during the original trial were not. Logistic regression
analysis with MRI variables demonstrated that BPF
and change in BPF were the only significant MRI
predictors of later disability status. Therefore, BPF
appears to be useful for predicting which patients
with RRMS have more aggressive disease. However,
because this study does not provide information
be-tween year 2 and year 8, the optimal time for
assess-ing the relation between progression of BPF and
disability remains unknown.
A second objective of this study was to
character-ize atrophy progression in patients with RRMS over
time. The retrospective analysis of images acquired
for the clinical trial in conjunction with the image
analysis for this follow-up study have allowed us to
observe atrophy progression in a relatively large
group of patients with RRMS over the course of 8
years. Previous studies have looked at atrophy over
shorter periods of time— up to 3 years. In our study,
the amount of atrophy over the interim period
(
⫺
2.0% over approximately 6 years) is lower than
the atrophy rate during the phase III trial
3,7and
lower than atrophy rates in several other serial MS
studies.
6,8,9,14-16In the placebo and treated groups
combined, there was a mean BPF change of
⫺
1.1%
over 2 years, or
⫺
0.55% per year during the original
trial. The estimated rate of atrophy during the
in-terim was only
⫺
0.33% per year. One possible
expla-nation for the apparent decrease in atrophy rate over
time may be related to natural history. It is
conceiv-able that the rate of atrophy may decrease over time
in MS,
4,14just as the frequency of enhancing lesions
decreases over time. A second explanation may be
the introduction of disease-modifying drugs that
have immediate effects on inflammation but delayed
effects on atrophy rate. BPF analysis of the phase III
trial showed that atrophy progressed at essentially
equal rates in the placebo and treated groups during
the first year of the trial, but progressed at a
signifi-cantly slower rate in the treated group in the second
year.
7Although this follow-up study did not
demon-strate a significant difference in treatment effect on
atrophy at the time of the 8-year follow-up, there was a
trend toward less atrophy in the original treated group
as compared with the original placebo group. The
find-ing that BPF was weakly correlated to age and disease
duration only at baseline and not at the 8-year
follow-up may also be related to treatment. At baseline
all patients were untreated, whereas by the follow-up
examination many of the patients had been treated
with disease-modifying drugs, which may have slowed
the rate of atrophy progression and therefore
de-coupled BPF and disease duration. Sustained
treat-ment effects are difficult to discern owing to the 6 years
of uncontrolled therapy in the interim period.
Statisti-cal modeling will be necessary to account for the
differ-ent treatmdiffer-ents during this period. These studies are in
progress.
It is also possible that the slower rate of atrophy
may be partly artifactual. Although care was taken
to acquire images with the same pulse sequence
pa-rameters and spatial resolution, scanner upgrades
are unavoidable and may have an effect on the
abso-lute numbers for BPF. There is no way to accurately
track acquisition-related changes that may effect the
calculation of long-term atrophy rates in this study
because of the 6-year time gap between the end of
the clinical trial and the follow-up examination.
However, the data indicate that if there is error due
to scanner drift and upgrades, it is mainly a
system-atic error because the 8-year follow-up BPF was
strongly correlated with baseline BPF. Furthermore,
estimated atrophy rates in individual patients were
consistent with what was qualitatively observed in
the images when compared over time. Therefore, we
do not believe technical limitations had a significant
effect on the results.
Another potential explanation is informative
cen-soring. That is, the patients who experienced the
greatest progression in atrophy were not included in
the calculation of long-term atrophy rate and
there-fore the mean decline was underestimated because of
the absence of these patients. There were seven
pa-tients who died; many of these papa-tients had
experi-enced significant disease progression in terms of
disability. There were also 12 people who could not
be located or who refused to participate, and they
may have contributed to differential effects on the
mean BPF change. Conversely, the overall
ascertain-ment rate (93%) was high for such a long-term study
and it is unlikely that the seven deaths fully explain
the shift in decline.
atro-phy. The exact pathologic mechanisms that
contrib-ute to atrophy in MS are unknown; however, it is
possible that some mechanisms can be inferred by
the relations between specific lesion types and
atro-phy. We anticipated that tissue damage evident as
lesions on MRI scans in the original trial would
be-come progressively worse over time and eventually
lead to brain atrophy. There were moderate
correla-tions between BPF and T2 lesions and between BPF
and T1-hypointense lesions concurrently, as in
previ-ous studies of cerebral volumes.
4,25There were no
correlations between gadolinium-enhancing lesions
and BPF; however, enhancing lesions, particularly at
year 2, were predictive of the change in BPF from
year 2 to the 8-year follow-up. The multiple
regres-sion analysis confirmed that the number of
enhanc-ing lesions and the volume of T2 lesions at year 2
were independent predictors of subsequent brain
at-rophy. Similar relations between MRI markers of
inflammation and atrophy have previously been
re-ported.
3,6,16The observed relations between different
types of lesions and BPF are consistent with the
interpretation of BPF as an indicator of all the
previ-ous severe and irreversible tissue damage that has
occurred up to a given point in time. To varying
degrees, T2 and T1 lesions also reflect previously
damaged tissue and, therefore, were expected to
cor-relate with concurrent BPF, subsequent BPF, and
change in BPF. In comparison to T2 and T1 lesions,
enhancing lesions are much more transient and only
reflect active inflammation at a single point in time.
The finding that enhancing lesions are related to
subsequent change in BPF is additional evidence for
a cascade of potentially irreversible tissue damage
that may follow inflammation and ultimately result
in atrophy.
3However, the multiple regression
analy-sis showed that lesion measurements (number of
en-hancing lesions and volume of T2 lesions) only
accounted for 27% of the variance in subsequent
at-rophy, suggesting that most of the pathology
contrib-uting to atrophy was not detected by conventional
lesion measurements at a single point in time.
The correlations between BPF, disability, and
dif-ferent types of lesions over the 8-year follow-up
study help to clarify the clinical and biological
rele-vance of brain atrophy in RRMS. The relation
be-tween brain atrophy and subsequent disability
status indicate that brain atrophy is an important
marker of tissue destruction in patients with RRMS.
Brain parenchymal fraction may be useful in
identi-fying patients with more aggressive disease.
Fur-thermore, this study suggests that brain atrophy
may be due in part to focal tissue damage evident as
MRI lesions at earlier points in time, but other
fac-tors contributing to atrophy remain undefined.
Addi-tional work is needed to determine optimal methods
for the use of atrophy measurements in combination
with clinical and MRI measures to monitor
individ-ual patients and the effects of new treatments.
Acknowledgment
The authors thank Christine Kassuba for editorial assistance.
References
1. Rao SM, Glatt S, Hammeke TA, et al. Chronic progressive multiple sclerosis. Relationship between cerebral ventricular size and neuropsychological impairment. Arch Neurol 1985; 42:678 – 682.
2. Filippi M, Mastronardo G, Rocca MA, et al. Quantitative volu-metric analysis of brain magnetic resonance imaging from patients with multiple sclerosis. J Neurol Sci 1998;158:148 – 153.
3. Simon JH, Jacobs LD, Campion MK, et al. A longitudinal study of brain atrophy in relapsing multiple sclerosis. Neurol-ogy 1999;53:139 –148.
4. Liu C, Edwards S, Gong Q, et al. Three dimensional MRI estimates of brain and spinal cord atrophy in multiple sclero-sis. J Neurol Neurosurg Psychiatry 1999;66:323–330. 5. Losseff NA, Webb SL, O’Riordan JI, et al. Spinal cord atrophy
and disability in multiple sclerosis. A new reproducible and sensitive MRI method with potential to monitor disease pro-gression. Brain 1996;119:701–708.
6. Losseff NA, Wang L, Lai HM, et al. Progressive cerebral atro-phy in multiple sclerosis. A serial MRI study. Brain 1996;119: 2009 –2019.
7. Rudick RA, Fisher E, Lee J-C, et al. Use of the brain paren-chymal fraction to measure whole brain atrophy in relapsing-remitting MS. Neurology 1999;53:1698 –1704.
8. Ge Y, Grossman RI, Udupa JK, et al. Brain atrophy in relapsing-remitting multiple sclerosis and secondary progres-sive multiple sclerosis: longitudinal quantitative analysis. Ra-diology 2000;214:665– 670.
9. Fox NC, Jenkins R, Leary SM, et al. Progressive cerebral atrophy in MS. A serial study using registered, volumetric MRI. Neurology 2000;54:807– 812.
10. Brex PA, Jenkins R, Fox NC, et al. Detection of ventricular enlargement in patients at the earliest clinical stage of MS. Neurology 2000;54:1689 –1691.
11. Paolillo A, Pozzilli C, Gasperini C, et al. Brain atrophy in relapsing-remitting multiple sclerosis: relationship with “black holes,” disease duration and clinical disability. J Neurol Sci 2000;174:85–91.
12. Goldszal AF, Davatzikos C, Pham DL, et al. An image-processing system for qualitative and quantitative volumetric analysis of brain images. J Comput Assist Tomogr 1998;22: 827– 837.
13. Kikinis R, Guttmann CRG, Metcalf D, et al. Quantitative follow-up of patients with multiple sclerosis using MRI: tech-nical aspects. J Magn Reson Imaging 1999;9:519 –530. 14. Redmond IT, Barbosa S, Blumhardt LD, Roberts N.
Short-term ventricular volume changes on serial MRI in multiple sclerosis. Acta Neurol Scand 2000;102:99 –105.
15. Hohol MJ, Guttmann CRG, Orav J, et al. Serial neuropsycho-logical assessment and magnetic resonance imaging analysis in multiple sclerosis. Arch Neurol 1997;54:1018 –1025. 16. Molyneux PD, Kappos L, Polman C, et al. The effect of
inter-feron beta-1b treatment on MRI measures of cerebral atrophy in secondary progressive multiple sclerosis. Brain 2000;123: 2256 –2263.
17. Rudick RA, Cutter G, Baier M, et al. Use of the Multiple Sclerosis Functional Composite to predict disability in relaps-ing MS. Neurology 2001;56:1324 –1330.
18. Fisher E, Rudick RA, Cutter G, et al. Relationship between brain atrophy and disability: an 8-year follow-up study of mul-tiple sclerosis patients. Mult Scler 2000;6:373–377.
19. Kurtzke JF. Rating neurologic impairment in multiple sclero-sis: an expanded disability status scale (EDSS). Neurology 1983;33:1444 –1452.
20. Jacobs LD, Cookfair DL, Rudick RA, et al. Intramuscular interferon beta-1a for disease progression in relapsing multi-ple sclerosis. Ann Neurol 1996;39:285–294.
22. Simon JH, Jacobs LD, Campion M, et al. Magnetic resonance studies of intramuscular interferon beta-1a for relapsing mul-tiple sclerosis. The Mulmul-tiple Sclerosis Collaborative Research Group. Ann Neurol 1998;43:79 – 87.
23. The Sickness Impact Profile User’s Manual and Interpreta-tion Guide. Baltimore: Johns Hopkins University Department of Health Policy and Management, 1996.
24. Fisher E, Cothren R, Tkach J, et al. Knowledge-based 3D segmentation of MR images for quantitative MS lesion track-ing. Proc SPIE Medical Imaging 1997;3034:19 –25.
25. Lycklama à Nijeholt GJ, van Walderveen MAA, Castelijns JA, et al. Brain and spinal cord abnormalities in multiple sclero-sis. Correlation between MRI parameters, clinical subtypes and symptoms. Brain 1998;121:687– 697.
Neuro
Images
Spinal schwannoma mimicking lower
limb SMA
D. Fischer, MD, A. Brunn, J. M. Schröder, J. Reul, R. Schröder, Bonn, Germany
A 60-year-old man presenting with a 30-year history of progressive, painless weakness and atrophy of the lower limb muscles requested new treatment options for pero-neal type of spinal muscular atrophy (SMA), which had been diagnosed 25 years previously at another institution. On examination, knee and ankle reflexes were absent, and
there were no signs of sensory or autonomic involvement. Motor and sensory nerve conduction studies were normal, but needle EMG showed “neurogenic” changes in lower limb muscles. MRI revealed an extramedullary, ventrolat-erally located mass lesion almost completely filling the spinal canal (figure, A) that histopathologically was diag-nosed as WHO grade I schwannoma (figure, B). This case illustrates that longstanding spinal schwannoma can be painless and can selectively affect motor fibers thereby presenting as lower limb SMA.1
1. Dyck PJ, Lambert EH. Lower motor and primary sensory neuron dis-eases with peroneal muscular atrophy. Neurologic, genetic, and electro-physiologic findings in various neuronal degenerations. Arch Neurol 1968;18:619 – 625.
Figure. (A) Representative T2-weighted MRI. There is a well demarcated lesion at the lower thoracic level compressing the spinal cord. A histopathological sec-tion of the tumor (B) showed fascicles of spindle cells with elongated nuclei and eosinophilic cytoplasm, which reacted strongly with S-100, consistent with a low-grade schwannoma.