*
Development of a Setup for Material Identification Based on
Laser-Driven Neutron Resonance Spectroscopy
Marc Zimmer1*, Stefan Scheuren1, Annika Kleinschmidt2,3, Alexandra Tebartz1, Tina Ebert1, Johannes Ding1, Daniel
Hartnagel1, and Markus Roth1
1Technische Universität Darmstadt, Institut für Kernphysik, 64289 Darmstadt, Germany 2GSI Helmholtzzentrum für Schwerionenforschung, 64291 Darmstadt, Germany 3Helmholtzinstitut Jena, 07743 Jena, Germany
Abstract. With the phasing out of many research reactors over the upcoming years, a shortcoming of small and medium sized neutron sources is to be expected. Laser-driven neutron sources have the potential to fill this void, with enormous progress being made in laser technology over the past years. Upcoming petawatt lasers with high repetition rates up to 10 Hz promise a tremendous increase in neutron flux. In this paper, a setup is developed and optimized to conduct neutron resonance spectroscopy at a laser-driven neutron source. This setup is then evaluated at an experimental campaign at the PHELIX laser system. Laser intensities up to 1021 W/cm² with a ns pre-pulse contrast of 10-7 were used for ion acceleration, resulting in (1.8±0.7)×108 N/sr
per pulse corresponding to (2.3±1.0)×109 N in a 4 equivalent. These pulses were moderated, collimated and
investigated via the time of flight method in order to characterize the thermal neutron spectrum as well as the signal to noise ratio.
1 Introduction
Neutrons provide a unique tool for material analysis, from neutron diffraction [1] over prompt gamma neutron
activation analysis [2] to Neutron Resonance
Spectroscopy (NRS) [3]. These techniques can be used to
identify the elemental and isotopic compositions of unknown materials without compromising the structural integrity of the sample. A key feature of neutrons is the large propagation range into materials. In combination with the unique distribution of scatter and capture resonances for every isotope, neutrons provide a particularly valuable analysis tool, complementing currently existing x-ray techniques.
In previous years, neutrons were in many cases provided by research reactors. With recent developments, a large fraction of these sources have been or will be shut down in the near future and a need for small and medium-sized
neutron sources is growing [4]. Laser-Driven Neutron
Sources (LDNS) promise to fulfill these needs and
provide a compact short pulsed neutron source with high peak flux [5]. Recent improvements in laser technology
enable high-intensity lasers to be operated up to 10 Hz [6],
therefore, tremendously increasing the average neutron flux of these sources.
LDNS are especially well suited for material analysis
utilizing NRS since it relies on the Time of Flight (ToF)
method which requires short initial pulse durations to
decrease the energy uncertainty. LDNS have sub-ns production pulse lengths and consequently the dominant energy uncertainty is the moderation time which is below 2 µs for neutrons above 1 eV. Other Compact Accelerator Driven Neutron Sources (CANS) or reactors have longer
pulse lengths above 100 µs [7] and therefore require
longer flight paths to maintain the same energy uncertainty [3].
Spallation sources can operate similarly to LDNS in a regime only limited by the moderation time but they need longer flight paths due to the larger shielding required for higher neutron energies from the spallation process [8].
A longer flight path L results in a reduction in neutron flux
at the detector since the flux decreases with 1/L². This
enables a more efficient utilization of the neutron beam in comparison to most other sources, except those based on electron linacs which can reach similar short pulse lengths and neutron energies.
NRS exploits the unique resonance distribution for most
isotopes in their neutron cross section (E). Therefore,
2 Setup
For this experiment, the PHELIX laser at GSI was used. The (600±100) fs laser pulse [9] was focused to a FWHM diameter of (4±0.5) µm with (180±12) J per pulse. This
setup allows peak intensities of up to
1021 W/cm² enabling ion acceleration via the Target
Normal Sheath Acceleration (TNSA) [10] and via relativistic induced transparency that can commonly deliver ion energies between 60 and 85 MeV [11]. During
this campaign, the ns laser contrast was reduced to 10-7
and consequently, maximum ion energies were limited to around (33±10) MeV. As target material, deuterated polystyrene foils with 500 nm thickness as well as 10, 25 and 50 µm silicon targets were used. Some of them with a micro-needle structure on the laser facing surface and a flat rear side for better conversion efficiency.
The neutron production is carried out using a pitcher-catcher design [5] where ions are directed from the target (pitcher) onto a beryllium cylinder (catcher). There, the
ions are converted into neutrons via 9Be(d,n)10B,
9Be(p,n)9B as well as stripping reactions. Emitted
neutrons have energies in the MeV regime, but for most NRS applications, neutrons in the epithermal (~1 to 100’s of eV) regime are required. Therefore, the neutrons are
directed into a moderator made out of High Density
PolyEthylene (HDPE). The high hydrogen content slows
neutrons down until they are emitted via diffusion at the moderator surface and propagate towards the detector.
To ensure only neutrons with a direct flight path from the moderator to the detector are counted, a series of borated HDPE plates are installed. These plates have an opening in the center with a converging diameter towards a
borated Multi-Channel Plate (MCP) detector to act as a
collimator as seen in Fig. 1.
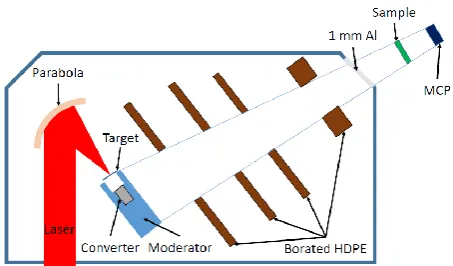
Fig. 1. Setup of the experiment. Neutrons are produced inside the converter, slowed down in the moderator and are emitted to the MCP via the flight path indicate by the light-blue lines.
The sample is placed at 10 cm distance in front of a MCP that is capable of single neutron detection. In this configuration, absorption gamma photons produced inside the sample have a smaller chance of reaching the detector in comparison to placing the sample directly in front of the detector.
The MCP itself is placed at a distance of (180±1) cm and is additionally shielded with 10 cm borated HDPE in all other directions which is not shown in Fig. 1 to improve clarity. The detector used in this experiment is a custom made design, consisting of a borated MCP from Nova Scientific encapsulated in a vacuum housing by the ProxiVision GmbH with a spatially integrated anode for a faster time response. This detector is capable of single neutron detection with a maximal time resolution of 10 ns. The neutron energy was calculated via ToF. The neutron flight time t was determined by:
t = td – t0 – tc– ts (1)
With the detection time td, the arrival time of the gamma
flash t0, the time delay of light to propagate from the target
to the detector tc = 6 ns and the average delay neutrons of
a certain energy need to cross the surface of the moderator
ts.
3 Design and Simulations
3.1 Catcher
During the operation of an LDNS, the beryllium catcher has to be shielded against ablation by the expanding hot laser plasma, since beryllium dust is highly toxic and the integrity of the catcher has to be maintained. Therefore, a blast shield in front of the beryllium is required. In previous experiments [12], a 1 mm Al plate was used. Inside this blast shield deuterons with an energy below 18 MeV are stopped and do not reach the converter. Al itself has a low neutron yield and consequently, a large amount of ions does not contribute to the neutron production. Hence a material with low stopping power, high thermal and ablation resistivity, as well as relatively high neutron yield from deuteron bombardment should be chosen as a blast shield. Cirlex consists of a polyimide material with a high thermal resistivity and has a high carbon content which has a relatively high (d,n) cross section of 200 mb between 2 and 10 MeV [13]. It is comprised of only low Z materials, resulting in a low stopping power thus more deuterons (> 14 MeV) arrive at the catcher. Therefore, it fulfills the requirements as laser-plasma blast shield. In addition, the reaction products of d/p irradiation produce
mostly short-lived radioactive isotopes like 13N with a
half-life of 10 minutes, 11C with 20 minutes and stable
14N. This reduces the radiation inside the chamber and
enables fast target handling.
3.2 Moderator
Designing a moderator for an epithermal neutron source is fundamentally different from thermal or cold neutron sources. While these sources use reflectors to keep neutrons inside the moderator as long as possible until
they diffuse out at the surface [8], an epithermal source
achieved when an optimal thickness is found, where the average scattering number at the surface is corresponding
to the desired energy for NRS. To find an optimal
moderator configuration, a PHITS [14] simulation was used to scan the length height and width of the moderator while measuring the epithermal neutron flux at a distance of 50 cm to the moderator center. The neutron spectrum was produced by directing a TNSA ion spectrum with up to 32 MeV protons on to a beryllium catcher. Fig. 2 shows the results for the length and the height. It can be seen, that for both cases a saturation effect starts to appear for values larger than 10 cm. The preferred dimensions of this cuboid moderator were chosen to be at a length of 17 cm and a height of 10 cm towards the center.
Fig. 2. Epithermal neutron flux as a function of moderator length and height. For both parameters a saturation effect is visible. Simulation performed with the PHITS code.
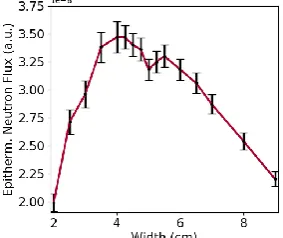
Fig. 3 shows the increase in epi-thermal flux as a function of moderator width. The flux increases with the thickness until a maximum of 4 cm towards the moderator center is reached. Afterwards the flux decreases until a width of 5 cm where the flux increases again until it reaches a second maximum at 5.5 cm. Further increasing the width causes the flux to decrease. The second peak is associated with neutrons that have an initial propagation direction towards the moderator surface as these neutrons pass through less material as those emitted in other directions.
Fig. 3. Epithermal neutron flux as a function of moderator width. First, the flux is increasing with the moderator width until it reaches a maximum at 4 cm. Afterwards, the flux decreases until 5 cm where it starts increasing again. At 5.5 cm a second maximum is visible followed by a constant decrease in neutron flux. Simulation performed with the PHITS code.
Fig. 4. Optimized moderator design for NRS. The dark circle in the middle represents the Be catcher. In the front the wings are visible.
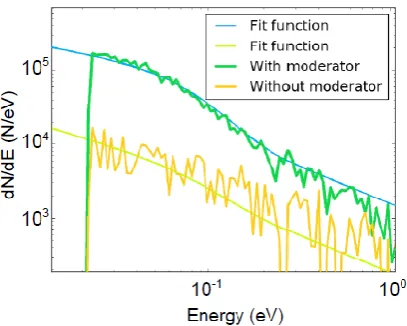
In addition, two 3x3x20 cm wings were added in front of the moderator as seen in Fig. 4. These wings have a chance to capture neutrons that are emitted into laser backwards direction up to an angle of 56° measured from the converter front surface center. PHITS simulations have shown, that this can lead to an increase in epithermal neutron flux at the detector facing moderator side of 72% and an increase of thermal flux of 46% as seen in Fig. 5. The presence of the wings leads to a new optimal moderator thickness of 5 cm. Fig. 4 shows a CAD drawing of the optimized moderator design.
Fig. 5. PHITS simulation for the moderator with and without moderation wings. The epithermal yield is increased by 72% as well as the thermal yield by 46%
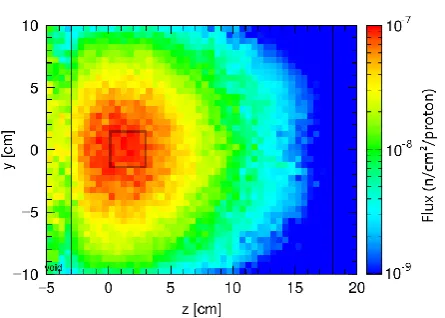
Fig. 6. Flux of neutrons with energies between 1 and 10 eV at the moderator surface. Most neutrons are emitted close to the catcher, indicated by the black square.
The energy resolution of an NRS measurement and, therefore, the minimal detector distance is limited by the
uncertainty of the arrival time t. There are two main
contributing factors to this uncertainty for an LDNS. The first one is the moderation time, e.g. the time a neutron propagates inside the moderator until it reaches its final energy. The second one is the time after the last collision until the neutron reaches the moderator surface. The sum of these two factors is estimated in a PHITS simulation for this moderator design for various energies from 1 eV to 1 keV. The results can be seen in Fig. 7. It is visible that for higher energies the average arrival time shifts to earlier times. Also, the width of each pulse is decreasing with higher energies. The average arrival time can be treated as an offset in the energy determination, while the width of each peak represents the uncertainty for each
energy ts(E). For 1 eV this width is (2±0.5) µs, for 100
eV (200±50) ns and for 1 keV this width has decreased to (60±10) ns. If this is compared to the minimal ion pulse width at the LANSCE spallation source of 125 ns [8] convoluted with their moderation time, it becomes evident that an LDNS has the potential to achieve a higher energy resolution for neutron energies above 100 eV.
Fig. 7. Time needed for neutrons with different energies to cross the moderator surface. Faster neutrons leave the moderator quicker and have a lower moderation time uncertainty. Energy intervals are ±1%.
3.3 Collimation System
For NRS, it is crucial that neutrons detected at the MCP have traveled in a straight line from the moderator through the sample. Therefore, neutrons have to be prevented from scattering at other parts of the experimental setup, the 3 cm thick steel target chamber wall, the floor or the ceiling. Therefore, three 5 cm thick and 50 cm wide borated HDPE sheets were placed in the beam path with an inner recess fitting the converging projection of the moderator
onto the MCP as seen in
Fig. 1 and 8. In addition to the three large collimators, four smaller collimators with converging round openings to the detector were used. Two of them before the 1 mm aluminium flange inside the target chamber and two additional collimators directly in front of the detector. This geometry enables to view the entire moderator from the detector to increase the amount of usable neutrons. The increase in energy uncertainty for this setup from the larger visible surface area is below 1% (at 4 eV). This is
smaller than the corresponding uncertainty from ts with
3%.
The detector itself was surrounded by a 1 mm copper Faraday cage against the EMP and additional 10 cm borated HDPE in all other directions. The setup was reconstructed in a PHITS simulation to evaluate the collimation and the signal to noise ratio. The result can be seen in Fig. 8 for neutrons with energies between 1 and 10 eV. The collimator achieves, in this simulation, a signal
to background ratio of (15±4):1 inside the detector
shielding. An analysis of the arrival time and the energy of the neutrons revealed the origin of the background neutrons to be from fast neutrons that have been moderated in the last borated HDPE layer. Additional contributions to the background have been identified to come from the prompt gamma emission from neutron absorption in boron, hydrogen and carbon. This background can be significantly reduced in future experiments by adding additional steel collimation layers directly in front of the last HDPE layers and a cadmium layer around the detector can be used to filter out thermal neutrons. In addition, a lead shielding around the detector can reduce the gamma contribution.
4 Experimental Results
4.1 Determination of the Signal to Background Ratio
In the experimental campaign at PHELIX, two methods were used to determine the signal to noise ratio. For the first method, the thermal neutron spectrum is compared with and without a moderator. The result can be seen in Fig. 9. The ratio between these shots is (16±1):1 for thermal neutrons and (6±1):1 for epi-thermal neutrons at 1 eV. The lower ratio for faster neutrons is linked to the contribution of thermalized background neutrons which are generated in the shielding and their arrival time coincides with epi-thermal neutrons from the moderator.
Fig. 9. Measurement of a thermal neutron distribution of a laser-based NRS campaign at PHELIX. Orange lines represent data taken without a moderator and green lines are single shot spectra with the moderator in place.
The second method used is the introduction of a black
resonance filter in the beam path. 113Cd has a giant
resonance below 1 eV with cross sections above 104 b
and is consequently opaque for thermal neutrons. A 1 mm thick cadmium plate is, therefore, placed in front of the entrance of the last collimator tunnel to block the direct line of sight to the moderator. The result can be seen in Fig. 10 together with the cadmium cross section in red and a shot without the Cd filter, indicated by the blue line. The ratio between these two shots at 25 meV is (17±1):1 which is in good agreement to the first method with (16±1):1 as well as with the simulated result of (15±4):1.
Fig. 10. Blue line: Moderated neutron spectrum without a sample. Pink line: Neutron spectrum with a 1 mm thick Cd sample in the beam path as black resonance filter. Red dashed line: The cross section of 113Cd. With increasing Cd cross
section, the blue and red curve start to deviate until cadmium is opaque and all contributions in the pink graph are from the background.
4.2 Characterization of the Moderated Neutron Spectrum
The moderated neutron spectrum consists of two parts. The first one is a Maxwellian distribution of thermalized neutrons with the temperature of the moderator. The second part is the result of stochastical collisions and
energy transfer and it follows a 1/Eb distribution where E
is the neutron kinetic energy and b is the leakage factor. b
describes how many neutrons are either leaked out of the moderator or have been absorbed during the moderation process. An infinite moderator without absorption would
have b = 1. In Fig. 11 the moderated neutron spectrum is
compared to a simulated neutron spectrum.
Fig. 11. Normalized experimental neutron spectrum (green) with a Maxwellian fit (blue) and A/Eb in red. The important fit parameters are T = 291 K and b = 1.4. The black line represents the corresponding FLUKA simulation with T = 289 K and b = 0.92.
For the experimental data, a Maxwellian distribution can
be fitted to the thermal peak with a temperature T =
(291±15) K = (18±15)°C. This temperature is close to the room temperature of the PHELIX laser bay with 20°C.
to a value of 1.4. This is not realistic since b ≤ 1 has to be fulfilled for every moderator [15]. A FLUKA [16] simulation with a matched ion source spectrum for this
experiment produces a leakage coefficient of b = 0.92.
This discrepancy suggests that the used detector is less
sensitive for fast neutrons than the 1/E0.5 scaling of the
boron cross section would suggest. This is most likely caused by an oversaturation of the MCP during the -flash from the laser target interaction. For future applications, it is therefore advisable, to shield the direct line of sight between target and diagnostic with a high Z material.
5. Conclusion
The proposed laser neutron setup was developed and optimized to identify materials through the detection of nuclear resonances via NRS. The optimization was done with PHITS simulations for a setup at the PHELIX laser facility in Darmstadt. The setup was characterized with simulations and validated with an experiment, which was in agreement with the predictions. The catcher shielding, the moderator as well as the collimation system show large improvements to previous laser-driven neutron spectroscopy experiments and can be used to demonstrate the capability to detect various isotopes inside a sample.
6. Acknowledgement
The authors want to especially thank the PHELIX laser team at GSI for their work on the realization of this experimental campaign as well as the GSI Plasma Physics Department. This work is supported by the LOEWE excellence initiative of the state of Hessen.
7. References
1. R. Nelson, O. Ronald, et al. Journal of Imaging 4.2 : 45 (2018)
2. Z. Révay, et al., Handbook of nuclear chemistry: 1619 (2011)
3. P. Schillebeeckx, et al., Springer, I/24. 10-66. (2015) 4. Nuclear research and industry today. Nat Rev Phys 1,
171 (2019)
5. M. Roth, et al., Phys. rev. lett. 110.4 044802 (2013) 6. B. Rus, et al., Vol. 8780. International Society for
Optics and Photonics (2013)
7. E. Mauerhofer, et al., No. FZJ-2017-07855. Streumethoden, (2017)
8. S. F. Nowicki, et al., Physics Procedia 90: 374-380 (2017)
9. V. Bagnoud, et al., App. Phys. B 100.1 137-150 (2010)
10. R. A. Snavely, et al., PRL, 85.14: 2945. (2000) 11. F. Wagner, et al., Phys. rev. let. 116. 20 (2016) 12. A. Kleinschmidt, et al. PoP. 25.5 053101 (2018)
13. A. J. Koning, et al., Nuc. data sheets 113.12: 2841-2934 (2012)
14. P. Tsai, et al., Nuc. Inst. and Meth. in Phys. 416: 16-29. (2018)
15. I. Petrovic, P. Benoist, Adv. in Nuc. Sci. and Tec. Springer, Boston, MA, (2002)