Article
Car Tourism in China: The Mediation Effect of
Perceived Value and Tourist Satisfaction on the
Relationship between Destination Image and Loyalty
Bin Wang 1,2, Zhaoping Yang 1,*, Fang Han 1 and Hui Shi 1
1 Xinjiang Institute of Ecology and Geography, Chinese Academy of Sciences, Urumqi 830011, China
2 University of Chinese Academy of Sciences, Beijing 100049, China
wangbin2014@mails.ucas.ac.cn (B.W.); hanfang@ms.xjb.ac.cn (F.H.); shihui@ms.xjb.ac.cn (H.S.)
* Correspondence: yangzp@ms.xjb.ac.cn (Y.Z.); Tel.: +86-991-788-5472
Abstract: This study aims to test a model linking destination image, perceived value, tourist satisfaction, and tourist loyalty. Based on a sample of 300 tourists travelling by car from the World Natural Heritage Site of Tianchi, China, a new model of destination image was explored and data were analysed using partial least squares structural equation modelling (PLS-SEM). The results show that perceived value and satisfaction are direct antecedents of destination loyalty. Above all, perceived value and tourist satisfaction mediate the relationship between destination image and loyalty. Finally, this study discusses the theoretical and management implications of the findings in order to boost the tourism industry in the context of car trips.
Keywords: road trip; destination image; perceived value; tourist satisfaction; destination loyalty; China
1. Introduction
Automobiles create recreational and leisure opportunities [1]. Owning a car plays a significant role in daily lives [2]. In China, car tourism has increased with society development and has become a key driver of the country’s economic development. The number of tourists travelling by car has reached 2.35 billion, accounting for 58.5% of all domestic tourists in China in 2015. Furthermore, tourists travelling by car are the largest tourist group within the background of the sustainable growth of China’s tourism industry, according to China's Driving Tourism Development: Analysis and Forecast (2015–2016).
Xinjiang, the western province of China, is equivalent to one-sixth of the total area of the country. Xinjiang is close to Europe, at the heart of the Silk Roads, the Routes Network of the Chang’an-Tianshan Corridor. The area has abundant natural resources (snow mountains, forests, deserts, and meadows) and cultural attractions (ruins, beacon towers, ancient graves) [3]. For example, Tianshan was listed on the World Nature Heritage Site List by the United Nations Educational, Scientific, and Cultural Organization (UNESCO), World Heritage Centre, in 2013 [4], because of its spectacular snow-capped mountains and glacier-capped peaks, beautiful forests and meadows, clear river and lakes, and grand red bed canyons. This confirms that the region possesses vast land resources, a crucial location, and unique tourist resources in the world. As a result, car tourism has become highly developed in this area.
Current research on car tourism has discussed the concept and classification, the behavioural characteristics of tourists, travel route characteristics, impacts and management of the phenomenon, and tourist satisfaction.
Many studies focus on the relationship among destination image, perceived value, tourist satisfaction, and tourist loyalty from different perspectives [5, 6]. However, few studies explain these relationships from the perspective of car tourism.
A road trip is an organic combination of tourist and vehicle. Owing to the features of road trips, when tourists enjoy the scenery, they pay increased attention to the vehicle, such as refuelling, parking, and maintenance. In addition, tourists focus on the distance to destinations and the length and rigorousness of the trip. After considering these factors, tourists make a final decision on their trip. As such, the results of their decisions may be different to those of others.
Therefore, to fill the gap in the existing literature, this study focuses on the relationship among destination image, perceived value, tourist satisfaction, and tourist loyalty in the context of car tourism. In addition, the mediation effects of perceived value and satisfaction on the relationship between destination image and tourist loyalty are tested by targeting tourists travelling by car.
1.1 Destination image
Destination image can be defined as the series of impressions or perceptions of a tourist destination. It is a significant concept that plays an important role in a tourist’s decisions. Previous studies have shown that destination image has been a significant topic in the field of travel studies, and scholars have tried to develop a conceptual framework for it using different methods. According to Echtner and Ritchie, destination image is composed of attribute and holistic aspects [7]. For example, Gallarza and Saura evaluated destination image based on cognitive and affective aspects [8]. However, there is no agreement on the conception of destination image.
Sanz, Blas, and Carvajal-Trujillo showed that destination image is estimated along four dimensions: tourist resources, urban environment, infrastructure and atmosphere of the city, and socioeconomic environment [9]. In addition, Toudert and Bringas-Rábago used three dimensions: tourism resources, urban environment, and infrastructure and atmosphere [10]. According to the tourism system model, the transport system is an important component in the functional tourism system model. Accessibility has a great influence on the tourism industry. This study suggests that the main elements considered by tourists travelling by car include tourist resources, accessibility, infrastructure, and travel environment [11].
As universally acknowledged, subjective perception, tourist experience, and destination familiarity are affected by destination image. In turn, destination image affects tourists in the process of choosing a destination, in their subsequent evaluation, and future visit intentions. Destination image also has a significant impact on perceived value, tourist satisfaction, and tourist loyalty [12].
Firstly, the majority of existing empirical studies have reported a relationship between destination image and perceived value [13–15]. For example, Jin, Hyuckgi, and Lee found that destination image determines tourists’ perceived value [13]. Aliman et al. found that tourist expectations, perceived quality, and destination image have positive significant relationships with perceived value, based on a regression analysis [14]. Therefore, destination image is vital to the value of tourists’ perceptions.
Secondly, destination image has been demonstrated to be an important variable in tourists’ evaluations of their travel experience [10, 16] and has an impact on tourist satisfaction [17, 18]. With respect to the outcomes of Aliman et al., perceived value was demonstrated to have a positive significant relationship with tourist satisfaction [14].
future intentions to return [23]. Thus, the image of the destination is a key component in evaluating loyalty.
1.2 Perceived value
Perceived value is described as the overall assessment made by tourists based on their comparison between the utility or benefits and the perceived costs or sacrifices associated with a destination. From the utilitarian perspective, value scales embody both monetary costs [24] and non-monetary costs (such as effort or time) [25]. Duman and Mattila found that perceived quality and monetary value are two main antecedents of perceived value [26]. Chen and Tsai measured perceived value using a three-item scale (money, time, and effort) [22]. Clemes and Brush used a single item for perceived value [27]. Sun and Chi proposed a two-item scale for perceived value, including functional value and overall value [11].
Previous research has examined the relationships among perceived value, satisfaction, and loyalty. Firstly, perceived value has been found to be a significant predictor of tourist satisfaction and behaviour intentions [28–30]. With regard to the results of McDougall and Levesque, core service quality and perceived value were the most important drivers of customer satisfaction [29]. Woodruff and Robert found that measures of received value are antecedents to overall customer satisfaction [30].
Secondly, perceived value is significant to destination loyalty. Some researchers have shown that perceived value influences loyalty, both directly and indirectly [31, 32]. It is widely accepted that perceived value is vital to promoting long-term relationships with tourists. For example, Ilban, Kasli, and Bezirgan found that perceived value had a positive effect on the likelihood of revisiting and suggesting the destination to others [33]. In addition, Jin, Hyuckgi, and Lee found that an event’s quality and its perceived value have a significant influence on behavioural intentions [13]. Therefore, perceived value is an important antecedent to loyalty.
In summary, the results of these studies lead to a convergence of opinion that perceived value is an important antecedent to satisfaction and loyalty.
1.3 Satisfaction
Satisfaction is defined as an overall judgement on products and services in a destination, and it is one of the most significant concepts of modern marketing competitiveness. Tourist satisfaction has been extensively researched in the tourism field [34]. There is a widely held belief that tourists’ satisfaction has a crucial influence on their loyalty and future behavioural intentions [35]. For example, satisfied tourists may give positive feedback about the destination, recommend it to relatives and friends, and revisit the same destination in the future. In contrast, dissatisfied tourists may not recommend the destination to others, and may not return. In addition, dissatisfied tourists may demolish the brand image of a destination, so that its market suffers an adverse impact [36].
In contrast to past studies that included a single item, namely ‘overall satisfaction’, to analyse the links described above [24], more recent research uses a combination of items [37]. To attempt to find the effects of different factors on tourist satisfaction, ‘overall satisfaction’, ‘expectancy satisfaction’, and ‘right decision’ are selected as the factors measuring satisfaction in this study.
Satisfaction is one of the most significant factors affecting tourists’ loyalty to a destination. Therefore, a high level of tourist satisfaction is a core issue of tourism enterprises and administrations [38, 39]. The majority of previous studies have demonstrated the positive effect of satisfaction on destination loyalty. Thus, it is widely accepted that tourist satisfaction is an important antecedent to destination loyalty [6, 15, 40, 41]. However, to the best of our knowledge, no studies have examined the relationship between satisfaction and loyalty in the context of car tourism in China.
Loyalty is described as a key element to success in marketing and in tourism. Oliver defined loyalty as the highest level of commitment [42]. In the most recent literature, scholars proposed that loyalty is more complex, and may include both attitudinal and behavioural loyalty [43].
In the literature on marketing and tourism, tourist loyalty is fully interchangeable with behavioural intentions. Loyalty, or behavioural intention, has been measured by positive word-of-mouth, recommendation to others, and purchase or revisit intention [44].
Therefore, more recent studies focus on the antecedents of loyalty, such as image, value, quality, trust, and satisfaction. For the theoretical framework in this study, three antecedents are chosen as crucial factors, namely destination image, perceived value, and tourist satisfaction. Initially, as mentioned above, destination image influences perceived value, satisfaction, and loyalty. Perceived value affects tourist satisfaction and destination loyalty, and tourist satisfaction is significant to loyalty. Additionally, according to practical experience, building long-term relationships with tourists has become an indispensable part of business today. Loyal tourists are seen as a significant asset of a business. Furthermore, the tourism industry should focus on the core components. Hence, destination image (infrastructure, attractions, environment, and accessibility), perceived value, and satisfaction are the most important elements to tourists’ intentions to revisit or recommend a destination [17, 45], as well as influencing tourists’ loyalty.
1.5 Mediating effects of perceived value and satisfaction
Previous research argues that a direct or indirect relationship exists between destination image and loyalty. Some researchers report that perceived value and satisfaction are likely to affect loyalty as mediators. According to the study of Clavijolopez, perceived value is a mediator between destination image and behavioural intentions, for visitors and non-visitors [46]. Jhandir examines the effect of the mediating variable (perceived value) on customer satisfaction using a stepwise regression analysis [47]. Shafiq and Rashid measure the mediating effect of customers’ perceived value between three independent variables and purchase intention [48]. Heung and Ngai find that perceived value and customer satisfaction have mediating effects in the relationship between value-related benefits and loyalty in the context of Chinese restaurants [49].
However, this relationship has rarely been examined in the context of car tourism. In mediation concepts, we assume that destination image is a vital element affecting perceived value and (or) satisfaction, which, in turn, is likely to affect destination loyalty. For example, Song, Xin, and Li find that the mediating effects in their proposed multiple mediation model are substantiated, and five paths were tested among destination image, perceived value, satisfaction, and loyalty, controlling for the mediating variables [50].
According to this theoretical framework, the following hypotheses are proposed in the context of car tourism:
H1: The destination image is positively associated with perceived value; H2: The destination image is positively associated with tourist satisfaction; H3: The destination image is positively associated with loyalty;
H4: Perceived value is positively associated with tourist satisfaction; H5: Perceived value is positively associated with loyalty;
H6: Tourist satisfaction is positively associated with loyalty;
Figure 1. Conceptual model and research hypotheses
2. Materials and methods
2.1 Questionnaire design
A self-administered questionnaire survey was designed to collect empirical data on car tourism (See Table 1). The questionnaire was pre-tested by 89 respondents, and revised to ensure content validity. In addition, several irrelevant or ambiguous items were removed to ensure clarity. The questionnaire consists of five parts. Part 1 measures the destination image (20 items). Part 2 assesses perceived value (two items). Part 3 measures customer satisfaction (three items). Part 4 measures tourist loyalty (three items). The first four parts are measured on a five-point Likert scale: 1 (strongly disagree) to 5 (strongly agree). Finally, Part 5 collects respondent information, with the six items of gender, age, monthly income, education level, place of origin, and marital status.
Table 1. Constructs, items, labels, and sources
Constructs Items & Labels Sources
Destination image (DEI)
[10, 32]
Infrastructure (INF) Convenient wireless network (INF1)
Good mobile phone communication (INF2)
Excellent travel websites (INF3)
Tidy restrooms (INF4)
High-class information centres (INF5)
Standardized servicing stations (INF6)
Wide variety of shop facilities (INF7)
Wide choice of accommodation (INF8)
Variety of entertainment (INF9)
Environment (ENV) Orderly administration (ENV1)
Good service (ENV2)
Clean and unpolluted environment (ENV3)
Tranquil and restful atmosphere (ENV4)
Accessibility (ACC) Moderate traffic flow (ACC1)
Spacious freeways (ACC2)
Ample parking spaces (ACC4)
Attractions (ATT) Unique ethnic culture (ATT1)
Fabulous scenic drive (ATT2)
Historic landmarks and sites (ATT3)
Perceived Value (PEV) Value for time (PEV1)
[6, 25] Value for money (PEV2)
Satisfaction (SAT) Overall satisfaction (SAT1)
[11, 51] Expectancy satisfaction (SAT2)
Right decision (SAT3)
Loyalty (LOY) Positive comments (LOY1)
[37, 52] Recommendations (LOY2)
Revisit intention (LOY3)
2.2 Data collection
Through the pre-survey and the revision of the questionnaire, an investigation group was established. Data were collected from Tianchi, Xinjiang Tianshan, a World Natural Heritage Site in China, during every weekend in May and June in 2016. The locations were selected as the parking lots in Tianchi. Tourists were asked whether they were willing to fill in a questionnaire. In all, 342 questionnaires were collected, although some had to be rejected because they were incomplete or were missing crucial data. Finally, data from 300 respondents were tested with the proposed model, with an effective rate of 87.7%.
2.3 Data analysis
Descriptive statistics, including frequencies and distributions, were used to represent the demographic profile of the respondents. An exploratory factor analysis (EFA) with a varimax rotation was performed using SPSS 19.0 to establish the underlying dimensions of the destination image. The structural models were analysed using the partial least squares structural equation modelling (PLS-SEM) method, rather than using the covariance-based structural equation model (CB-SEM), because PLS-SEM runs computations more efficiently and faster than does the CB-SEM [53]. Both the measurement and structural models were tested using SmartPLS 3.0.
3. Results
3.1 Descriptive analysis
The respondents’ profile shows an equal distribution in terms of gender: male (49.7%) and female (50.3%). There were two dominant age groups: between 31 and 50 years (51.3%) and 30 years or younger (46%). Nearly half the respondents (47.0%) had a monthly income between 3001 and 6000 Chinese yuan (CNY), and approximately one-third of the respondents (31.3%) had a monthly income of less than 3000 CNY. With the exception of 4.7% of the respondents, almost everybody in the sample held a high school degree, or higher qualification. The majority of tourists were concentrated within the Xinjiang Province (68.7%). Lastly, more than half the respondents were married (60.3%) (See Table 2).
Table 2. Demographic profile of respondents (n = 300)
Items Frequency Percentage (%)
Gender
Female 151 50.3
Age
Under 31 138 46.0
31–40 73 24.3
41–50 81 27.0
Over 50 8 2.7
Income (Monthly)
Under CNY 3001 94 31.3
CNY 3001–6000 141 47.0
CNY 6001–9000 42 14.0
CNY 9001 or over 23 7.7
Education
Middle school or below 14 4.7
High school 87 29.0
Undergraduate 142 47.3
Postgraduate 57 19.0
Province
Within the province 206 68.7
Outside the province 94 31.3
Marital status
Single 119 39.7
Married 181 60.3
3.2 Exploratory factor analysis
To explore the underlying dimensions of destination image, an exploratory factor analysis (EFA) was conducted using SPSS 19.0 for Microsoft Windows. Four factors, with a cut-off factor loading of 0.5 and an eigenvalue greater than one, explained 67.173% of the variance of the destination image scale in a principal components factor analysis with a varimax rotation. The Cronbach's alpha was above the threshold value of 0.7, confirming the high reliability of the results [53]. Table 3 presents the four factors, namely infrastructure, environment, accessibility, and attractions.
Table 3. EFA results on destination image
Factor/ Item Factor Loading Variance
Explained (%) Eigenvalue
Cronbach's
Alpha
Factor 1: Infrastructure (INF) 49.762 9.952 0.928
INF1 0.824
INF2 0.790
INF3 0.714
INF5 0.641
INF6 0.610
INF7 0.549
INF8 0.548
INF9 0.515
Factor 2: Environment (ENV) 6.733 1.347 0.836
ENV1 0.776
ENV2 0.742
ENV3 0.727
ENV4 0.607
Factor 3: Accessibility (ACC) 5.524 1.105 0.820
ACC1 0.770
ACC2 0.748
ACC3 0.699
ACC4 0.559
Factor 4: Attractions (ATT) 5.154 1.031 0.724
ATT1 0.815
ATT2 0.721
ATT3 0.575
Note: Total explained variance = 67.173%; KMO = 0.945.
3.3 Measurement model
To estimate the constructs, the reliability and construct validity of the conceptual model were tested using PLS. The internal consistency was examined using the composite reliability (CR), which recommends that the value should be above 0.70 [54]. All CRs of the measurement models ranged from 0.844 to 0.951. Convergent and discriminant validities were utilized to examine the construct validity [55]. Convergent validity requires a factor loading of at least 0.50 and an average variance extracted (AVE) above 0.50 [54], implying that more than half the average variance of the indicators of a latent variable are explained. All factor loadings of the items were larger than 0.50, and the AVE of the destination image was 0.498, close to 0.50, which was considered acceptable [52]. Table 4 reports the factor loadings, t-values, AVE, and CR, and indicates the appropriate internal consistency.
Discriminant validity was essentially estimated by testing the correlations among the measures of potentially overlapping constructs. The square root of the AVE of a construct needs to be higher than the variance shared between the construct and other constructs [53]. Table 5 shows all the correlations and square roots of the AVEs. The results indicate adequate discriminant validity.
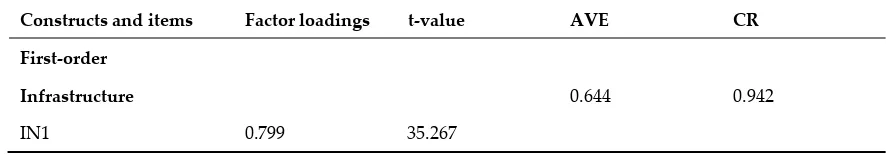
Table 4. Reliability coefficients of the constructs
Constructs and items Factor loadings t-value AVE CR
First-order
Infrastructure 0.644 0.942
IN2 0.803 35.615
IN3 0.809 39.798
IN4 0.770 27.844
IN5 0.785 27.622
IN6 0.834 35.978
IN7 0.791 32.003
IN8 0.836 47.984
IN9 0.792 30.738
Environment 0.673 0.891
EN1 0.865 45.734
EN2 0.867 60.270
EN3 0.772 26.684
EN4 0.772 28.426
Accessibility 0.651 0.882
AC1 0.827 25.727
AC2 0.842 38.718
AC3 0.774 26.456
AC4 0.782 30.034
Attractions 0.644 0.844
AT1 0.778 14.730
AT2 0.769 26.227
AT3 0.856 48.004
Perceived Value 0.829 0.907
P1 0.903 71.355
P2 0.918 85.223
Satisfaction 0.805 0.925
S1 0.868 28.929
S2 0.921 90.852
S3 0.901 54.740
Loyalty 0.815 0.930
L1 0.903 70.249
L2 0.925 90.852
L3 0.879 39.152
Second-order
Destination Image 0.498 0.951
Infrastructure 0.911 159.834
Accessibility 0.690 42.480
Attractions 0.510 24.694
Note: All loadings are significant at the 1% level (p < 0.001) using a 2000 sample bootstrapping.
Table 5. Discriminant validity
1 2 3 4
Destination Image 0.848
Loyalty 0.633 0.903
Satisfaction 0.701 0.759 0.897
Perceived Value 0.608 0.618 0.645 0.911
Note: The square roots of AVEs are shown on the diagonal in bold.
3.4 Structure model and hypothesis testing
Standardized path coefficients (β), significance level (t-statistic), and R2 estimates were utilized
to estimate the structural model.
Table 6 shows the standardized path coefficients, t-values, and test results. The estimates of the structural coefficients provide the foundation for testing. H1 and H2 predict that the destination image has a significant and positive effect on perceived value and tourist satisfaction (β1 = 0.618, t-value = 17.840, p < 0.001; β2 = 0.496, t-value = 9.162, p < 0.001, respectively). Hence, H1 and H2 are supported. H3 predicts that destination image has no effect on tourist loyalty (β3 = 0.090, t-value = 1.739, p > 0.05); therefore, H3 is not supported. H4 and H5 predict that perceived value has a direct and positive effect on satisfaction and loyalty (β4 = 0.339, t-value = 5.764, p < 0.001; β5 = 0.194, t-value = 3.106, p < 0.05, respectively). Therefore, H4 and H5 are supported. H6 predicts that satisfaction has a direct and positive effect on loyalty (β6 = 0.571, t-value = 9.118, p < 0.001). Therefore, H6 is supported.
The R2 value is used as an indicator of the overall predictive strength of the model. Here, the R2
values are larger than the recommended criterion of 0.1 [52]. The R2 values of destination image,
perceived value, satisfaction, and loyalty are 0.498, 0.829, 0.801, and 0.815, respectively, which indicate that the exogenous variables of the constructs explain approximately 49.8%, 82.9%, 80.1%, and 81.5% of the variances of the constructs, respectively.
The Q2 value is an indicator of the model’s predictive relevance, with values larger than zero
indicating that the model has sufficient predictive relevance in relation to the endogenous variables.
The cross-validated redundancy approach, as a measure of Q2, is recommended by Hair, using
blindfolding procedures [53]. The Q2 values for perceived value (0.307), satisfaction (0.430), and
loyalty (0.489) were all larger than zero, indicating substantial predictive relevance and the ability to explain the endogenous latent variables. In addition, the Q2 values for the first-order destination
image indicators were all above 0.320, suggesting the predictive relevance of the model in explaining the first-order destination image variables.
Table 6. Results for the hypothesis model using PLS
Hypothesis Path coefficient t-value Support?
Destination Image ⟶ Perceived Value 0.618 17.840*** Yes
Destination Image ⟶ Satisfaction 0.496 9.162*** Yes
Destination Image ⟶Loyalty 0.090 1.739 No
Perceived Value ⟶ Satisfaction 0.339 5.764*** Yes
Satisfaction ⟶ Loyalty 0.571 9.118*** Yes
Note: A 2000 sample bootstrapping procedure was used; ** p < 0.01; *** p < 0.001
3.5 Direct, indirect, and total effects
Table7 shows the direct, indirect, and total effects among destination image, perceived value, satisfaction, and loyalty. The effect of destination image on perceived value is entirely direct (0.618). The destination image construct has the largest and positive effect on satisfaction (0.706), followed by perceived value (0.339). Moreover, the positive effect of destination image on satisfaction is more direct (0.496) than indirect (0.210), through perceived value. However, the effect of perceived value on satisfaction is entirely direct (0.339). The effect of satisfaction on loyalty is also entirely direct (0.571). In addition, the direct effect of perceived value on loyalty (0.194) is equivalent to its indirect effect (0.193). The path coefficient between destination image and loyalty is not statistically significant, but the total and indirect effects were found using a bootstrapping procedure. These results provide evidence of sound predictive ability for the estimated endogenous latent variables and their underlying indicators. The mediating effects were tested using the Sober test. Figure 2 shows all standardized path coefficients (β), significance levels, and R2 estimates.
Table 7. Direct, indirect, and total effects
Direct effects Indirect effects Total effects
Destination Image ⟶ Perceived Value 0.618 0.000 0.618
Destination Image ⟶ Satisfaction 0.496 0.210* 0.706
Destination Image ⟶ Loyalty 0.090 0.522* 0.612
Perceived Value ⟶ Satisfaction 0.339 0.000 0.339
Perceived Value ⟶ Loyalty 0.194 0.193* 0.387
Satisfaction ⟶ Loyalty 0.571 0.000 0.571
Note: * p < 0.05 using the Sober testing procedure
Figure 2. Results of destination loyalty model
Note: Direct influence is indicated by a solid line, and the line width indicates the degree of influence; no influence is
shown using a broken line.
Table 7 shows that the indirect effect of destination image on tourist loyalty is 0.522, which implies a mediating effect of perceived value and satisfaction. The classic causal step approach was employed to assess the mediation effect, as in Baron and Kenny (1986). Four conditions must be met to establish mediation: (1) there must be a direct link between the independent variable and dependent variable; (2) the independent variable must be related to mediating variables; (3) the mediator should be significantly related to the dependent variable when both independent and mediating variables are predictors of the dependent variable; and (4) the relationship between the independent variable and dependent variable must be significantly reduced when the mediator is added.
Table 8 indicates that the relationship between destination image and tourist loyalty is significantly reduced after controlling for perceived value and satisfaction, based on the calculation in Step 4. The beta coefficient between destination image and tourist loyalty was clearly reduced, from 0.612 (p < 0.001) in Step 1 to 0.032 (p > 0.05) in Step 4. Therefore, H7 is supported. Finally, the strength of this mediation is determined using the variable accounted for (VAF) method. The VAF determines the size of the indirect effect with respect to the total effect. When the VAF is above 80%, there is full mediation. A situation in which the VAF is larger than 20%, but less than 80% indicates partial mediation. Otherwise, the mediation effect does not exist. As indicated in Table 7, the VAF is 85.3%. Therefore, the findings of the mediation tests support the full mediating effect of perceived value and tourist satisfaction between destination image and tourist loyalty.
Table 8. Mediation tests using PLS
Steps of mediating effect Beta T-value
Step 1: Independent variable to outcome variable
Destination Image–Loyalty 0.612 17.374***
Step 2: Independent variable to mediators
Destination Image–Perceived Value 0.619 17.929***
Destination Image–Satisfaction 0.707 19.603***
Step 3 and Step 4: Independent variable and mediators to outcome variable
Destination Image–Loyalty 0.032 0.787
Perceived Value–Loyalty 0.193 3.088**
Satisfaction–Loyalty 0.574 8.748***
** p < 0.01; *** p < 0.001
4. Discussion and conclusions
4.1 Theoretical implications
The relationships among destination image, perceived value, tourist satisfaction, and tourist loyalty are analysed based on practical experience. The results showed that perceived value, destination image, and satisfaction are all antecedents of destination loyalty [50]. Most importantly, the mediating role of perceived value and satisfaction cannot be ignored.
Firstly, a significant relationship between destination image and perceived value was
examined, in line with the findings of previous studies [13–15]. Moreover, destination image and satisfaction were examined, and a positive relationship was found, which agrees with the findings of previous studies [17, 23]. In contrast to previous studies [15, 20], no statistically significant relationship between destination image and loyalty was identified in this study. Interestingly, these results suggest that perceived value and satisfaction mediate the relationship.
Secondly, perceived value had a positive influence on tourist satisfaction in this study, which coincides with the findings of previous research [28–30]. For example, Chen found a significant direct relationship between perceived value and satisfaction for heritage-site tourists [35]. Moreover, a significant relationship between perceived value and loyalty was found, which is also consistent with the results of previous studies [31, 32]. In contrast, Howat and Assaker did not find a significant direct relationship between perceived value and loyalty [56].
Thirdly, there is no doubt that tourist satisfaction affects loyalty. This study has demonstrated that satisfaction has a positive effect on loyalty and the findings are consistent with those of past studies [40, 41].
Finally, previous studies have developed theoretical frameworks and tested the constructs likely to affect tourist satisfaction, which, in turn, influence tourists’ intentions to revisit a destination and their loyalty. However, the mediation effect of perceived value and tourist satisfaction on the relationship between destination image and loyalty has received little attention. The findings of this study confirm that perceived value and satisfaction are mediating variables between destination image and loyalty.
In summary, the findings confirm that destination image, perceived value, and satisfaction are important predictors of destination loyalty. In addition, the results show that perceived value and tourist satisfaction mediate the relationship between destination image and loyalty.
4.2 Managerial implications
The results of this study have significant managerial implications. Firstly, there are four underlying dimensions of destination image, which seem to be fundamental elements that contribute to tourists’ satisfaction and loyalty. In particular, ‘infrastructure’ (factor 1) accounts for about 50% of the variance in ‘destination image’. The construction of infrastructure facilities (campgrounds, service stations, information centres) has been accelerated to elevate Xinjiang to a world-class international tourism destination. At the same time, ‘environment’ (factor 2), ‘accessibility’ (factor 3), and ‘attractions’ (factor 4) are all important elements to develop tourism in China. Thus, the destination image should be developed by destination managers. With planning, construction, and management, the destination image can be built to satisfy tourists. Managers should concentrate on perceived value and create new products and itineraries to reduce costs to tourists’ in terms of time and money. In addition, satisfied tourists will recommend these destinations to friends and relatives, and are more likely to revisit the destinations. Thus, marketers and managers should understand tourists’ loyalty and take appropriate measures to deal with complaints.
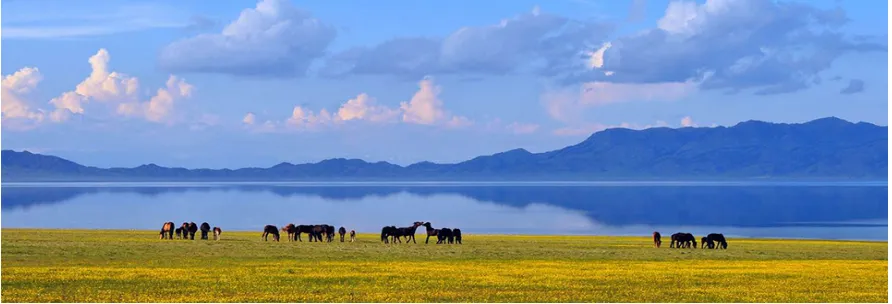
With the country’s rapidly growing economy, road trips in China have become a new trend. China possesses abundant tourist resources in the Xinjiang area, such as Tianshan (World Natural Heritage Site), the Silk Road (World Cultural Heritage Site), the Altai Mountains, and the Taklimakan Desert. Figures 3–5 show the beautiful scenery in Xinjiang. Furthermore, highways, railways, and civil aviation extend in all directions and travel websites are constructed to provide convenient travel information to tourists. These are the important factors to promote the development of car tourism.
In summary, tourism administrators need to accelerate infrastructure construction to enhance the destination image and should focus on tourist satisfaction in order to establish tourist loyalty. At the same time, marketers should design new products and itineraries to reduce tourists’ costs in terms of time and money, and actively develop new markets and customers in the field of car tourism. Finally, keeping a balance between developing tourism and conserving the unique natural and cultural heritage is key to achieving sustainable development of the tourism industry.
4.3 Limitations and suggestions
As in other studies, this study has several limitations. Firstly, the data used in this study only cover a short period. Therefore, the findings may not reflect seasonal variations. Secondly, there may exist other factors that affect tourist loyalty, beyond ‘destination image’, ‘perceived value’, and ‘tourist satisfaction’. Other potential antecedents should be explored in future studies. Lastly, the number of research questions should be adjusted in future studies. Destination image may include other constructs, which should be analysed using an exploratory factor analysis. In spite of these limitations, this study provides a new framework for investigating the causes and results of tourist satisfaction and destination loyalty, especially with regard to destination image.
Figure 3. Karajun - World Natural Heritage
Figure 5. Koktokay
Note: The above photos are photographed by Zhangping Yang.
Acknowledgments: This research was funded by the Major Science and Technology Project of Xinjiang Uygur Autonomous Region (No.2016A02002-1), the Science and Technology Service Network Initiative of CAS (KFJ-SW-STS-181), and the National Natural Science Foundation of China (No. 41301163).
Author Contributions: All authors contributed to designing the research and the questionnaire, as well as writing the manuscript. Bin Wang, Fang Han, and Hui Shi carried out the survey. All authors read and approved the final manuscript.
Conflicts of Interest: The authors declare no conflicts of interest.
References
1. Prideaux, B.; Carson, D. Drive tourism: trends and emerging markets. Drive Tourism Trends & Emerging Markets, 2010. 33(5): p. 1288-1289.
2. Prideaux, B.; Carson, D. A framework for increasing understanding of self-drive tourism markets. Journal of Vacation Marketing, 2003. 9(4): p. 307-313.
3. Guo, L. A new appraisement and exploitation strategy of Xinjiang tourism resources. Yunnan Geographic Environment Research, 1993. 5(2): p. 17-21.
4. Xu, X.; Yang, Z.; Saiken, A.; Rui, S.; Liu, X. Natural Heritage value of Xinjiang Tianshan and global comparative analysis. Journal of Mountain Science, 2012. 9(2): p. 262-273.
5. Lee, C.K.; Yoon, Y.S.; Lee, S.K. Investigating the relationships among perceived value, satisfaction, and recommendations: The case of the Korean DMZ. Tourism Management, 2007. 28(1): p. 204-214.
6. Ryu, K.; Han, H.; Kim, T.H. The relationships among overall quick-casual restaurant image, perceived value, customer satisfaction, and behavioral intentions. International Journal of Hospitality Management,
2008. 27(3): p. 459-469.
7. Echtner, C.M.; Ritchie, J.R.B. The measurement of destination image: an empirical assessment. Journal of Travel Research, 1993. 31(4): p. 3-13.
8. Gallarza, M.G.; Saura, I.G.; Garcı́A, H.C. Destination image: Towards a Conceptual Framework. Annals of Tourism Research, 2002. 29(1): p. 56-78.
9. Sanz Blas, S.; Carvajal-Trujillo, E. Cruise passengers' experiences in a Mediterranean port of call. The case study of Valencia. Ocean & Coastal Management, 2014. 102, Part A: p. 307-316.
10. Toudert, D.; Bringas-Rábago, N.L. Impact of the destination image on cruise repeater’s experience and intention at the visited port of call. Ocean & Coastal Management, 2016. 130: p. 239-249.
11. Sun, X.; Geng-Qing, C.; Xu, H. Developing destination loyalty: The case of Hainan island. Annals of Tourism Research, 2013. 43: p. 547-577.
12. Stylos, N.; Vassiliadis, C.A., Bellou,V.; Andronikidis, A. Destination images, holistic images and personal normative beliefs: Predictors of intention to revisit a destination. Tourism Management, 2016. 53: p. 40-60. 13. Jin, N.H.; Hyuckgi L.; Lee, S.M. Event quality, perceived value, destination image, and behavioral
Tourism Research, 2013. 18(8): p. 1-16.
14. Aliman, N.K., et al. Tourist expectation, perceived quality and destination image: effects on perceived value and satisfaction of tourists visiting langkawi island, Malaysia. Asian Journal of Business & Management, 2014.
15. Allameh, S.M., et al., Factors influencing sport tourists’ revisit intentions: The role and effect of destination image, perceived quality, perceived value and satisfaction. Asia Pacific Journal of Marketing and Logistics, 2015. 27(2): p. 191-207.
16. Chen, N.; Funk, D.C. Exploring destination image, experience and revisit intention: a comparison of sport and non-sport tourist perceptions. Journal of Sport Tourism, 2010. 15(3): p. 239-259.
17. Chi, G.Q.; Qu, H. Examining the structural relationships of destination image, tourist satisfaction and destination loyalty: An integrated approach. Tourism Management, 2008. 29(4): p. 624-636.
18. Hernández-Lobato, L. Tourism destination image, satisfaction and loyalty: A study in Ixtapa-Zihuatanejo, Mexico. Tourism Geographies, 2006. 8(4): p. 343-358.
19. Tan, W.K.; Wu, C.E. An investigation of the relationships among destination familiarity, destination image and future visit intention. Journal of Destination Marketing & Management, 2015.
20. Zhang, H., et al. Destination image and tourist loyalty: A meta-analysis. Tourism Management, 2014. 40: p. 213-223.
21. Chew, E.Y.T.; Jahari, S.A. Destination image as a mediator between perceived risks and revisit intention: A case of post-disaster Japan. Tourism Management, 2014. 40: p. 382-393.
22. Chen, C.F.; Tsai, D.C. How destination image and evaluative factors affect behavioral intentions? Tourism Management, 2007. 28(4): p. 1115-1122.
23. Assaker, G.; Vinzi, V.E.; O’Connor, P. Examining the effect of novelty seeking, satisfaction, and destination image on tourists’ return pattern: A two factor, non-linear latent growth model. Tourism Management, 2011. 32(4): p. 890-901.
24. Petrick, J.F. Development of a multi-dimensional scale for measuring the perceived value of a service. Journal of Leisure Research, 2002. 34(2): p. 119-134.
25. Boksberger, P.E.; Melsen, L. Perceived value: a critical examination of definitions, concepts and measures for the service industry. J Serv Mark. Journal of Services Marketing, 2011. 25(3): p. 229-240.
26. Duman, T.; Mattila, A.S. The role of affective factors on perceived cruise vacation value. Tourism Management, 2005. 26(3): p. 311-323.
27. Clemes, M.D.; Brush, G.J.; Collins, M.J. Analysing the professional sport experience: A hierarchical approach. Sport Management Review, 2011. 14(4): p. 370-388.
28. Cronin, J.J.; Brady, M.K.; Hult, G.T.M. Assessing the effects of quality, value, and customer satisfaction on consumer behavioral intentions in service environments. Journal of Retailing, 2000. 76(2): p. 193-218. 29. Mcdougall, G.H.G.; Levesque, T. Customer satisfaction with services: putting perceived value into the
equation. Journal of Services Marketing, 2000. 14(5): p. 392-410.
30. Woodruff, R.B. Customer value: The next source for competitive advantage. Journal of the Academy of Marketing Science, 1997. 25(2): p. 139-153.
31. Li, X. ; Petrick, J.F. Towards an integrative model of loyalty formation: the role of quality and value. Leisure Sciences, 2010. 32(3): p. 201-221.
32. Kim, S.H.; Holland, S.; Han, H.S. A structural model for examining how destination image, perceived value, and service quality affect destination loyalty: a case study of Orlando. International Journal of Tourism Research, 2013. 15(4): p. 313-328.
33. Ilban, M.O.; Kasli, M.; Bezirgan, M. Effects of destination image and total perceived value on tourists' behavioral intentions: an investigation of domestic festival tourists. Tourism Analysis, 2015. 20(5): p. 499-510.
34. Song, H., et al. The Hong Kong tourist satisfaction index. Annals of Tourism Research, 2012. 39(1): p. 459-479.
35. Chen, C.F.; Tsai, D.C. How destination image and evaluative factors affect behavioral intentions? Tourism Management, 2007. 28(4): p. 1115-1122.
37. Rasoolimanesh, S.M.; Dahalan, N.; Jaafar, M. Tourists' perceived value and satisfaction in a community-based homestay in the Lenggong Valley World Heritage Site. Journal of Hospitality and Tourism Management, 2016. 26: p. 72-81.
38. Mason, M.C.; Paggiaro, A. Investigating the role of festivalscape in culinary tourism: The case of food and wine events. Tourism Management, 2012. 33(6): p. 1329-1336.
39. Kim, Y.H.; Kim, M.C.; Goh, B.K. An examination of food tourist’s behavior: Using the modified theory of reasoned action. Tourism Management, 2011. 32(5): p. 1159-1165.
40. 40. Radojevic, T., N. Stanisic, and N. Stanic, Ensuring positive feedback: Factors that influence customer satisfaction in the contemporary hospitality industry. Tourism Management, 2015. 51: p. 13-21.
41. Vosta, L.N.; Pool, J.K.; Jalilvand, M.R.; Nafchali, J.S. The effect of marketing constructs and tourists’ satisfaction on loyalty to a sport destination: A structural equation model and analysis. Education Business & Society Contemporary Middle Eastern Issues, 2014. 7(4): p. 316-332.
42. Oliver, R.L. Whence Consumer Loyalty? Journal of Marketing, 1999. 34(1): p. 33-44.
43. Rundle-Thiele, S. Exploring loyal qualities: assessing survey-based loyalty measures. Journal of Services Marketing, 2013. 19(7): p. 492-500.
44. Wendy-Gao, B.; Lai, I.K.W. The effects of transaction-specific satisfactions and integrated satisfaction on customer loyalty. International Journal of Hospitality Management, 2015. 44: p. 38-47.
45. Reza Jalilvand, M.; et al. Examining the structural relationships of electronic word of mouth, destination image, tourist attitude toward destination and travel intention: An integrated approach. Journal of Destination Marketing & Management, 2012. 1: p. 134-143.
46. Clavijolópez, J.C. The effect of destination image on perceived value, and their influence on behavioural intentions: Differences between visitors and non-visitors from Australia, Canada, United Kingdom and United States towards Colombia as a tourism destination. Maestría En Mercadeo, 2014.
47. Jhandir, S.U. Customer satisfaction, perceived service quality and mediating role of perceived value. International Journal of Marketing Studies, 2012. 4(1).
48. Shafiq, R. Analysis of the factors affecting customers’ purchase intention: The mediating role of perceived value. African Journal of Business Management, 2011. 5(26).
49. Heung, V.C.S.; Ngai, E.W.T. The mediating effects of perceived value and customer satisfaction on customer loyalty in the chinese restaurant setting. Journal of Quality Assurance in Hospitality & Tourism,
2008. 9(2): p. 85-107.
50. Song, Z.B.; Xin, S.; Li, L.N. The indirect effects of destination image on destination loyalty intention through tourist satisfaction and perceived value: the bootstrap approach. Journal of Travel & Tourism Marketing, 2013. 30(4): p. 386-409.
51. Fornell, C.; Larcker, D.F. Evaluating Structural Equation Models with Unobservable Variables and Measurement Error. Journal of Marketing Research, 1981. 18(1): p. 39-50.
52. Cevdet Altunel, M.; Erkut, B. Cultural tourism in Istanbul: The mediation effect of tourist experience and satisfaction on the relationship between involvement and recommendation intention. Journal of Destination Marketing & Management, 2015. 4(4): p. 213-221.
53. Hair, J.F.; et al. A Primer on Partial Least Squares Structural Equation Modeling (PLS-SEM) (1st) 2014, USA: Sage Publications.
54. Fornell, C.; Larcker, D.F. Evaluating structural equation models with unobservable variables and measurement error. Journal of Marketing Research, 1981. 18(1): p. 39-50.
55. Chin, W.W.; Gopal, A.; Salisbury, W.D. Advancing the theory of adaptive structuration: the development of a scale to measure faithfullness of appropriation. Information Systems Research, 1997. 8(4): p. 342-367. 56. Howat, G.; Assaker, G. The hierarchical effects of perceived quality on perceived value, satisfaction, and
loyalty: Empirical results from public, outdoor aquatic centres in Australia. Sport Management Review,
2013. 16(3): p. 268-284.