265
Assessment of supply chain agility in the Indian garment industry
Siddharth Shankar Raia
Sunil Girib
a Assistant Professor; Logistics Management, Rajeev Gandhi South Campus, Banaras Hindu University, Barkacha, India & Research Scholar, SMVD University Katra, J&K.
b Associate Professor; Operations Management, Management Development Institute, Murshidabad, India
ssrai025@gmail.com, siddharthsr@hotmail.com (Corresponding author)
A R T I C L E H I S T O R Y :
Received: 23-May-2019 Accepted: 30-Sep-2019 Onlineavailable: 15-Oct-2019
Keywords:
Supply chain agility, Supply agility, Manufacturing agility, Distribution agility, Garment supply chain, India
A B S T R A C T
The research aims to provide a supply chain agility framework with stage-wise holistic assessment of the performance and binding relationships. The study considers agility at three stages: supply, manufacturing, and distribution. It applies structural equation modelling to examine the impact of major determinants as strategic partnership, information sharing, resilience, sourcing flexibility, and order fulfillment flexibility on stage-wise agility in the supply chain. The analysis has uncovered that manufacturing agility is affected by all the determinants while supply agility is not affected by any constructs of flexibility of sourcing and order fulfillment in the Indian garment industry. Distribution agility is significantly affected by all the determinants but information sharing and resilience, which can be caused by infrastructure constraints in the Indian conditions. The research provides important implications for practitioners and researchers.
Contribution/Originality
This research contributes to the academia and industry. It considers the vague explanation of supply chain agility and holistically describes it in the segregated stage-wise approach. It builds on gaps in the literature about the assessment of supply chain agility at individual stages of supply chain. The paper produces a comprehensive framework for the stage-wise investigation of agility within the impactful determinant interactions. It investigates the hypothesized relationships that do not prove statistically feasible.
DOI:10.18488/journal.1007/2019.9.10/1007.10.265.280 ISSN(P):2306-983X,ISSN(E):2224-4425
Howtocite:Siddharth Shankar Rai and Sunil Giri (2019).Assessment of supply chain agility in the Indian garment industry.AsianJournalofEmpiricalResearch,9(10), 265-280.
©2019AsianEconomicandSocialSociety.Allrightsreserved
Asian
Journal
of
Empirical
Research
Volume9,Issue 10(2019):265-280
266
1.
INTRODUCTION
Agility is the most crucial element of the ‘triple A’ supply chain (along with adaptability and alignment) which focuses on a quick response to short-term changes in demand or supply and smooth handling of external disruptions (Lee, 2004). Lee has emphasized that mere efficiency is not enough and all great supply chains are agile. Supply chain agility is more important in situations of demand uncertainty, high perishability of products, and low life cycles (Fisher, 1997; Christopher,
2000; Lee, 2002). Garment products face high demand fluctuations and uncertainties because of
consistent changes in the fashion that make demand forecasting really challenging (Sheffi, 2005). High uncertainty in the market and consumer tastes reduces the life cycle of garment products and makes them perishable irrespective of their material life cycles. Fast fashion retailers like Zara and H&M consistently introduce new designs and renew their product ranges every 2-3 weeks at reasonable prices (Barnes and Lea-Greenwood, 2006; Bianchi and Birtwistle, 2012). That increases consumption and consumers’ expectation of frequent changes and availability of new products
(Bruce and Daly, 2006) resulting in a reduced life cycle of garment products and making them
highly perishable.
In India the garment and textiles industry contributes 5% of Indian GDP and 11% to the country’s overall Index of Industrial Production (IIP). However, the garment and textile industry in India is highly fragmented and competition is very intense on the domestic and international markets. Domestic garment organizations earn good margins, although for being market leaders their supply chains need to be more responsive (CRISIL Research, 2015). This paper focuses on studying the agility of chain supplies in the Indian garment industry. The study explores how supply chain agility in the garment industry works and how it is influenced over time. Irrespective of its size and contribution to the Indian economy the garment industry has failed to grab the attention of researchers of supply chain management. Literature survey shows lack of studies on the garment supply chain in India and supply chain agility in the Indian context. The only literature on the Indian garment industry we found is related to the productivity of Indian apparel manufacturers (Bheda et
al., 2003; Joshi and Singh, 2010), export performance of the garment and textiles industry
(Balasubramanyam and Wei, 2005; Bhavani and Tendulkar, 2001), lean manufacturing practice in
the textile industry in southern India (Saleeshya and Raghuram, 2012), corporate social responsibility and working conditions in the Indian garment industry (Stigzelius and Mark-Herbert, 2009; de Neve, 2009), social and environmental disclosure practices (Nurhayati et al., 2015), and technical efficiency in the Indian textiles industry (Bhandari and Ray, 2012).
Lack of studies of the garment supply chain and its responsiveness provides motivation for studying the supply chain which focuses on the garment industry. It motivates to explore the general supply chain structure which can affect the supply chain agility in India. Previous studies cover: alignment and dissimilarities in supply chain management practices (Sahay et al., 2006; Jharkharia and Shankar, 2006; Sahay and Mohan, 2003), supply chain architecture in India (Sahay et al., 2003), information system (Rahman, 2004) and supply chain performance measurement (Saad and Patel, 2006). Studies reveal that Indian supply chain infrastructure is inadequate to meet growth aspirations and faces many challenges that affect its responsiveness such as: connectivity issues, congested roads and ports, high cost, lower profitability, inadequate manpower resources, and lower technology adoption (Gupta et al., 2010; Jayaram and Avittathur, 2012; Deloitte, 2014).
This study addresses the following research questions to bridge the aforementioned gaps in research: 1. what are the key determinants of an agile performance of the supply chain 2. how to assess supply chain agility in the Indian garment industry.
267
by the theoretical framework and the proposed hypothesis. The study uses structural equation modeling for data analysis followed by discussion of the results and managerial implications of the research.
2. LITERATURE REVIEW
An agile supply chain focuses on rapidly adapting to changes of customers’ needs and market volatility (Roh et al., 2014). The philosophy of agility resides in the existence of uncertain situations and focuses on faster response to the requirements of the market (Mahadevan, 2015). Time reduction improves agility and enables the supply chain to deliver the right product in the right quantity to the right customers/destinations in the desired time. Agility in the supply chain (Christopher, 2000;
Chopra and Meindl, 2007) is a major aspect of a responsive supply chain. A responsive supply chain
additionally inherits the cost consideration that enables a quick reaction with cost efficiency to cope with the changing market requirements in a competitive environment (Gunasekaran et al., 2008). Agility is dependent on the efforts of all partners across the supply chain (Kim et al., 2006). It therefore requires the effort of the entire supply chain to effectively respond to customer demands and environmental challenges (Mentzer et al., 2001; Burke and Vakharia, 2002; Kim and Lee, 2010). There are 3 main stages in any supply chain: sourcing, manufacturing, and delivery. For fast responsiveness there should be equal contribution from all three stages of the supply chain. Overall responsiveness will be portrayed at the supplier, manufacturer, flow, and delivery. There are studies on the individual aspects of responsiveness.
There is plenty of research that focuses on supplier responsiveness, factors that cause it, and the impact of suppliers on the responsiveness of the whole supply chain (Sinkovics et al., 2011; Martin
and Grbac, 2003; Williamson, 1991; Squire et al., 2009). Attention has likewise been paid to
manufacturing agility (Godsell et al., 2006; Gunasekaran et al., 2008; Kim et al., 2013; Wong and
Hvolby, 2007; Seth and Panigrahi, 2015). The final phase of agility resides in distribution and
delivery of the supply chain which focuses on the flow of finished products. It has been termed
distribution agility in research. Distribution agility is the final level which oversees the shipment and delivery of the finished products to retailers and customers. Very few studies describe the importance of distribution and logistical agility of a supply chain. Among the major contributions,
Vidalakis and Sommerville (2013) measure the relationship between transportation responsiveness
and cost efficiency to analyze the delivery performance and transport efficiency in the supply chain.
Ülgen and Forslund (2015) identify the supply chain practices and barriers to the management of
logistical performance in the textile industry. This paper divides agility into three stages: supply agility, manufacturing agility, and distribution agility. All three stages have been simultaneously covered in the study to paint the complete picture of supply chain agility.
2.1. Supply agility
Supply agility examines the response of suppliers to the manufacturers. The manufacturer requires the suppliers’ agility in the procurement, sourcing and support related activities. Sinkovics et al.
(2011) describe the different factors of supply agility and emphasized the importance of the supplier
responsiveness in meeting the customer demands quickly worldwide and increasing overall supply chain responsiveness. Current research includes the constructs of supply agility based on: coping with fluctuations and variations in the demand, suppliers’ inventory level adequacy to fulfill the emergency orders and increased orders, and suppliers’ responsive approach towards replacement of the defective items.
2.2. Manufacturing agility
268
manufacturing firm. In the current research, the constructs which have been considered for manufacturing agility include: production planning, optimum inventory and continuous flow of inventory at the retailers’ end and immediate response to the retailers’ or customers’ demands (Godsell et al., 2006; Gunasekaran et al., 2008).
2.3. Distribution agility
Distribution agility takes into account the variables which are crucial for the flow of items (mainly the finished products) from one place to another. Specifically, distribution focuses on the key logistics activities such as: movement and storage of goods from one location to another (Jacobs and
Chase, 2008). Having their significant effect on firm performance the logistics activities aim at
delivering the right product to the customers at right time (Goetschalckx, 2011). The supply chain performance very much depends upon the performance of the distribution agility. Any delays caused in the distribution will delay the delivery performance of the supply chain (Ülgen and Forslund 2015).
2.4. Determinants of supply chain agility
An agile supply chain aims at fulfilling the maximum customer demands with no loss on sales. However, the agility of the supply chain depends upon its determinants and their impact on its performance. Determinants of agility (François et al., 2010) are the determining factors of its process which impacts the performance of the entire supply chain. Determinants are independent factors or variables which drastically affect the performance of a dependent factor or variable. A variation in the usual behaviour of determinants will certainly cause the variation in agility and thus, a variation in the entire supply chain performance. The paper aims at determining the basic factors that influence the behaviour of a supply chain. A complete picture of overall supply chain agility requires the portrayal of both the upstream supply chain and the downstream supply chain.
Lee (2004) has, described adaptability and alignment as the major elements required for the survival
of the modern supply chain. Adaptability refers to the flexibility of a supply chain to adjust with the changes and the structural shifts happening in the market. Alignment focuses on strategic alliances in upstream and downstream supply chain by information sharing, partnership building and risk sharing (Simchi-Levi et al., 2008; Lee, 2004). Hence, the basic aspects of a supply chain’s responsive performance include: information system (Qrunfleh and Qrunfleh, 2014), flexibility (Kim
et al., 2013), uncertainty (Hult et al., 2010) and partnerships (Montoya-Torres and Ortiz-Vargas, 2014). Long term strategic partnerships resulting from the continuous information sharing result in the improved supply chain performance. Information sharing in the supply chain improves visibility
(Williams et al., 2013). Improved visibility enhances supply chain agility (Brusset, 2016).
Uncertainties in the supply chain make it vulnerable to the disruptions (Sheffi, 2005). A supply chain requires a resilient approach to overcome its vulnerabilities and uncertainties (Sheffi, 2005;
Kamalahmadi and Parast, 2016). Flexibility is important in both upward and downward ends of the
supply chain. Flexibility in the upstream supply chain improves the availability of the qualified materials & services and improves the purchasing efficiency to respond to the changing requirements (Moon et al., 2012). Flexibility in the downstream supply chain which is involved in the order fulfillment process represents the manufacturing flexibility, the operating system flexibility and the distribution flexibility (Moon et al., 2012; Kim et al., 2013). The paper introduces the major determinants of the agile supply chain as a strategic partnership, information sharing, resilience, sourcing flexibility and order fulfillment flexibility.
2.5. Strategic partnership
269
relationships and generate more opportunities for better improvements (Barratt, 2004). More collaborative practices result in better firm performance leading to the supply chain responsiveness. Organizations with no strategic collaboration combined with isolated forecasting and planning - face the situations of disconnection between supply and demand, and overstocking of inventory in upward and downward supply chain.
2.6. Information sharing
Information sharing aims at collecting and sharing the real time information among the members of the supply chain. It enhances the supply chain visibility which is the extent to which the supply chain members share or have the access to information useful to the operations and mutual benefits (Barratt and Oke, 2007). Information sharing is required in every phase of the supply chain and it can play a significant role in all the three aspects of responsiveness – logistics responsiveness, supplier responsiveness and downstream responsiveness.
2.7. Resilience
Resilience refers to a firm’s capability to survive, adapt and grow in a dynamic, changing and uncertain environment (Fiksel, 2006; Sawik, 2013). The concept of resilience refers to its capability of returning back to the stable state after facing the disruptive situation. Disruptions in the supply chain are inevitable. The literature mainly focuses on two kinds of approaches to the resilience i.e. proactive approach and reactive approach (Melnyk et al., 2014). Reactive approach comes into action after the disruption has taken place, while proactive approach refers to the preparedness. However, an agile supply chain needs to focus on proactive approach in the wake of upcoming disruptions. A reactive approach will be associated with the recovery process after the disruption occurrence, which will reduce the responsiveness. In this paper resilience will mainly concentrate on the proactive approach.
2.8. Sourcing flexibility
Sourcing flexibility refers to the flexibility of the supply side to vary manufacturing orders and demands. Sourcing flexibility is a supply chain reconfiguration ability through selection and de-selection of the vendors (Gosling et al., 2010). It can be perceived as an adaptive response to the uncertainty in upstream supply chain environment (Gerwin, 1993). Sourcing flexibility is directly associated with the responsiveness of the manufacturer and the study assumes that it affects all the three forms of responsiveness.
2.9. Order fulfilment flexibility
Order fulfilment flexibility refers to the flexibility in the downstream supply chain which begins from the manufacturer. Order fulfilment flexibility aims at providing faster responses in the downstream supply chain. It focuses on the flexibility in the processes and flexibility in the demand fulfilment (Tang and Tomlin, 2008). Flexibility in processes indicates to the manufacturing flexibility which emphasizes on the shifting of the production quantities across the internal resources and the demand fulfilment flexibility involves shifting the production quantities across different products as well as shifting demands across different products including postponement and flexible pricing (Tang and Tomlin, 2008).
2.10. Theoretical framework and hypothesis
270
partnership, information sharing, resilience, sourcing flexibility, order fulfilment flexibility and the stages of agility i.e. supply agility, manufacturing agility and distribution agility. The study proposes following hypothesis:
H1: Supply agility as a dimension of supply chain agility is positively affected by the determinants of supply chain – strategic partnership, information sharing, resilience, sourcing flexibility and order fulfillment flexibility.
H1A: Strategic partnership positively affects supply agility. H1B: Information sharing positively affects supply agility. H1C: Resilience positively affects supply agility.
H1D: Sourcing flexibility positively affects supply agility. H1E: Order fulfillment flexibility positively affects supply agility.
H2: Manufacturing agility as a dimension of supply chain agility is positively affected by the determinants of responsive supply chain – strategic partnership, information sharing, resilience, sourcing flexibility and order fulfillment flexibility.
H2A: Strategic partnership positively affects the manufacturing agility. H2B: Information sharing positively affects the manufacturing agility. H2C: Resilience positively affects the manufacturing agility.
H2D: Sourcing flexibility positively affects the manufacturing agility. H2E: Order fulfillment flexibility positively affects the manufacturing agility.
H3: Distribution agility as a dimension of supply chain agility is positively affected by the determinants of responsive supply chain – strategic partnership, information sharing, resilience, sourcing flexibility and order fulfillment flexibility.
H3A: Strategic partnership positively affects the distribution agility. H3B: Information sharing positively affects the distribution agility. H3C: Resilience positively affects the distribution agility.
H3D: Sourcing flexibility positively affects the distribution agility. H3E: Order fulfillment flexibility positively affects the distribution agility.
Strategic Partnership
Information Sharing
Resilience
Sourcing Flexibility
Order Fulfilment Flexibility
Supply Agility
Manufacturing Agility
Distribution Agility
271
3. RESEARCH METHODOLOGY
3.1. Sampling and data collection
The study uses a survey method for the data collection. The survey instrument includes the constructs describing different parameters. The survey questionnaire consists of eight major constructs including three constructs of agility – supply agility, manufacturing agility and distribution agility; and five constructs of determinants – strategic partnership, information sharing, resilience, sourcing flexibility, order fulfillment flexibility. Eight constructs included their defining variables that explained and formed the constructs. Supply agility includes defect replacement, suppliers’ response, and suppliers’ inventory. Manufacturing agility is explained by the immediate response, timely replenishment, maintained a level of retailers’ stocks and meeting the production schedule. Distribution agility has been defined by the variables including logistics infrastructure, traffic, timely deliveries, and delays. Strategic partnership includes suppliers’ involvement, information sharing with suppliers, relationship with suppliers and suppliers’ participation in decision making. Information sharing includes real-time information about inventories and information sharing in the supply chain. Resilience is explained by risk prediction, changes in the market, safety measures and preparedness. Sourcing flexibility includes the defining variables including flexibility to add and change suppliers and coping with changes. Order fulfillment flexibility includes the expansion of distribution centers and efficiency in distribution. All the variables in the survey questionnaire were assessed using the five-point Likert scale.
The survey questionnaires were sent to the respondents personally and via electronic mail. The respondents consisted of middle and top level personnel from the garment manufacturing companies across India. A total of 56 respondents were contacted in person and their responses were recorded after the detailed personal interactions. Apart from the personal interactions, a total of 927 questionnaires were sent via electronic mail in the garment manufacturing companies across India. After continuous follow-ups and requests, a total of 172 complete responses were received. Finally, a total of 228 completed questionnaires were available in usable form for the further analysis. Indian garment industry consists of a large number of garment manufacturers and 228 is a small sample size to be representative of such big industry. However, a smaller sample size can be representative of a huge population (Malhotra and Birks, 2007). For example, in a similar study based on supply chain responsiveness Williams et al. (2013) have taken a sample size of 206 respondents representing more than eighteen industries which will cover very huge population size. 3.2. Measurement model
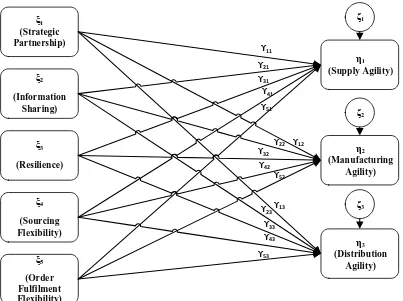
The static relationship evaluates the relationship between the determinants and the agility constructs. The paper considers the agility constructs as endogenous constructs and determinants as the exogenous constructs. A relationship has been framed in a structural form as shown in figure 2. The structural model consists of the latent endogenous constructs (η), individual relationship coefficients (γ), latent exogenous constructs (ξ) and the error term (ζ). The individual relationships between an endogenous construct and the exogenous constructs are defined by the combined behaviour of exogenous constructs and the coefficients with the inclusion of the unavoidable error term. The mathematical representation of the relationship is defined by the following equation:
𝜂 = Γ 𝜉 + 𝜁
Г represents the relationship coefficients or the regression weights (γ11 to γ53). The individual representations of each of the relationships are derived from the above equation as:
𝑆𝑢𝑝𝑝𝑙𝑦 𝐴𝑔𝑖𝑙𝑖𝑡𝑦 = 𝛾11 𝑆𝑡𝑟𝑎𝑡𝑒𝑔𝑖𝑐 𝑃𝑎𝑟𝑡𝑛𝑒𝑟𝑠ℎ𝑖𝑝 + 𝛾21 𝐼𝑛𝑓𝑜𝑟𝑚𝑎𝑡𝑖𝑜𝑛 𝑆ℎ𝑎𝑟𝑖𝑛𝑔 +
272
𝑀𝑎𝑛𝑢𝑓𝑎𝑐𝑡𝑢𝑟𝑖𝑛𝑔 𝐴𝑔𝑖𝑙𝑖𝑡𝑦 = 𝛾12 𝑆𝑡𝑟𝑎𝑡𝑒𝑔𝑖𝑐 𝑃𝑎𝑟𝑡𝑛𝑒𝑟𝑠ℎ𝑖𝑝 + 𝛾22 𝐼𝑛𝑓𝑜𝑟𝑚𝑎𝑡𝑖𝑜𝑛 𝑆ℎ𝑎𝑟𝑖𝑛𝑔 +
𝛾32 𝑅𝑒𝑠𝑖𝑙𝑖𝑒𝑛𝑐𝑒 + 𝛾42 𝑆𝑜𝑢𝑟𝑐𝑖𝑛𝑔 𝐹𝑙𝑒𝑥𝑖𝑏𝑖𝑙𝑖𝑡𝑦 + 𝛾52 𝑂𝑟𝑑𝑒𝑟 𝐹𝑢𝑙𝑓𝑖𝑙𝑚𝑒𝑛𝑡 𝐹𝑙𝑒𝑥𝑖𝑏𝑖𝑙𝑖𝑡𝑦 + ζ2 …… (2)
𝐷𝑖𝑠𝑡𝑟𝑖𝑏𝑢𝑡𝑖𝑜𝑛 𝐴𝑔𝑖𝑙𝑖𝑡𝑦 = 𝛾13 𝑆𝑡𝑟𝑎𝑡𝑒𝑔𝑖𝑐 𝑃𝑎𝑟𝑡𝑛𝑒𝑟𝑠ℎ𝑖𝑝 + 𝛾23 𝐼𝑛𝑓𝑜𝑟𝑚𝑎𝑡𝑖𝑜𝑛 𝑆ℎ𝑎𝑟𝑖𝑛𝑔 +
𝛾33 𝑅𝑒𝑠𝑖𝑙𝑖𝑒𝑛𝑐𝑒 + 𝛾43 𝑆𝑜𝑢𝑟𝑐𝑖𝑛𝑔 𝐹𝑙𝑒𝑥𝑖𝑏𝑖𝑙𝑖𝑡𝑦 + 𝛾53 𝑂𝑟𝑑𝑒𝑟 𝐹𝑢𝑙𝑓𝑖𝑙𝑚𝑒𝑛𝑡 𝐹𝑙𝑒𝑥𝑖𝑏𝑖𝑙𝑖𝑡𝑦 + ζ3 …… (3)
The individual equations represent the formation and behaviour of individual constructs of responsiveness, that is based on the set of determinants assumed to react together to produce a meaningful relationship for the situation.
ξ1 (Strategic Partnership)
ξ2
(Information Sharing)
ξ3
(Resilience)
ξ4
(Sourcing Flexibility)
ξ5
(Order Fulfilment Flexibility)
η1 (Supply Agility)
η2 (Manufacturing
Agility)
η3 (Distribution
Agility) ϒ11
ϒ21
ϒ31
ϒ41
ϒ51
ϒ12
ϒ22
ϒ32
ϒ42
ϒ52
ϒ13
ϒ23
ϒ33
ϒ43
ϒ53
ζ1
ζ2
ζ3
Figure 2: Structural measurement model
3.3. Common method bias test
A common method bias or common method variance test is conducted to check the response bias from the respondents because of their consistency on responding to the multiple parameters in a single survey in a cross-sectional study (Chang et al., 2010). Harman’s single factor method (Sharma
et al., 2009) for common method variance was used. Only 15.002% of the variance was explained by the single factor analysis. Therefore, the data seemed to be free of the common method bias. 3.4. Validity and reliability assessment
273
The analysis further analyses convergent & discriminant validity and composite reliability measurement of the latent variable structure. Table 1 shows measurements of reliability and validity. The values of Composite Reliability (CR) should be above 0.7 for an acceptable measure. Observations are above threshold limit that shows the data have high reliability. The discriminant validity measurement emphasizes on the distinguishability of indicators of one construct from the indicators of other constructs (Mackenzie et al., 2011). Fornell and Larcker (1981) have suggested measuring Average Variance Extracted (AVE) for discriminant validity. AVE > 0.5 indicates that majority of the variance in the first order observed variables is shared with second order latent constructs (Mackenzie et al., 2011). The validity check table shows AVE more than 0.5 for every latent construct which is acceptable. The square root of the values in AVE table equals the values in correlations table. CR values are also higher than the AVE values. Therefore, the composite reliability is high for every latent constructs, and there is no convergent and discriminant validity related issues in the data.
4. RESULTS
Results show the acceptable model fit for the hypothesized model. The value of χ2 is low at 398.587 with 385 degrees of freedom. The ratio of χ2/df is below the threshold value and χ2 is insignificant at 0.306 that indicates a good model fit. Values of all the indices including RMR, SRMR, GFI, AGFI, NFI, TLI, CFI, and RMSEA are within the threshold limits of model fitness requirements (see table 2). Having all the indices in the acceptable limits, the model indicates a close fit between the hypothesized model and the perfect fit.
274
Table 1: Validity and reliability measurement
Construct reliability
& validity Correlation
CR AVE Sourcing
Flexibility
Strategic Partnership
Distribution Agility
Information Sharing
Supply
Agility Resilience
Manufacturing Agility
Order Fulfilment Flexibility Sourcing
Flexibility 0.936 0.817 0.915
Strategic
Partnership 0.928 0.786 0.071 0.880
Distribution Agility 0.927 0.892 0.139 0.130 0.932 Information
Sharing 0.876 0.856 0.035 0.105 0.007 0.929
Supply Agility 0.787 0.740 0.083 0.092 0.195 0.059 0.866
Resilience 0.889 0.691 0.307 0.035 0.138 0.247 0.052 0.842
Manufacturing
Agility 0.842 0.599 -0.058 0.126 -0.030 0.200 0.024 0.168 0.785
Order Fulfilment
275
Table 2: Model fitness test
Indices Statistics Requirement Observed
RMR Root Mean Square
Residual Between 0 to 1 0.137
SRMR Standardizes Root
Mean Square Residual < 0.10 0.040
GFI Goodness-of-Fit Index > 0.9 0.916
AGFI Adjusted
Goodness-of-Fit Index > 0.85 0.892
NFI Normed Fit Index > 0.9 0.956
TLI Tucker-Lewis index > 0.95 0.982
CFI Comparative Fit Index > 0.97 0.992
RMSEA Root Mean Square
Error of Approximation < 0.05 0.012
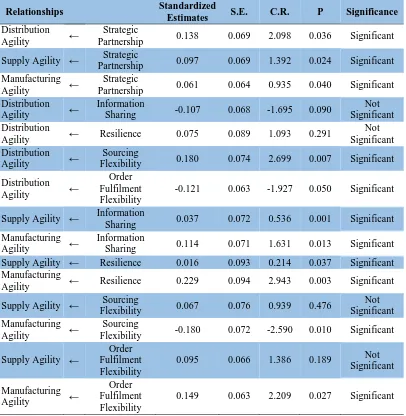
Table 3: Summary of path analysis
Relationships Standardized
Estimates S.E. C.R. P Significance
Distribution
Agility ←
Strategic
Partnership 0.138 0.069 2.098 0.036 Significant Supply Agility ← Partnership Strategic 0.097 0.069 1.392 0.024 Significant Manufacturing
Agility ←
Strategic
Partnership 0.061 0.064 0.935 0.040 Significant Distribution
Agility ←
Information
Sharing -0.107 0.068 -1.695 0.090
Not Significant Distribution
Agility ← Resilience 0.075 0.089 1.093 0.291
Not Significant Distribution
Agility ←
Sourcing
Flexibility 0.180 0.074 2.699 0.007 Significant Distribution
Agility ←
Order Fulfilment Flexibility
-0.121 0.063 -1.927 0.050 Significant
Supply Agility ← Information
Sharing 0.037 0.072 0.536 0.001 Significant Manufacturing
Agility ←
Information
Sharing 0.114 0.071 1.631 0.013 Significant Supply Agility ← Resilience 0.016 0.093 0.214 0.037 Significant Manufacturing
Agility ← Resilience 0.229 0.094 2.943 0.003 Significant
Supply Agility ← Sourcing
Flexibility 0.067 0.076 0.939 0.476
Not Significant Manufacturing
Agility ←
Sourcing
Flexibility -0.180 0.072 -2.590 0.010 Significant Supply Agility ←
Order Fulfilment Flexibility
0.095 0.066 1.386 0.189 Not
Significant Manufacturing
Agility ←
Order Fulfilment Flexibility
276
Result proves significant effect of strategic partnership on distribution agility, supply agility and manufacturing agility in value of P ˂ .05. The hypothesized relationship based on an existing relationship confirms the importance of building strategic partnerships upstream supply chain, operational level and the downstream supply chain (Cao and Zhang 2010; Simchi-Levi et al., 2008). Positive effect of information sharing on supply agility and manufacturing agility is also proved statistically significant which validates the literature (Bartlett et al., 2007). However, effect of information sharing on distribution agility is not statistically significant. The insignificant relationship between information sharing and distribution agility may be due to inadequate infrastructure that doesn’t support visibility and real time information sharing in logistics activities in Indian conditions (Jayaram and Avittathur, 2012). Resilience doesn’t positively influence the distribution agility. The possible reason may because resilience is more centric to manufacturers’ decision making capabilities (Sheffi, 2005). On the other hand resilience positively affects the supply agility and manufacturing agility with statistical significance, which confirms the role of manufacturer in building resilience (Sheffi, 2005) as well as the importance of sourcing decisions and supplier development for resilience (Christopher and Peck, 2004). Sourcing flexibility positively affects distribution agility and manufacturing agility at significance level ≤ .01. Order fulfillment flexibility also positively affects distribution agility and manufacturing agility at significance level ≤ .05. Results confirm the existing literature emphasizing on the sourcing flexibility and supply chain flexibility in bringing overall responsiveness (Thomé et al., 2014; Gosling et al., 2010). However, supply agility is not significantly affected by both sourcing flexibility and order fulfillment flexibility which can be because of the orientation of Indian companies more towards cost and quality factors (Joshi et al., 2013).
5. DISCUSSION AND CONCLUSION
The conventional view of supply chain management emphasizes efficiency in the process while a more modern view focuses on increasing agility, adapting changes, and aligning the objectives. An agile view of the supply chain enables responsiveness at all stages of the supply chain - supply, manufacturing, and distribution. This research has followed the same route and evaluated agility at the stages. The results have provided a mixed view where some relationships are proved and others are statistically not significant. For example, strategic partnership significantly affects all the stages of agility – supply, manufacturing, and distribution agility. It confirms that strategic partnerships between manufacturers and suppliers enhance suppliers’ response time to manufacturers. That increases manufacturers’ responsiveness and improves distribution and logistical performance. Strategic partnerships give suppliers better understanding and ability to cope with demand variability which improves their responsiveness. To back the argument, Cao and Zhang (2010) have described that supply chain partnering activities result in collaborative advantage which directly improves performance. The level of supply chain collaboration affects the level of operational performance
(Simatupang and Sridharan, 2004).
In general, the findings of this research focus on providing important implications for both practitioners and researchers. The framework for the stage-wise evaluation of agility in this research provides a theoretical foundation for researchers to establish a micro supply chain analysis approach. The study explores the key determinants vital to the performance of a supply chain. Interaction between determinants and stages of supply chain responsiveness offers insights into relationships for researchers and practitioners. There is a common consensus among many researchers that performance of the key determinants will affect the overall performance and agility of a supply chain. The study has some limitations too. The discussions and literature in the preceding sections of the paper sometimes state opinions and assumptions different from the obtained results. It can happen because of industry-specific data or due to revelations of new relationships in the stage-wise investigation.
277
hasn’t covered the longitudinal analysis. The responses might vary over the period of time which points to the limitation of this analysis. It is possible that time-based analysis might observe some difference in the findings. The current limitation of observations from the structural model emphasizes a time-based modeling approach while considering the variations among the parameters. The study provides scope for dynamic evaluation of the existing relationships for future research. It gives future research direction towards using time-based study either by utilizing real-time longitudinal data or through simulation and mathematical modeling techniques.
Funding: This study received no specific financial support.
Competing Interests: The authors declared that they have no conflict of interests.
Contributors/Acknowledgement: All authors participated equally in designing and estimation of current research.
Views and opinions expressed in this study are the views and opinions of the authors, Asian Journal of Empirical Research shall not be responsible or answerable for any loss, damage or liability etc. caused in relation to/arising out of the use of the content.
References
Balasubramanyam, V. N., & Wei, Y. (2005). Textiles and clothing exports from India and china: a comparative analysis. Journal of Chinese Economic and Business Studies, 3(1), 23-37. doi.org/10.1080/14765280500040427.
Barnes, L., & Lea-Greenwood, G. (2006). Fast fashioning the supply chain: shaping the research agenda. Journal of Fashion Marketing and Management: An International Journal, 10(3), 259-271. doi.org/10.1108/13612020610679259.
Barratt, M. (2004). Understanding the meaning of collaboration in the supply chain. Supply Chain Management: An International Journal, 9(1), 30-42. doi.org/10.1108/13598540410517566. Barratt, M., & Oke, A. (2007). Antecedents of supply chain visibility in retail supply chains: A
resource-based theory perspective. Journal of Operations Management, 25, 1217-1233. doi.org/10.1016/j.jom.2007.01.003.
Bartlett, P. A., Julien, D. M., & Baines, T. S. (2007). Improving supply chain performance through improved visibility. The International Journal of Logistics Management, 18(2), 294-313. doi.org/10.1108/09574090710816986.
Bhandari, A. K., & Ray, S. C. (2012). Technical efficiency in the Indian textiles industry: a non- parametric analysis of firm-level data. Bulletin of Economic Research, 64(1), 109-124. doi.org/10.1111/j.1467-8586.2010.00381.x.
Bhavani, T. A., & Tendulkar, S. D. (2001). Determinants of firm-level export performance: a case study of Indian textile garments and apparel industry. The Journal of International Trade & Economic Development, 10(1), 65-92. doi.org/10.1080/09638190010015278.
Bheda, R., Narag, A. S., & Singla, M. L. (2003). Apparel manufacturing: a strategy for productivity improvement. Journal of Fashion Marketing and Management: An International Journal, 7(1), 12-22. doi.org/10.1108/13612020310464331.
Bianchi, C., & Birtwistle, G. (2012). Consumer clothing disposal behaviour: a comparative studyijcs. International Journal of Consumer Studies, 36, 335-341. doi.org/10.1111/j.1470-6431.2011.01011.x
Bruce, M., & Daly, L. (2006). Buyer behaviour for fast fashion. Journal of Fashion Marketing and Management: An International Journal, 10, 329-344. doi.org/10.1108/13612020610679303. Brusset, X. (2016). Does supply chain visibility enhance agility? International Journal of
Production Economics, 171, 46–59. doi.org/10.1016/j.ijpe.2015.10.005.
Burke, G. J., & Vakharia, A. J. (2002). Supply chain management. In H. Bidgoli, Internet encyclopedia (pp. 620–634). New York: Wiley.
Cao, M., & Zhang, Q. (2010). Supply chain collaborative advantage: A firm’s perspective.
278
Chang, S., Witteloostuijin, A. V., & Eden, L. (2010). From the editors: common method variance in international business research. Journal of International Business Studies, 41, 178-184. doi.org/10.1057/jibs.2009.88.
Chopra, S., & Meindl, P. (2007). Supply chain management: strategy, planning and operation. New Jersey: Pearson.
Christopher, M. (2000). The agile supply chain: Competing in volatile markets. Industrial Marketing Management, 29, 37-44.
Christopher, M., & Peck, H. (2004). Building the resilient supply chain. International Journal of Logistics Management, 15(2), 1-13. doi.org/10.4324/9781351275088-3.
CRISIL Research. (2016). RMG industry - last link in textiles value chain. Mumbai: Crisil Research. Retrieved from
https://www.crisilresearch.com/industryasync.jspx?serviceId=505&State=null#storyId#1086
42#sectionId#2358#newsFeedId#undefined.
de Neve, G. (2009). Power, inequality and corporate social responsibility: the politics of ethical compliance in the south Indian garment industry. Economic and Political Weekly, 44(22), 63-71.
Deloitte. (2014). Indian logistics: focus on infrastructure creation to sustain and drive growth. New Delhi: Deloitte Touche Tohmatsu India Private Limited.
Fiksel, J. (2006). Sustainability and resilience: toward a systems approach. Sustainability: Science, Practice, & Policy, 2(2), 14-21. doi.org/10.1080/15487733.2006.11907980.
Fisher, M. L. (1997). What is the right supply chain for your product. Harvard Business Review, 75(2), 105-116.
Fornell, C., & Larcker, D. F. (1981). Evaluating structural equation models with unobservable variables and measurement error. Journal of marketing Research, 18(1), 39-50.
François, J., Okongwu, U., Deschamps, J., & Lauras, M. (2010). How do the key determinants of a distributed planning process impact on the performance of a supply Chain? In B. Vallespir, & T. Alix, Advances in Production Management Systems- New Challenges, New Approaches
(pp. 235-242). Germany: Springer.
Gerwin, D. (1993). Manufacturing flexibility: a strategic perspective. Management Science, 39(4), 395–410.
Godsell, J., Harrison, A., Emberson, C., & Storey, J. (2006). Customer responsive supply chain strategy: An unnatural act? International Journal of Logistics: Research and Applications, 9(1), 47–56. doi.org/10.1080/13675560500534664
Goetschalckx, M. (2011). Supply chain engineering. New York: Springer.
Gosling, J., Purvis, L., & Naim, M. M. (2010). Supply chain flexibility as a determinant of supplier selection. International Journal of Production Economics, 128, 11-21. doi.org/10.1016/j.ijpe.2009.08.029.
Gunasekaran, A., Lai, K., & Cheng, T. C. (2008). Responsive supply chain: A competitive strategy.
Omega, 36, 549-564.
Gupta, R., Jambunathan, S., & Netzer, T. (2010). Building India: transforming the nation's logistics in fracture. India: McKinsey & Company.
Horvath, L. (2001). Collaboration: the key to value creation in supply chain management. Supply Chain Management: An International Journal, 6(5), 205-207. doi.org/10.1108/eum0000000006039.
Hult, G. T., Craighead, C. W., & Ketchen Jr., D. J. (2010). Risk uncertainty and supply chain decisions: a real options perspective. Decision Sciences, 41(3), 435-458. doi.org/10.1111/j.1540-5915.2010.00276.x
Jacobs, F. R., & Chase, R. B. (2008). Operations and supply management: the core. New York: McGraw-Hill/Irwin.
Jayaram, J., & Avittathur, B. (2012). Insights into India. Supply Chain Management Review,
(July/August), 34-41.
279
Joshi, D., Nepal, B., Rathore, A. P., & Sharma, D. (2013). On supply chain competitiveness of Indian automotive component manufacturing industry. International Journal of Production Economics, 143, 151-161. doi.org/10.1016/j.ijpe.2012.12.023.
Joshi, R. N., & Singh, S. P. (2010). Estimation of total factor productivity in the Indian garment industry. Fashion Marketing and Management: An International Journal, 14(1), 145-160. doi.org/10.1108/13612021011025474.
Kamalahmadi, M., & Parast, M. M. (2016). A review of the literature on the principles of enterprise and supply chain resilience: Major findings and directions for future research. International Journal of Production Economics, 171, 116-133. doi.org/10.1016/j.ijpe.2015.10.023. Kim, D., & Lee, R. P. (2010). Systems collaboration and strategic collaboration: their impacts on
supply chain responsiveness and market performance. Decision Sciences, 41(4), 955-981. doi.org/10.1111/j.1540-5915.2010.00289.x.
Kim, D., Cavusgil, S. T., & Calantone, R. J. (2006). Information system innovations and supply chain management: Channel relationships and firm performance. Journal of Academy of Marketing Science, 34(1), 40-54.
Kim, M., Suresh, N. C., & Kocabasoglu-Hillmer, C. (2013). An impact of manufacturing flexibility and technological dimensions of manufacturing strategy on improving supply chain responsiveness: Business environment perspective. International Journal of Production Research, 51(18), 5597-5611.
Lee, H. L. (2002). Aligning supply chain strategies with product uncertainties. California Management Review, 44(3), 105-119.
Lee, H. L. (2004). The triple-A supply chain. Harvard business review, 82(10), 102-113.
Mackenzie, S. B., Podsakoff, P. M., & Podsakoff, N. P. (2011). Construct measurement and validation procedures in MIS and behavioral research: integrating new and existing techniques. MIS Quarterly, 35(2), 293-334.
Mahadevan, B. (2015). Operations management: theory and practice. Delhi, India: Pearson.
Malhotra, N., & Birks, D. (2007). Marketing Research: an applied approach: 3rd European Edition. Pearson education.
Martin, J. H., & Grbac, B. (2003). The effects of supplier focus, customer responsiveness and strategy type on growth in a transition economy. Journal of Marketing Theory and Practice, 11(2), 43-55.
Melnyk, S. A., Closs, D. J., Griffis, S. E., Zobel, C. W., & Macdonald, J. R. (2014). Understanding supply chain resilience. Supply Chain Management Review, 18(1), 34-41.
Mentzer, J. T., Dewitt, W., Keebler, J. S., Min, S., Nix, N., Smith, C. D., & Zacharia, Z. G. (2001). Defining supply chain management. Journal of Business Logistics, 22(2), 1-25.
Montoya-Torres, J. R., & Ortiz-Vargas, D. A. (2014). Collaboration and information sharing in dyadic supply chains: A literature review over the period 2000–2012. Estudios Gerenciales, 30, 343-354.
Moon, K. K., Yi, C. Y., & Ngai, E. (2012). An instrument for measuring supply chain flexibility for the textile and clothing companies. European Journal of Operational Research, 222, 191– 203.
Nunnally, J. C., & Bernstein, I. H. (1994). Psychometric theory 3rd ed. McGraw Hill, New York, USA.
Nurhayati, R., Taylor, G., & Tower, G. (2015). Investigating social and environmental disclosure practices by listed Indian textile firms. Journal of Developing Areas, 49(6), 361-372.
Qrunfleh, S., & Qrunfleh, M. (2014). Supply chain information systems strategy: Impacts on supply chain performance and firm performance. International Journal of Production Economics, 147, 340-350.
Rahman, Z. (2004). Use of Internet in supply chain management: a study of Indian companies’,
Industrial Management & Data Systems, 104(1), 31-41.
280
Saad, M., & Patel, B. (2006). An investigation of supply chain performance measurement in the Indian automotive sector. Benchmarking: An International Journal, 13(1/2), 36-53.
Sahay, B. S., & Mohan, R. (2003). Supply chain management practices in Indian industry.
International Journal of Physical Distribution & Logistics Management, 33(7), 582-606. Sahay, B. S., Cavale, V., & Mohan, R. (2003). The “Indian” supply chain architecture. Supply Chain
Management: An International Journal, 8(2), 93-106.
Sahay, B. S., Gupta, J. N., & Mohan, R. (2006). Managing supply chains for competitiveness: the Indian scenario. Supply Chain Management: An International Journal, 11(1), 15-24.
Saleeshya, P. G., & Raghuram, P. (2012). Lean manufacturing practices in textile industries – a case study. International Journal of Collaborative Enterprise, 3(1), 18-37. doi.org/10.1504/ijcent.2012.052367.
Sawik, T. (2013). Selection of resilient supply portfolio under disruption risks. Omega, 41, 259-269. Seth, D., & Panigrahi, A. (2015). Application and evaluation of packaging postponement strategy to
boost supply chain responsiveness: a case study. Production Planning & Control, 26(13), 1069-1089.
Sharma, R., Yetton, P., & Crawford, J. (2009). Estimating the effect of common method variance: the method-method prior technique with an illustration from TAM Research. MIS Quarterly, 33(3), 1-13.
Sheffi, Y. (2005). The resilient enterprise. Massachusetts: MIT Press.
Simatupang, T. M., & Sridharan, R. (2004). Benchmarking supply chain collaboration: An empirical study. Benchmarking: An International Journal, 11(5), 484-503. doi.org/10.1108/14635770410557717.
Simchi-Levi, D., Kaminsky, P., Simchi-Levi, E., & Shankar, R. (2008). Designing and managing the supply chain: concepts, strategies and case studies. Tata McGraw-Hill Education.
Sinkovics, R. R., Bryan, J. R., Roath, A. S., & Cavusgil, S. T. (2011). Does IT integration really enhance supplier responsiveness in global supply Chains? Management International Review, 51(2), 193-212.
Squire, B., Cousins, P. D., Lawson, B., & Brown, S. (2009). The effect of supplier manufacturing capabilities on buyer responsiveness: The role of collaboration. International Journal of Operations & Production Management, 29(8), 766-788.
Stigzelius, I., & Mark-Herbert, C. (2009). Tailoring corporate responsibility to suppliers: Managing SA8000 in Indian garment manufacturing. Scandinavian Journal of Management, 25, 46-56. Tang, C., & Tomlin, B. (2008). The power of flexibilityf or mitigating supply chain risks.
International Journal of Production Economics, 116, 12-27. doi.org/10.1057/9781137541253_8.
Thomé, A. M., Scavarda, L. F., Pires, S. R., Ceryno, P., & Klingebiel, K. (2014). A multi-tier study on supply chain flexibility in the automotive industry. International Journal of Production Economics, 158, 91–105.
Ülgen, V. S., & Forslund, H. (2015). Logistics performance management in textiles supply chains: best-practice and barriers. International Journal of Productivity and Performance Management, 64(1), 52-75. doi.org/10.1108/ijppm-01-2013-0019.
Vidalakis, C., & Sommerville, J. (2013). Transportation responsiveness and efficiency within the building supply chain. Building Research & Information, 41(4), 469-481. doi.org/10.1080/09613218.2012.715824.
Warmbrod, J. R. (2001). Conducting, interpreting, and reporting quantitative research. New Orleans, Louisiana: Research Pre-Session.
Williams, B. D., Roh, J., Tokar, T., & Swink, M. (2013). Leveraging supply chain visibility for responsiveness: The moderating role of internal integration. Journal of Operations Management, 31, 543-554. doi.org/10.1016/j.jom.2013.09.003
Williamson, P. J. (1991). Supplier strategy and customer responsiveness: Managing the links.
Business Strategy Review, 2(2), 75-90. doi.org/10.1111/j.1467-8616.1991.tb00153.x. Wong, C. Y., & Hvolby, H. H. (2007). Coordinated responsiveness for volatile toy supply chains.