Performance and Evaluation of Classification Data
Mining Techniques in Diabetes
Dr. D. Ashok Kumar#1 and R. Govindasamy#2
#1
Associate Professor and Head, Dept. of Computer Science, Government Arts and Science College,
Thiruchirapalli, India.
#2
, Assistant Professor, Department of Computer Science, Government Arts College,
Paramakudi , India
Abstract: Classification techniques have been widely usedin the medical field for accurate classification than an individual classifier. This paper presents computationalintelligence techniques for Diabetes Patient Classification. Thispaper evaluates the selected classification algorithms (Support Vector Machine, Regression, BayesNet, NaiveBayes and Decision Table) for the classification of diabetes patient datasets.The aim of this paper is to investigate the performance of different classification techniques.
This paper implements hybrid model construction andcomparative analysis for improving prediction accuracy of diabetes patients in three phases. In first phase, classificationalgorithms are applied on the original diabetes patient datasetscollected from UCI repository. In second phase, by the use offeature selection, a subset (data) of diabetes patient from wholediabetes patient datasets is obtained which comprises onlysignificant attributes and then applying selectedclassification algorithms on obtained, significant subset ofattributes. BayesNet algorithm is considered as the better performance algorithm, because it gives higher accuracy78.25% inrespective to other classification algorithms before applying feature selection. In third phase, the results of classification algorithms with and without feature selection are compared with each other. The results obtained from our experiments indicate that decision table algorithm outperformed all other techniques with the help of feature selection with an accuracy of 79.81%.
Key Words: Classification, Support Vector Machine, Regression, BayesNet, NaiveBayes, Decision Table, Healthcare, WEKA
1. INTRODUCTION:
Knowledge Discovery in Databases creates the context for developing the tools needed to control the flood of data facing organizations that depend on ever-growing databases of healthcare information. Knowledge Discovery has the preprocessing, Data mining and Post processing phases. KDD is the iterative or cyclic process that involves sequence of steps of processes and data mining is the core component of the KDD process. Data mining is a collection of techniques for efficient automated discovery of previously unknown, valid, novel, useful and understandable patterns in large databases. These patterns must be actionable so that may be used in an enterprise’s decision making [1].
Many researches are being carried out in applying data mining to variety of applications in healthcare. It has claimed that data mining may be able to identify factors that influence doctor’s ability to recommend new drugs on the market. Data mining analysis can be used to make business decisions that would improve cost, revenue and operational efficiency of healthcare industry while maintaining high levels of patient care.
There are several major data mining techniques have been developed and used in data mining. Data mining techniques are used in healthcare management for, Diagnosis and Treatment, Healthcare Resource Management, Customer Relationship Management and Fraud and Anomaly Detection. Data mining techniques can help Physicians identify effective treatments and best practices, and Patients receive better and more affordable healthcare services. There are some famous data mining methods are broadly classified as: On-LineAnalytical Processing (OLAP), Classification, Clustering, Association Rule Mining, Temporal Data Mining, Time Series Analysis, Spatial Mining, Web Mining etc.
These methods are used in different types of algorithms and data. The data source can be data warehouse, database, flat file or text file. The algorithms may be Statistical Algorithms, Decision Tree based, Nearest Neighbor, Neural Network based, Genetic Algorithms based, Ruled based, Support Vector Machine etc.
Data mining applications in healthcare can have tremendous potential and usefulness. However, the success of healthcare data mining hinges on the availability of clean healthcare data. In this respect, it is critical that the healthcare industry look into how data can be better captured, stored, prepared and mined. Possible directions include the standardization of clinical vocabulary and the sharing of data across organizations to enhance the benefits of healthcare data mining applications.
include heart disease, kidneyfailure, and damage to the eyes [2]. Insulin is one of the most important hormones in the body. It aids the body in converting sugar, starches and other food items into the energy needed for daily life. However, if the body does not produce or properly use insulin, the redundant amount of sugar will be driven out by urination. This disease is referred to diabetes. The cause of diabetes is a mystery; alt-hough obesity and lack of exercise appear to possibly play significant roles.
There are three maintypes of diabetes mellitus:
Type 1 DM results from the body's failure to produce insulin. This form was previously referred to as"insulin-dependent diabetes mellitus" (IDDM) or"juvenile diabetes". Type 2 DM results from insulin resistance, a condition in which cells fail to use insulin properly, sometimes also with an absolute insulin deficiency. This form was previously referred to as non insulin-dependent diabetes mellitus (NIDDM) or "adult-onset diabetes".
Type 3 Gestational diabetes is the third main form and occurs when pregnant women without a previous diagnosis of diabetes develop a high blood glucose level.
This paper is organized as follows: Section 2 discusses Knowledge discovery process and data mining. Section 3 discusses classification concepts. Section 4 discusses literature survey about diabetes classification Section 5 discusses conceptual framework and section 6 discusses feature selection section 7 discusses results and future work in section 7.
2. KNOWLEDGE DISCOVERY PROCESS AND DATA MINING Knowledge discovery in databases (KDD) is a process that allows automatic scanning of high-volume data in order to find useful patterns that can be considered as knowledge about the data. Once the discovered knowledge is presented, the evaluation measures can be improved, mining can be further "refined", new data can be selected or further transformed, or new data sources can be integrated in order to obtain different, the corresponding results. This is the process of converting low level information into high level knowledge. Therefore, KDD is a non-trivial extraction of implicit, previously unknown and potentially useful information from data that is located in databases. Although data mining and KDD are often treated as equivalent, in essence, data mining is an important step in the KDD process. The process of knowledge discovery involves the use of the database along with any selection, preprocessing, transformation, data mining and interpretation evaluation. Data mining component of the knowledge discovery process refers to the algorithmic means by which models are extracted and enumerated from the data [3].
Data Mining is one of the most vital and motivating area of research with the objective of finding meaningful information from huge data sets. In present era, Data Mining is becoming popular in healthcare field because there is a need of efficient analytical methodology for detecting unknown and valuable information in health data. In health industry, Data Mining provides several benefits such as detection of the fraud in health insurance, availability of medical solution to the patients at lower cost,
detection of causes of diseases and identification of medical treatment methods. It also helps the healthcare researchers for making efficient healthcare policies, constructing drug recommendation systems, developing health profiles of individuals etc. [3].
The data generated by the health organizations is very vast and complex due to which it is difficult to analyze the data in order to make important decision regarding patient health. This data contains details regarding hospitals, patients, medical claims, treatment cost etc. So, there is a need to generate a powerful tool for analyzing and extracting important information from this complex data. The analysis of health data improves the healthcare by enhancing the performance of patient management tasks. The outcome of Data Mining technologies are to provide benefits to healthcare organization for grouping the patients having similar type of diseases or health issues so that healthcare organization provides them effective treatments. It can also useful for predicting the length of stay of patients in hospital, for medical diagnosis and making plan for effective information system management.
Recent technologies are used in medical field to enhance the medical services in cost effective manner. Data mining techniques are also used to analyze the various factors that are responsible for diseases.
3. CLASSIFICATION CONCEPTS
Classification is a classic data mining task, with roots in machine learning. A typical application is: "Given past records of customers who switched to another supplier, predict which current customers are likely to do the same." This specific application is known as Churn Prediction, but there are very many other applications such as predicting response to a direct marketing campaign, separating good products from faulty ones etc. The "Classification Problem" involves data which is divided into two or more groups, or classes. In our example above, the two classes are "switched supplier" and "didn't switch". The data mining software is asked to tell us which of the groups a new example falls into. So, we might train the software using customer records from the last year, divided into our two groups. We then ask the software to predict which of our customers we're likely to lose. Of course, to ensure we can trust the predictions, there is generally a testing or validation stage as well.
CRISP-DM Methodology
Fig-1: CRISP-DM Phases
Data preparation phase constructs the final dataset that will be fed into the modeling tools. This includes table, record, and attribute selection as well as data cleaning and transformation. The modeling phase selects and applies various techniques, and calibrates their parameters to optimal values. The evaluation phase evaluates the model to ensure that it achieves the business objectives. The deployment phase specifies the tasks that are needed to use the models. [4]
4. LITERATURE SURVEY
A Research Paper given by SudajaiLowanichchai, SaisuneeJabjone, Tidanut Puthasimma, Informatic Program Faculty of Science and Technology Nakhon Ratchsima Rajabhat University it proposed the application Information technology of knowledge-based DSS for analysis diabetes of elderusing decision tree. The result showed that theRandomTree model has the highest accuracy in theclassification is 99.60 percent when compared with themedical diagnosis that the error MAE is 0.004 and RMSEis 0.0447. The NBTree model has lowest accuracy in the classification is 70.60 percent when compared with themedical diagnosis that the error MAE is 0.3327 and RMSEis 0.454 [5].
In another Research paper presented by Yang Guo ,GuohuaBai , Yan Hu School of computing Blekinge Institute of Technology Karlskrona, Sweden, Thediscovery of knowledge from medical databases isimportant in order to make effective medical diagnosis. Thedataset used was the Pima Indian diabetes dataset. Preprocessingwas used to improve the quality of data.Classifier was applied to the modified dataset to constructthe Naïve Bayes model. Finally weka was used to dosimulation, and the accuracy of the resulting model was 72.3%. [6].
In a Research paper presented by Ashwinkumar.U.M and Dr Anandakumar. K.R.Reva Institute of Technology and Management, Bangalore S J B Institute of Technology,
Bangalore. This Paper has proposed a novel learning algorithm i+Learning as well as i+LRA, which apparently achieves the highest classification accuracy overID3 algorithm.
Literature Review on Diabetes, by National Public health: Women tend to be hardest hit by diabetes with 9.6million women having diabetes. This represents 8.8% of the adult population of women 18 years of age and older in 2003 and a two fold increase from 1995 (4.7%).. By 2050, the projected numbers of all persons with diabetes will have increased from 17 million to 29 million. [7]
5. CONCEPTUAL FRAMEWORK
Classification algorithms are widely used in various medical applications. Data classification is a two phase process in which first step is the training phase where the classifier algorithm builds classifier with the training set of tuples and the second phase is classification phase where the model is used for classification and its performance is analyzed with the testing set of tuples [8]. Classification is done to know the exactly how data is being classified. The Classify Tab is also supported which shows the list of machine learning algorithms. These algorithms in general operate on a classification algorithm and run it multiple times manipulating algorithm parameters or input data weight to increase the accuracy of the classifier. Two learning performance evaluators are included with WEKA. The first simply splits a dataset into training and test data, while the second performs cross-validation using folds. Evaluation is usually described by the accuracy [9].
The following techniques are applied to classify the diabetes Patient:
5.1 Support Vector Machine (SVM)
The concept of SVM is given by Vapnik et al., which is based on statistical learning theory. SVMs were initially developed for binary classification but it could be efficiently extended for multiclass problems. SVM or sequential minimal optimization (SMO) is alearning system that uses a hypothesis space of linearfunctions in a high dimensional space, trained with alearning algorithm from optimization theory thatimplements a learning bias derived from statisticallearning theory [19]. SVM uses a linear model to implement non-linear class boundaries by mapping inputvectors non-linearly into a high dimensional feature space using kernels. The training examples that are closest to themaximum margin hyper plane are called support vectors.All other training examples are irrelevant for defining thebinary class boundaries. The support vectors are then usedto construct an optimal linear separating hyper plane (incase of pattern recognition) or a linear regression function (in case of regression) in this feature space.[10]
5.2 Regression
independent variable may be one or more than one. Regression is a statistical method which investigates relationships between variables. By using Regression dependences of one variable upon others may be established. Based on number of independent variables regression is of two types, one is Linear and another one is Non-linear. Linear regression identifies relation of a dependent variable and one or more independent variables. It is based on a model which utilizes linear function for its construction. Linear regression finds out a line and calculates vertical distances of points from the line and minimize sum of square of vertical distance. In this approach dependent and independent variables are already known and purpose is to spot a line that correlates between these variables. But, linear regression is limited to numerical data only and cannot be use for categorical data. Logistic regression, a type of non-linear regression can accept categorical data and predicts the probability of occurrence using logit function. Logistic regression is of two types, one is Binomial and other is multinomial. Binomial regression predicts the result for a dependent variable when there occurs only two possible outcomes such as either a person is dead or alive while the multinomial handles the situation when dependent variable has three or more outcome. For example either a patient is at ‘low risk’, ‘medium risk’ and ‘high risk’. Logistic regression does not consider linear relationship between variables. Regression is widely used in medical field for predicting the diseases or survivability of a patient.[11] 5.3 Bayesian Network classifier
Bayesian networks are a powerful probabilistic representation, and their use for classification has received considerable attention. This classifier learns from training data the conditional probability of each attribute Ai given the class label C. Classification is then done by applying Bayes rule to compute the probability of C given the particular instances of A1…..An and then predicting the class with the highest posterior probability. The goal of classification is to correctly predict the value of a designated discrete class variable given a vector of predictors or attributes. In particular, the naive Bayes classifier is a Bayesian network where the class has no parents and each attribute has the class as its sole parent. 5.4 Decision Table
In this section, we introduce a new type of classifier, thedecision table.
Definition: Decision table for data set D with nattributes A1, A2, ...,An is a table with schema R (A1, A2,..., An, Class, Sup, Conf). A row Ri= ( a1i, a2i, ..., ani, ci,supi, confi) in table R represents a classification rule, where aij(1 j n) can be either from DOM(Ai) or aspecial value ANY, ci { c1, c2, ..., cm}, minsup supi 1, and minconf confi 1 and minsup and minconf are predetermined thresholds. The interpretation of the rule is if (A1 = a1) and (A2 = a2) and … and (An= an) then class= ci with probability confi and having support supi,whereai ANY, 1 j n.
The decision table generated is to be used to classifyunseen data samples. To classify an unseen data sample, u(a1u, a2u, ...,anu), the decision table is searched to findrows that matches u. That is, to find rows whose attributevalues are
either ANY or equal to the correspondingattribute values of u. Unlike decision trees where thesearch will follow one path from the root to one leaf node,searching for the matches in a decision table could resultin none, one or more matching rows.
One matching row is found: If there is only one row,
ri(a1i, a2i, ..., ani, ci, supi, confi) in the decision table thatmatches u (a1u, a2u, ..., anu), then the class of u is ci.
More than one matching row is found: When more thanone matching rows found for a given sample, there are anumber of alternatives to assign the class label. Assumethat k matching rows are found and the class label, support and confidence for row i is ci, supi and confi respectively. The class of the sample, cu, can be assignedin one of the following ways.
(1) based on confidence and support: k
Cu ={ ci |confi = max confj } j=1
If there are ties inconfidence, the class with highest support will beassigned to cu. If there are still ties, one randomlypicked from them will be assigned to cu. (2) based on weighted confidence and support: k
Cu ={ ci |confi* supi= max confj*supi} j=1
The ties are treated similarly.Note that, if the decision table is sorted on (Conf, Sup), it is easy to implement the first method. We can simplyassign the class of the first matching row to the sample tobe classified. In fact, our experiments indicated that this simple method provides no worse performance thanothers.
No matching row is found: In most classification applications, the training samples cannot cover the wholedata space. The decision table generated by grouping andcounting may not cover all possible data samples. Forsuch samples, no matching row will be found in thedecision table. To classify such samples, the simplestmethod is to use the default class. However, there are other alternatives. For example, we can first find a rowthat is the nearest neighbor (in certain distance metrics) of the sample in the decision table and then assign the same class label to the sample. The drawback of using nearest neighbor is its computational complexity.[12]
6. FEATURE SELECTION
This paper gives solution of three problems which are faced in classification/prediction of diabetes disease patients. These three problems are:
A. Applying Classification Algorithm without
FeatureSelection
Applying selected classification algorithms on the original Indian Diabetes Patient Datasets (ILPD), this comprised of all relevant and irrelevant attributes without feature selection of diabetes patients. The result of all these techniques are obtained and analyzed in the form of accuracy of these classification algorithms.
B. Applying Classification Algorithm after FeatureSelection
In this, attribute or feature selection is done with the help of greedy stepwise approach. The whole datasets of diabetes patients is comprised of all relevant or irrelevant attributes. By the use of feature selection, a subset (data )of diabetes
patient from whole diabetes patient datasets will be obtained which comprises only significant attributes. Applying selected classification algorithms on the obtained significant subset of attributes after feature selection of IDPD datasets. The result of all these techniques are obtained and analyzed in the form of accuracy of these classification algorithms.
C. Comparative Analysis for Improving PredictionAccuracy
In this, the results of classification algorithms with and without feature selection are compared with each other. A particular classification algorithm is identified by comparative analysis of all algorithm accuracies which improves prediction accuracy of diabetes patients. The figurative approach for performing these tasks is shown in figure 1.
Figure 1: Hybrid Model Construction and Comparative Analysis for Improving Prediction Accuracy Feature Selection Diabetes Patient
Database
Classification Algorithms Support Vector
Regression BayesNet NaiveBayes Decision Table
New Significant Datasets (Subset of Attributes)
Comparative Analysis For
Accuracy
Classification Algorithm Which Improves Accuracy
Classification Algorithms Support Vector
7. RESULTS AND DISCUSSIONS
7.1 Significance of the problem
The questions this research work can provide the solutions to, can be given as follows:
1) How hybrid model construction is performed? 2) How feature selection applied on diabetes datasets? 3) How Comparative analysis of classificationalgorithms is performed for improving prediction accuracy of diabetes patients with or without FeatureSelection?
This paper finds answers to these questions which can diabetes help to know the various aspects about classification ofliver patients. By performing this work, it is shown thatfeature selection has a great significance as the process ofselecting a subset of relevant features for use in modelconstruction. By using feature selection on PIDD before aclassification algorithm can be applied, performance ofclassification algorithm increases.
7.2 Preparing the Dataset
The proposed hybrid model will be validated on Pima Indians Diabetes Dataset (PIDD), sourced from UCI Machine Learning Repository [17]. This dataset consists of medical information on 768 female patients of Pima Indians heritage. In particular, the database comprises 8 attributes (all numeric-valued) related to personal and medical features and one class valued 0 (interpreted as “tested negative for diabetes”) or 1 (interpreted as “tested positive for diabetes”). Out of 768 instances, 500 patients were tested negative for diabetes and the remaining268 patients were tested positive for diabetes. Table 1 show the mentioned 8 attributes including the class for this dataset.
Attributes / Class Abbreviation
Number of times pregnant preg
Plasma glucose concentration a 2 hours
in an oral glucose tolerance test plasma Diastolic blood pressure (mm Hg) pres Triceps skin fold thickness (mm) skin 2-Hour serum insulin (mu U/ml) insu Body mass index (weight in Kg/Height
in m)2 mass
Diabetes pedigree function pedi
Age (Years) age
Class variable (0=Tested Negative or
1=Tested Positive) class
Table 1: Attributes and Classes for PIDD
7.3 Results
A. Applying Classification Algorithm without Feature Selection
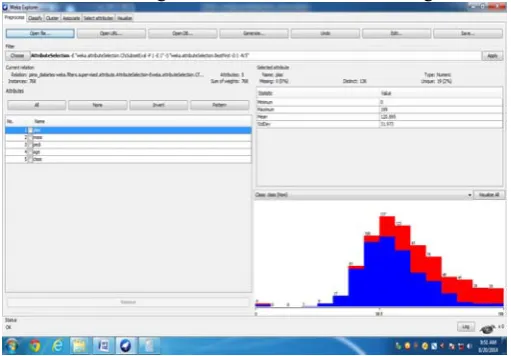
Applying various classification algorithms such as Support Vector Machine, Regression,BayesNet, NaiveBayes, Decision Table on the original Indian Diabetes Patient Datasets (IDPD), this comprised of all relevant and irrelevant attributes without feature selection of diabetes patients as shown in figure 2.
Table 2 consists of values of different Classification algorithms. According to these values the accuracy is calculated and analyzed. Performance can be determined based on the Correctly Classified Instances, Incorrectly Classified Instances, Mean absolute error and Accuracy. Comparison is made among these classification algorithms
out of which BayesNet algorithm is considered as the better performance algorithm. Because it gives higher accuracy in respective to other classification algorithms without feature selection: with an accuracy of 78.25%.
Figure 2: Hybrid Model Construction before Applying Feature Selection
Classification Algorithm
Correctly Classified Instances
Incorrectly Classified Instances
Mean Absolute
Error
Accuracy
Support Vector
Machine 595 173 0.2253 77.47%
Regression 594 174 0.3243 77.34%
BayesNet 601 167 0.2707 78.25%
Naïve Bayes 586 182 0.2811 76.30%
Decision Table 596 172 0.3223 77.60%
Table 2: Accuracy for Classification Algorithm before Applying Feature Selection
B. Applying Classification Algorithm after Feature Selection
Attribute or feature selection is done with the help of greedy stepwise approach. The whole datasets of diabetes patients is comprised of all relevant or irrelevant attributes. By the use of feature selection, a subset (data) of diabetes patient from whole diabetes patient datasets will be obtained which comprises only significant attributes.
Applying feature selection or attribute selection using Greedy Stepwise Technique on 9 attributes. This results in the selection of 5 significant attributes as shown in figure 3.
Feature Selection Correctly Classified Instances Incorrectly Classified Instances Mean absolute Error Accuracy Cla ssifica tio n Algorit hm Support
Vector 597 171 0.2227 77.73%
Regression 596 172 0.3335 77.60% BayesNet 601 167 0.2707 78.25% Naïve
Bayes 596 172 0.296 77.60%
Decision
Table 613 155 0.2707 79.81%
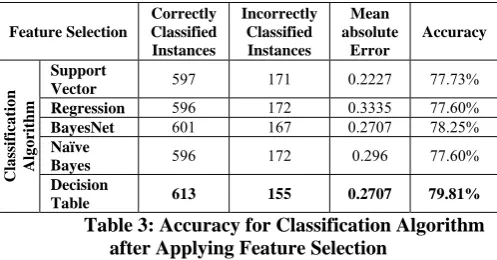
Table 3: Accuracy for Classification Algorithm after Applying Feature Selection
Table 3 consists of values of different Classification algorithms. Comparison is made among these classification algorithms out of which Random Decision Tableis considered as the better performance algorithm. Because it gives higher accuracy in respective to other classification algorithms after applying feature selection: with an accuracy of 79.81%.
C. Comparative Analysis for Improving Prediction Accuracy
The results of classification algorithms before and after applying feature selection are compared with each other which are obtained from Table 1 and Table 2.Thus, a particular classification algorithm is identified by comparative analysis which improves prediction accuracy of diabetes patients.
Table 4 consists of values of different Classification algorithms. According to these values the accuracy is calculated and analyzed. Performance can be determined based on accuracy. Comparison is made among these classification algorithms before and after applying feature selection, out of which Decision Table algorithm
outperformed all other techniques with 79.81% accuracy after applying Feature Selection
Classification Algorithm Accuracy Before Feature Selection After Feature Selection
Support Vector 77.47% 77.73%
Regression 77.34% 77.60%
BayesNet 78.25% 78.25%
Naïve Bayes 76.30% 77.60%
Decision Table 77.60% 79.81%
Table 4: Prediction Accuracy Improves For
Classification Algorithm after Applying Feature Selection
7.4 Confusion matrix
A confusion matrix contains information about actual and predicted classifications done by a classification system. Performance of such systems is commonly evaluated using the data in the matrix. The following table shows the confusion matrix for a two class classifier [19].
Predicted Class
TP FP FN TN
P N
Confusion Matrix
True positive (TP)- These are the positive tuples thatwere correctly labeled by the classifier [19].If theoutcome from a prediction is p and the actual value isalso p, then it is called a true positive (TP)[18].
True Negative (TN)-These are the negative tuples that were correctly labeled by the classifier [19].
False Positive (FP)-These are the negative tuples thatwere incorrectly labeled as positive. However if theactual value is n then it is said to be a false positive (FP) [18].
False Negative (FN)-These are the positive tuples thatwere mislabeled as negative [19].
Accuracy is calculated as
(TP+TN)/(P+N) Where, P=TP+FN and N=FP+TN. Or TP+TN/(TOTAL)
8. FUTURE WORK
This paper presents an approach that will be used for hybrid model construction of community health services. These classification algorithms can be implemented for other dominant diseases prediction and classification. An another scope is to seeing whether by applying new algorithms will made any improvements over techniques which are used in this paper in future.
REFERENCES
[1] Fayyad, U, Data Mining and Knowledge Discovery in Databases: Implications for scientific databases, Proc. of the 9th Int. Conf. on Scientific and Statistical Database Management, Olympia, Washington, USA, 2-11, 1997.
[2] en.wikipedia.org/wiki/Diabetes_mellitus
[3] H. C. Koh and G. Tan, “Data Mining Application in Healthcare”, Journal of Healthcare Information Management, vol. 19, no. 2,(2005).
[4] N. AdityaSundar,P. PushpaLatha, M. Rma Chandra “Performance Analysis of Classification Data Mining Techniques over Heart Disease Database “, International Journal of Engineering Science and Advanced Technology,Vol 2, Issue 3, p470-478,May-June 2012
[5] SudajaiLowanichchai, SaisuneeJabjone, TidanutPuthasimma,
”Knowledge-based DSS for an Analysis Diabetes of Elder using Decision Tree”
[6] Yang Guo , GuohuaBai , Yan Hu School of computing Blekinge Institute of Technology Karlskrona, Sweden, “Using Bayes Network for Prediction of Type-2 Diabetes”
[7] Beckles GLA, Thompson-Reid PE, editors. Diabetes and Women’s Health Across the Life Stages: A Public Health Perspective. Atlanta: U.S. Department of Health and Human Services, Centers for Disease Control and Prevention, National Center for Chronic Disease Prevention and Health Promotion,
[8] Mitchell TM. Machine learning. Boston, MA: McGraw-Hill,1997. [9] P.Rajeswari and G.SophiaReena,”Analysis Of Liver Disorder Using
Data Mining Algorithm”, Global Journal Of Computer Science And Technology, Vol. 10 Issue 14 (Ver. 1.0) November 2010.
[10] John C. Platt,” Sequential Minimal Optimization: A FastAlgorithm for Training Support Vector Machines”, Technical Report, April 21, 1998
[11] DivyaTomar and SonaliAgarwal, “A survey on Data Mining approaches for Healthcare”, International Journal of Bio-Science and Bio-Technology Vol.5, No.5 (2013), pp. 241-266
[12] HongjunLu ,HongyanLiu,”Decision Tables: Scalable
ClassificationExploring RDBMS Capabilities”,Proceedings of the 26th International Conference on Very Large Databases, Cairo, Egypt, 2000
[13] Jihoon Yang and VasantHonavar, ”Feature Subset Selection
UsingGenetic Algorithm”, Artificial Intelligence Research Group. [14] Isabelle Guyon and Andr´eElisseeff,” An Introduction to Variable
and Feature Selection”, Journal of Machine Learning Research 3(2003) 1157-1182.
[15] HuanLiu,HiroshiMotoda and Rudy Setiono,”Feature Selection:An Ever Evolving Frontier in Data Mining”,JMLR: Workshop
andConference Proceedings 10: 4-13 The Fourth Workshop on FeatureSelection in Data Mining
[16] Andreas G. K. Janecek ,Wilfried N. Gansterer and Michael A.Demel,”On the Relationship Between Feature Selection and Classification Accuracy”,JMLR: Workshop and Conference Proceedings 4: 90-105.
[17] http://archive.ics.uci.edu/ml/
[18]. SapnaJain,MAfsharAalam,M. N Doja,”K-MEANS CLUSTERING USING WEKA INTERFACE”, Proceedings of the 4th National Conference; INDIACom-2010 Computing For Nation Development, February 25 – 26, 2010