In-medium properties of mesons
VolkerMetag1,2,,MarianaNanova1,, andKai-ThomasBrinkmann1, 1II. Physikalisches Institut, Universität Gießen, Germany
2Helmholtz Institut für Strahlen- und Kernphysik, Universität Bonn, Germany
Abstract.In the projectB.4, the modification of meson properties (mass, width) in a nuclear medium has been studied in photoproduction of mesons offnuclear targets. This work has been motivated by theoretical expecta-tions of in-medium modificaexpecta-tions of hadrons based on the conjecture of a partial restoration of chiral symmetry in a strongly interacting medium. It has been shown that these in-medium changes can be discussed in a com-pact form in terms of an optical potential describing the meson-nucleus interaction. Experimental approaches to determine the real and imaginary part of the meson-nucleus potential have been developed. The experiments have been performed with the Crystal Barrel/TAPS detector at the electron accelerator ELSA (Bonn) and the Crystal Ball/TAPS detector at MAMI (Mainz). Measuring the excitation function and momentum distribution for photo production ofωandηmesons, the real parts of theωandη-nucleus potential, given by the in-medium mass shift, have been determined. For theηmeson a lowering of the mass at normal nuclear matter density by -(39±7(stat)±15(syst)) MeV is observed, while for theωmeson a slightly smaller mass shift is found, however, with much larger uncertainties, not excluding a zero mass shift. The imaginary part of the potentials has been extracted from the measurement of the transparency ratio which compares the meson production cross section per nucleon within a nucleus to the production cross section offthe free proton. For theηmeson the imaginary part of the potential is found to be smaller than the real part. In case of theωmeson the opposite is observed. This makes theη meson a good candidate for the search for meson-nucleus bound states while no resolved ωmesic states can be expected. The results are compared with theoretical predictions. An outlook on future experiments is given.
1 Introduction
The interaction of mesons with nuclei is an important test-ing ground for our understandtest-ing of Quantum Chromody-namics (QCD) as the theory of the strong interaction in the non-perturbative regime. Research in this field was motivated in particular by theoretical predictions that me-son properties might change within nuclei due to a par-tial restoration of chiral symmetry [1–3]. Mesons are considered to be excitations of the QCD vacuum which has a complicated structure with non-vanishing chiral-, gluon- and higher order quark-condensates. These con-densates are predicted to change within a strongly inter-acting medium and, as a consequence, also the excitation energy spectrum, i.e. the mass spectrum of mesons is ex-pected to be modified. This idea fostered widespread the-oretical and experimental activities which have been sum-marized in recent reviews [4–6].
Pseudoscalar mesons are particularly suited for study-ing in-medium modifications, as shown in Fig. 1 [7]. Spontaneous chiral symmetry breaking generates a pseudo scalar nonet (π,K,K¯, η, η) of massless Goldstone bosons. The explicit breaking of the U(1)A symmetry selectively
e-mail: [email protected] e-mail: [email protected] e-mail: [email protected]
Mass [GeV]
spontaneous U(3)L x U(3)R breaking
m0i = 0
, K, η0, η8
1000
800
600
400
200
0
η0
, K, η8
U(1)A breaking
mi = 0 0
SU(3)L x SU(3)R Goldstone
bosons
SU(3)L x SU(3)R Goldstone
bosons
SU(3)F breaking mu≈ 2.3 MeV md≈ 4.8 MeV
ms≈ 95 MeV 0 0
K
η η’
0
Figure 1. Symmetry breaking pattern for pseudoscalar mesons as described in the text, adapted from [7].
a partial restoration of this symmetry in a strongly inter-acting medium.
If spontaneously broken chiral symmetry were re-stored at high nuclear densities one would expect masses of vector mesons with spin parity Jπ =1−to become de-generate in mass with their chiral partners with the same spin but opposite parity, the axial vector mesons with Jπ =1+. Traces of this tendency should already show up at normal nuclear matter density and should thus become ob-servable in photonuclear experiments
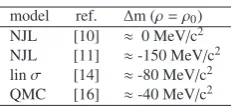
Many theory groups, using QCD-sum rules[3, 9] as well as various hadronic models such as the Nambu-Jona-Lasinio (NJL)-model [1, 10–13], the linear sigma model [14], the quark-meson-coupling model [15, 16], and cou-pled channel resonance models [17, 18] have made quan-titative, but partially conflicting predictions for changes in mass and width of mesons in nuclei. As an example for the many calculations, the results obtained for theη me-son by Nagahiro et al. and for theωmeson by Mühlich et al. are shown in Fig. 2 and Fig 3, respectively. Nagahiro et al.[11], applying the NJL model, predict a mass drop by≈ 150 MeV for the η meson at normal nuclear mat-ter density. Within the coupled channel resonance model, Mühlich et al.[18] find a strong broadening but almost no mass shift for theωmeson at saturation density. The broad range of predictions is summarized in table 1 for the η meson and in table 2 for theωmeson, respectively. This spread in theoretical predictions calls for an experimental clarification.
Figure 2. Meson masses calculated within the NJL model as function of the nuclear densityρ, normalized to the normal nu-clear densityρ0, for SU(2) symmetric matter (thick curves) and SU(3) symmetric matter (thin curves) [11].
It should be noted that most of these theoretical predic-tions have been calculated under idealized assumppredic-tions,
Figure 3.The spectral function for anωat rest, calculated within the coupled-channel resonance model for normal nuclear matter densityρ = ρ0 (solid curve) and for ρ = 2ρ0 (dashed curve) in comparison to the spectral function of a freeωmeson (dot-ted) [18].
Table 1.predictions for mass modifcations of theηmeson at normal nuclear matter density.
model ref. Δm (ρ=ρ0) NJL [10] ≈ 0 MeV/c2 NJL [11] ≈-150 MeV/c2 linσ [14] ≈-80 MeV/c2 QMC [16] ≈-40 MeV/c2
Table 2.predictions for mass modifications of theωmeson at normal nuclear matter density.
model ref. Δm (ρ=ρ0) Γ(ρ=ρ0) NJL [1] ≈0 MeV/c2
QCD SR [3] ≈-120 MeV/c2
Le f f [13] ≈-(100-150) MeV/c2 ≈40 MeV res. coupl. [17] ≈-50 MeV/c2 ≈40 MeV res. coupl. [18] ≈0 MeV/c2 ≈60 MeV
χunitary [19] 100-200 MeV
many-body [20] 150-200 MeV
e.g. for a meson at rest in infinitely extended nuclear matter with constant density, a scenario far from reality. In photoproduction experiments in the 1-3 GeV energy range, the kinematics of the reaction leads to meson recoil momenta on average comparable to their mass; on the way out of the nucleus mesons see the nuclear density profile with a fall-offat the surface. Any density dependent mass shift or broadening is thereby smeared out due to the vari-ation in density. A link between the theoretical predictions and the experimental observables is provided by transport calculations like, e.g. GiBUU [21]. These calculations take nuclear many-body effects into account which evolve dynamically in the course of the reaction. In particular they treat
- initial state effects: the absorption of incoming beam par-ticles
- non equilibrium effects: varying density and temperature - absorption and regeneration of mesons
- fraction of decays outside of the nucleus DOI: 10.1051/
,03003 (2017) 713403003
EPJ Web of Conferences 134 epjconf/201
- final state interactions: distortion of momenta of decay products.
It is indispensable to investigate with transport calcula-tions how the above mentioned effects change the theoreti-cally predicted initial signals before a meaningful compar-ison with experimental data can be performed to extract medium modifications of hadrons.
For long-lived mesons such as pions or kaons, meson beams can be used to study the meson-nucleus interaction experimentally. This is not possible for short-lived mesons likeη, ω,andηmesons where such beams are not avail-able. Here, one has to produce the mesons in a nuclear reaction and to study their interaction with nucleons or nu-clei in the final state. The meson-nucleus interaction and the in-medium modifications of mesons can be described by an optical potential
U(r)=V(r)+iW(r), (1)
comprising a real (V(r)) and an imaginary (W(r)) part [11];
ris the distance between the meson and the centre of the nucleus. In this presentation we discuss the determination of the real and imaginary part of theω- andη- nucleus potential in photo production experiments offnuclei.
2 Experimental approaches to study
mesons in the medium
The strength of the real part of the meson-nucleus potential is connected to the meson in-medium mass shiftΔm(ρ0) at
saturation densityρ0[11]
V(r)= Δm(ρ0)·c2·ρ
(r)
ρ0 .
(2)
The imaginary part of the potential describes the meson absorption in the medium via inelastic channels and is re-lated to the in-medium widthΓ0of the meson at nuclear
saturation density by [22]
W(r)=−1 2Γ0·
ρ(r)
ρ0
. (3)
The experimental approaches to determine the real part of the potential listed below are applied forωandηmesons and the results will be discussed later in this paper: - line shape analysis
- excitation function of the meson - momentum distribution
- meson-nucleus bound states
The theoretical predictions discussed in the introduc-tion inspired many experiments searching for medium modifications like broadening, structures or mass shift. The experiments have focused on the light vector mesons
ρ,ω andφwith decay lengths comparable to nuclear di-mensions. The mass distribution μ(p, ρ) depends on the 3-momentumpof the vector meson and on the densityρ of the nuclear medium at the decay point. Only mesons de-caying inside the nucleus carry information on in-medium properties which are to be studied. An in-medium mass
shift of the meson could be observed by comparing the mass calculated from Eq. (4) in the limit of low meson mo-menta with the vacuum mass of this meson listed in [23].
μ(p, ρ)=
(p1+p2)2. (4)
The light vector mesonsρ, ωandΦare particularly suited for the mass distribution measurements since their life-times of 1.3 fm/c, 23 fm/c and 46 fm/c, respectively, are so short that they decay within the nuclear medium with some probability after production in a nuclear reaction. Never-theless, momentum cuts have to be applied for the longer livedωandΦmesons to achieve decay lengths compara-ble to nuclear dimensions. Obviously the line shape anal-ysis is not applicable forηmeson in the medium since its decay length is much larger than nuclear dimensions. In case of mesons with long lifetime decaying outside of the nucleus this method is not applicable since the information gained is the vacuum spectral function. The experimental results on the line shape analysis from the B4 project will be presented and discussed in section 5.2.1.
Weil et al. [24] discussed the possibility to extract infor-mation on the in-medium meson mass and the real part of the meson-nucleus potential from a measurement of the excitation function and/or momentum distribution of mesons in the photo production off a nucleus. Due to a lowering of the meson mass in the medium the meson production threshold will decrease and the enlarged phase space will lead consequently to increasing the production cross section for a given incident beam energy as com-pared to a scenario without mass shift. The dropping of the meson mass in the medium also affects the momentum distribution of the produced meson in the final state. When a meson is produced with a lower mass, then its total en-ergy is on average also reduced due to kinematics. In ad-dition, mesons produced within the nuclear medium must regain their free mass upon leaving the nucleus. Thus, in case of an in-medium mass drop, this mass difference has to be compensated at the expense of their kinetic en-ergy. GiBUU transport-model calculations [24] demon-strated that there will be a downward shift in the momen-tum distribution for near-threshold energies as compared to a scenario without mass shift. A mass shift can thus be indirectly inferred from a measurement of the excita-tion funcexcita-tion as well as from the momentum distribuexcita-tion of the meson. This idea, initially worked out forωmesons [24], has independently been pursued on a quantitative level for η mesons by E. Paryev [25]. The experimen-tal results about the determination of the real part ofωand
ηmesons from excitation functions and momentum
dis-tributions will be presented and discussed in sections 5.2.2 and 5.2.3.
-nucleus bound states will be discussed in section 6. The experimental observable for the imaginary part of the meson-nucleus optical potential is the transparency ratio measurement. As a definition, the transparency ratio com-pares the meson production cross section off a nucleon within a nucleus with the one offthe free nucleon [26]:
Tm A =
σγA→mX A·σγN→mX.
(5)
Here, the nucleus serves as a target and at the same time as an absorber. If nuclei were completely transparent to the mesons the transparency ratio would be unity, as long as secondary production processes can be ignored. The re-sults on the imaginary part of theω- andη-nucleus optical potential will be discussed in section 5.3.
3 Experimental setup
The data onωandηphotoproduction were taken in a se-ries of experiments in 2003, 2007, 2009 and 2013/14 with the Crystal Barrel/TAPS detector system at the ELSA ac-celerator in Bonn and in 2007, 2008 with the Crystal Ball and TAPS detector system at MAMI-C in Mainz.
3.1 CBELSA/TAPS Detector system
The electron stretcher facility ELSA [27, 28] provides electrons with energy E0 which hit a primary radiation
target, a thin copper or diamond crystal, and produce bremsstrahlung [29]. The energy of the bremsstrahlung photons is determined eventwise from the deflection of the scattered electrons in a magnetic field. From the energy of the scattered electron Ee− the energy of the photon
impinging on the nuclear target is given byEγ =E0−E−e.
Photons were tagged in the energy range from 0.5 GeV up to 3.1 GeV for an incoming electron energy of 3.2 GeV. The total tagged photon intensity was about 107 s−1 in
this energy range. The part of the electron beam that did not produce any bremsstrahlung photons was deflected by the magnet as well. Since these electrons retained their full energy the curvature of their track is smaller and they passed over the tagger into a beam dump.
The Crystal Barrel and TAPS detector system at ELSA accelerator in Bonn used for data taking in 2003 is shown in Fig. 4 (left). The Crystal Barrel (CB) detector, a photon calorimeter consisting of 1290 CsI(Tl) crystals (≈16 radiation lengths), covered the complete azimuthal angle and the polar angle from 30◦ to 168◦ [30]. The scintillating fibre-detector, surrounding the target in the center of the CB, was used to register charged particles [31]. The CB was combined with a forward detector -the TAPS calorimeter - consisting of 528 hexagonal BaF2
crystals (≈12 X0), covering polar angles between 5◦ and
30◦ and the complete azimuthal angle [32, 33]. In front of each BaF2module a 5 mm thick plastic scintillator was
mounted for the identification of charged particles. The CB and TAPS detector system at ELSA used for data taking in 2007, 2009, 2013 and 2014, shown in Fig. 4 (right) is a new updated version of the first setup (Fig. 4
(left)). The main difference is the smaller TAPS detector (MiniTAPS), consisting of 216 BaF2 modules, covering
the angular range in the forward direction of 1◦ to 11◦. In the range of 11◦-28◦ the CsI(Tl) modules from CB (Forward Plug FP) were read out by photomultipliers, providing energy and time information while the rest of the CB crystals were read out by photodiodes with energy information only. A more detailed description of the detector setups and the running conditions can be found in [34–38].
Because of the high granularity and the large solid angle coverage of ≈96%, both detector system versions were ideally suited for the detection and reconstruction of multi-photon events.
Solid targets of 12C, 40Ca, 93Nb and 208Pb, used in the
experiments, were mounted in the center of the CB.
3.2 CB/TAPS@MAMI
In a series of experiments with tagged photon beams at MAMI-C, using the Crystal Ball and TAPS detector sys-tems (Fig. 5),ωphotoproduction on12C and93Nb targets has been measured in the energy range close to the pro-duction threshold 900-1300 MeV [39]. The Crystal Ball detector, comprising 672 NaI(Tl) crystals with 15.7 X0,
covered the polar angle range from 20◦to 160◦. The for-ward region was subtended by the TAPS calorimeter in a forward wall configuration, consisting of 384 BaF2
crys-tals. The two innermost rings were replaced by 24 PbWO4
(≈22 X0) crystals to handle higher event rates.
For the charged particle identification 5mm thick plastic scintillators, mounted in front of the BaF2 crystals, were
used. The particle identification detector (PID) surrounded the target area in the center of the Crystal Ball and con-sisted of 24 plastic scintillators. The MWPCs shown in Fig. 5 were not used in the experiments with solid tar-gets. The combination of these detector systems was as suited for the detection of multi-photon final states as the CBELSA/TAPS detector.
4 Data analysis
The high segmentation and the almost full solid angle cov-erage of the detector systems used allowed the reconstruc-tion ofωandηmesons from multi photon final states by invariant mass analysis. The decay modes used in the anal-yses wereω → π0γ → 3γandη → π0π0η → 6γwith branching ratios of 8.2% and 8.5%, respectively [23].
For the ω analysis, events with exactly three pho-tons and one charged hit in the detector system were se-lected. The invariant mass of all photon pairs was calcu-lated and the one combination closest to the π0 mass of
135 MeV/c2 was taken to be theπ0. For theηanalysis,
events with exactly 6 photons and any number of charged hits and with an energy sum of neutral clusters larger than 600 MeV were selected. The 6 photons were combined in 2 pairs of 2 photons with invariant masses in the range 115 MeV/c2 ≤ m
γγ ≤155 MeV/c2 (corresponding to a DOI: 10.1051/
,03003 (2017) 713403003
EPJ Web of Conferences 134 epjconf/201
Subnuclear Structure of Matter: Achievements and Challenges
DOI: 10.1051/
,03003 (2017) 713403003
EPJ Web of Conferences 134 epjconf/201
Figure 4.Left: Setup used in the experiment in 2003. Right: Improved setup used in the experiments with12C (2007, 2009) and93Nb
(2013/14) targets. See text for more details.
Figure 5.Crystal Ball/TAPS setup at MAMI in Mainz. Around
the target area in the center of the Crystal Ball the plastic scin-tillator array (PID) and the multi-wire proportional chamber
(MWPC) are shown. The BaF2 calorimeter TAPS in a forward
wall configuration, subdivided into six sectors, wth PbWO4
crys-tals in the two innermost rings, was placed in a distance of 1.47 m behind the target.
±3σcut aroundmπ0) and one pair with invariant mass in
the range 510 MeV/c2 ≤ m
γγ ≤ 590 MeV/c2 (roughly corresponding to a ±2σ cut around mη). The best pho-ton combination was selected based on aχ2minimization.
To suppress the background fromη→3π0decays and
di-rect 3π0production, events with 3γpairs with an invariant
mass within the limits for the pion massmπ0given above
were removed from the data set.
Examples for the invariant mass spectra, the obtained mass resolution and signal/background ratio are shown in Fig. 6 and Fig. 7. For theωmeson the relative mass reso-lution σm
m is about 3.3%, while for theηmeson a relative
mass resolution of 1.2% has been achieved. The betterη mass resolution is due to the fact that the nominal mass values [23] of the three mesons in the final state can be
used in the calculation of the invariant mass. The sig-nal/background ratios are of the order of 1/2.2 for theω and 1/1.2 for theηmeson, respectively.
]
2
[MeV/c
γ
0
π
M
600 650 700 750 800 850 900 950
)]
2
[1/(4 MeV/cγ
0
π
N
4
10
97563 counts
C
2
0.1 MeV/c
±
=26.4
σ
Figure 6.π0γinvariant mass distribution measured for a carbon
target [40].
] 2 [MeV/c η 0 π 0 π M
900 1000 1100
2
/ 8 MeV/cη
0
π
0
π
N
0 500 1000 1500 2000
Nb
2
0.3 MeV/c
±
= 11.9
σ
2
0.4 MeV/c
±
m=957.1
Figure 7.π0π0ηmass distribution measured for a niobium target
[41].
and momentum of the meson deviates from the kinemat-ics of the reaction because of elastic scattering in the nu-cleus. The reconstruction efficiency is determined by tak-ing the ratio of the number of reconstructed and the num-ber of generated events for each angular- and momentum bin. As an example, the resulting reconstruction efficiency
γNb→ηX(plab
η, θlabη ) for theγNb→ηX reaction is shown in Fig. 8 for the incident photon energy range of 1.2-2.9 GeV. In the Monte Carlo simulations, the same trigger condi-tions as in the experiment are applied.
] o [ '
ηlab
θ
0 20
40 60
80 [GeV/c]
' η lab
p
0 0.5 1
1.5 2 2.5
reconstruction efficiency
0 0.05 0.1 0.15 0.2
Figure 8.Two-dimensional reconstruction efficiency forη
pho-toproduction offNb as a function of theηmomentum and angle
in the laboratory system for the incident photon energy range of 1.2-2.9 GeV [41].
5 Results and discussion
5.1 Meson photoproduction in elementary reactions
Before extracting information on in-medium modifica-tions of mesons from experiments, the photoproduction of mesons offthe free proton as well as offthe quasifree pro-ton and neutron in deuterium has to be studied to provide a reference for the results obtained from nuclei. The pho-toproduction ofωandηmesons has been measured with the CBELSA/TAPS detector by Dietz et al. [43] and Jae-gle et al. [44], respectively. Detailed results on the angular distributions and total cross sections have been obtained. As an example, the total cross section forωandη produc-tion offthe proton and neutron in deuterium are shown in Fig. 9. These data are essential as input for calculations of meson production offnuclei. Deviations from these calcu-lations are then interpreted as in-medium effects.
5.2 The real part of the meson-nucleus optical potential
5.2.1 Lineshape Analysis
As discussed in section 2, the most direct way to determine an in-medium mass shift from meson photoproduction off nuclear targets is to calculate the invariant mass from the measured 4-vectors of the meson decay products, using Eq. (4), and to compare this invariant mass with the meson mass listed in [23]. This approach has, however, several, disadvantages:
- The method is sensitive to the nuclear density at the
decaypoint. Due to the kinematics of the reaction, mesons obtain a rather broad recoil momentum distribution with an average momentum comparable to their mass. Thus,
β·γ= p
m ≈1 and consequently, the average decay length
βγcτ≈cτis several times larger than nuclear dimensions even for short-lived vector mesons, except for theρ. Most of the meson decays thus occur outside of the nuclear medium, yielding a free spectral function. Even when applying cuts to select low momentum mesons to enhance in-medium decays, there will always be two mass peaks for decays inside and outside of the nucleus which can only be separated if the mass shift is larger than the mass resolution.
- an in-medium mass peak will be smeared out depending on the broadening of the meson through inelastic reactions in the nucleus. Broad structures, however, will be more difficult to distinguish from background.
- ambiguities in the subtraction of the background in the invariant mass spectra leads to additional uncertainties in the determination of the meson line shape, as discussed in [36, 47, 49].
- the above problems exist for any decay mode of the me-son. If, however, hadrons are among the decay products, as in theωandηdecays discussed here, the 4-momentum vectors of the decay products and thus also the calculated invariant mass may be distorted by elastic scattering or the mesons may even be absorbed within the nucleus due
DOI: 10.1051/
,03003 (2017) 713403003
EPJ Web of Conferences 134 epjconf/201
Figure 9. Left: Total cross section as a function of the incident photon energy forωmesons produced offthe bound proton (open
squares) and offthe bound neutron (red triangles), the sum of the exclusive cross sections (purple crosses), the quasifree inclusive
production cross section (green circles) and the cross section offthe bound neutron calculated fromσincl−σboundp (black circles). The
bands indicate the systematic errors [43]. Right: Total cross section as a function of the incident photon energy forηproduction offthe
bound proton (blue squares) and neutron (red circles) and the inclusive cross section (black triangles). The curves are reaction model fits, see [44].
to the strong interaction. Information on decays near the center of the nucleus will thus not reach the detector. Only decays near the nuclear surface will be registered which occur at low nuclear densities where mass shifts - assuming a density dependent mass modification - are also smaller. The sensitivity of the meson lineshape to in-medium modifications is thus reduced.
These caveats of the lineshape analysis have only been recognized in the course of the project. As an example, the results obtained with the Crystal Ball and TAPS detector system (Fig. 5) forωphotoproduction off
12C and 93Nb targets will be discussed. High statistics
have been accumulated in the energy range close to the production threshold [39], leading to an enhanced yield of low momentumωmesons.
Fig. 10 shows the ω signal after subtraction of the background mostly arising from 2π0andπ0ηevents where
one of the 4 decay photons was not registered in the Crys-tal Ball/TAPS detector system (for details of the back-ground subtraction techniques, see [36]). Theωsignal in the Nb run is slightly broader than the reference signal ob-tained with the LH2target [39]. In Fig. 10 theωsignal on
Nb is compared to GiBUU transport calculations [24, 35] for different in-medium scenarios. Although the statistics of the experiment has been considerably improved com-pared to previous studies [35, 36, 49] it is still not suffi -cient to distinguish different scenarios which differ only very little in the predicted line shape. This reflects the limited sensitivity of the lineshape analysis as discussed above. Only the scenario with a strong mass shift seems to be disfavored.
5.2.2 Excitation function of theωandηmesons
As an alternative to the lineshape analysis, which showed a reduced sensitivity to in-medium modifications,
infor-Figure 10.Comparison of the observedπ0γinvariant mass
spec-trum for the Nb target for inclusive analysis with GiBUU
calcu-lations [24] for different in-medium modification scenarios,
as-suming no in-medium modifications (red solid curve), only col-lisional broadening (green dashed curve), colcol-lisional broadening and mass shift by -14% at normal nuclear matter density (short dashed, blue curve) and mass shift without broadening (dotted, magenta curve) [39].
The experimental results for the ω excitation function in comparison to theoretical calculations are shown in Fig. 11. Data were taken on a carbon target with the Crystal Ball and TAPS detector system at MAMI-C. The GiBUU transport model [21] has been applied to calcu-late theωexcitation function for 6 different scenarios al-lowing for mass shifts up to -125 MeV at normal nuclear density as it is shown in Fig. 11. It is again obvious that the data are not consistent with a strong mass shift sce-nario, V>100 MeV as predicted in [3, 13]. Aχ2-fit of the
data with the calculated excitation functions for the diff er-ent scenarios gives a poter-ential depth of VωA(ρ = ρ0) = −(42±17(stat)±20(syst)) MeV [50].
[GeV] a E 0.9 1 1.1 1.2 1.3 1.4
b]
/A [a
0/
m
-2 10
-1 10
C data
GiBUU
) = 0 MeV 0 l = l V(
) = -20 MeV 0 l
=
l
V(
) = -40 MeV
0
l = l V(
) = -55 MeV 0 l = l V(
) = -94 MeV 0 l = l V(
) = -125 MeV 0
l = l V(
thr t a E
Figure 11. Measured excitation function forωmeson in
com-parison to GiBUU transport calculations for several in-medium modification scenarios [50].
Experimental data for the η excitation function in comparison to theoretical calculations are shown in Fig. 12 [37, 41]. In order to study the possible dependence of the real part of the η-nucleus optical potential on the mass of the nucleus, the data were taken on12C and 93Nb targets with the CBELSA/TAPS detector system.
In both cases the data disfavor a deep real potential of V>100 MeV, as predicted in [11, 12]. While theηcross section drops dramatically near the production threshold ofEγ=1447 MeV in case of the proton target [51], there is appreciable yield below this threshold in the reaction on the solid targets. There are several effects which can cause a non-zero cross section below 1447 MeV. This is on the one hand due to the Fermi motion of nucleons in the Nb target which gives rise to a distribution of the energy √s available in the centre-of-mass system for a given incident photon energy. On the other hand, also the mass of the meson might drop in a nuclear medium -as theoretically predicted - which lowers the production threshold and increases the phase space for meson pro-duction below the free threshold energy. The calculations have been performed within the first collision model based on the nucleon spectral function and described in detail in [25]. Starting from the measured differential
cross sections for η production off the free proton and neutron [44, 51], the cross section forηphotoproduction offC and Nb is calculated in an eikonal approximation, taking the effect of the nuclear η mean-field potential into account. The η final-state absorption is determined by the inelastic in-mediumηNcross section taken to be
σinel=11 mb, consistent with the result of transparency
ratio measurements [22]. In the calculations for the Nb targetσinel=13 mb has been assumed, consistent with the
new results from [40]. The total nucleon spectral function is taken into account in the parametrization given in [52]. Thereby, the contribution of η production from two-nucleon short-range correlations is taken into account. The calculations are improved in [37, 41] with respect to [25] as the momentum-dependent optical potential from [53], seen by the nucleons emerging from the nucleus in coincidence with theηmesons, is accounted for as well.
The experimental data were compared with six diff er-ent scenarios assuming depths of the ηreal potential at normal nuclear matter density ofV=0, -25, -50, -75, -100 and -150 MeV, respectively (Fig. 12). The reduction in the incident photon flux due to photon shadowing has been taken into account by multiplying the observed η yield by 1.17 [54–56]. The calculated cross sections for Carbon have been further scaled down - within the limits of the systematic uncertainties - by a factor of 0.83 to match the experimental excitation function data at incident photon energies above 2.2 GeV, where the difference between the various scenarios is very small. In the corresponding analysis of the Nb data [41] a rescaling of the theoretical calculations by 0.91 had to be applied. We are not aware of any missing physics in the calculations which might explain this systematic difference between data and calculations. In view of the systematic errors of the cross section data (23%) and the calculations (10-15%) a discrepancy cannot be claimed. The highest sensitivity to the η potential depth is found for incident photon energies near and below the production threshold on the free nucleon. The excitation function data on both nuclei appear to be incompatible with η mass shifts of -100 MeV and more at normal nuclear matter density, as clearly seen in Fig. 12. Aχ2-fit of the data with the
calculated excitation functions for the different scenarios over the full range of incident energies gives a potential depth of -(40±6) MeV and -(40±12) MeV for C and Nb, respectively [37, 41].
It has been investigated whether the observed cross section enhancement relative to theV=0 MeV case could also be due to η production on dynamically formed compact nucleonic configurations - in particular, on pairs of correlated nucleon clusters - which share energy and momentum. These effects have been studied experimen-tally [57] and theoretically [58, 59] in very near-threshold
K+production in proton-nucleus reactions. Applying the parametrization of the spectral function given by [52], in Fig. 12 (left: dot-dashed blue curve) has been shown that correlated high momentum nucleons contribute only about 10-15% to the η yield in the incident energy
DOI: 10.1051/
,03003 (2017) 713403003
EPJ Web of Conferences 134 epjconf/201
Eγ[MeV]
σ η’
[
μ
b]
V(ρ=ρ0) = 0 MeV
V(ρ=ρ0) = -75 MeV V(ρ=ρ0) = -100 MeV
V(ρ=ρ0) = -150 MeV
V(ρ=ρ0) = -50 MeV
V(ρ=ρ0) = -25 MeV
Eγ[MeV]
σ η’
[
μ
b] σ
tot σdiff
Eγthr
Eγ[MeV]
σ η’
[
μ
b]
Eγthr
10 -1
1 10
1000 1500 2000 2500
[GeV] γ E
1 1.5 2 2.5
b]
μ
['
η
σ
1 10
Nb
tot σ
diff σ
= 13 mb
inel '
η σ
) = 0 MeV
0
ρ = ρ V(
) = - 25 MeV
0
ρ
=
ρ
V(
) = - 50 MeV
0
ρ
=
ρ
V(
) = - 75 MeV
0
ρ = ρ V(
) = -100 MeV
0 ρ
=
ρ
V(
) = -150 MeV
0
ρ = ρ V(
' thr η γ
E
Figure 12. Measured excitation function forη meson off12C (left) and93Nb (right), in comparison to theoretical calculations for
different scenarios [37, 41]. The experimental data are extracted by integrating the differential cross sections (full circles) and by direct
measurement of theηyield in incident photon energy bins (open circles). The calculations are forσηN=11 mb (for C data) and for
σηN=13 mb (for Nb data), and for potential depths:V=0 MeV (black line), -25 MeV (green), -50 MeV (blue), -75 MeV (black dashed),
-100 MeV (red) and -150 MeV (magenta) at normal nuclear density, respectively, and using the full nucleon spectral function. The dot-dashed blue curve (in the left spectrum) is calculated for correlated intranuclear nucleons only.
regime above 1250 MeV [37]. The observed cross section enhancement can therefore be attributed mainly to the lowering of theηmass in the nuclear medium.
5.2.3 Momentum distribution of theωandηmesons
As discussed in section 2, the momentum distribution of the mesons is also sensitive to the potential depth and has been investigated as well. Fig. 13 shows the momentum distribution ofωmesons in comparison to GiBUU simula-tions for different in-medium modification scenarios. The
ω momentum distributions measured for near-threshold photo production off12C and93Nb do not support
calcula-tions predicting mass shifts as large as -16% [3, 13].
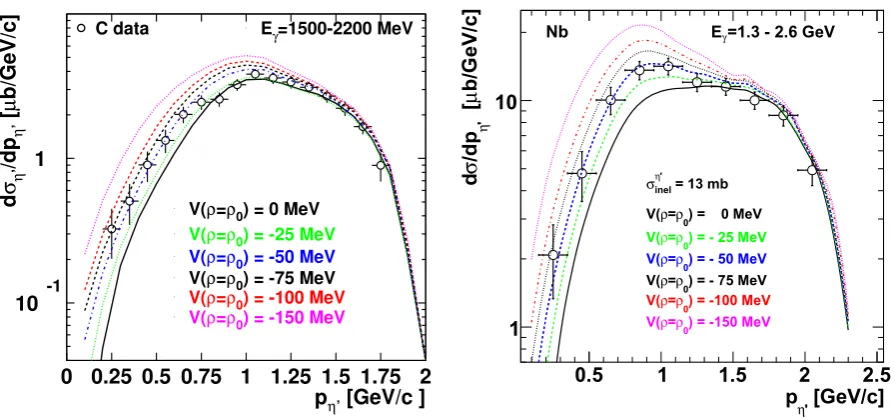
The measured momentum differential cross sections forηmeson photoproduction offC [37] and Nb [41] are shown in Fig. 14. The average momentum in both cases is≈1.1 GeV/c. Bin sizes of 0.1 GeV/cfor C data and≥ 0.2 GeV/cfor Nb data have been chosen which are large compared to the momentum resolution of 25-50 MeV/c deduced from the experimental energy resolution and from Monte Carlo simulations. Theηmomentum distributions have been calculated for the incident photon energy range 1.3-2.6 GeV and for different potential depths V=0, -25, -50, -75, -100 and -150 MeV. The comparison of these cal-culations with the data again exclude strongηmass shifts. Aχ2-fit of the data with the calculated momentum
distri-butions for the different scenarios over the full range of incident energies gives a potential depth of -(32±11) MeV and -(45±20) MeV offC and Nb, respectively [41].
[MeV/c] a
0
/ p
0 100 200 300 400 500 600 700 800 900 1000
a.u.
0 200 400 600 800 1000 C
Nb
Figure 13. Acceptance correctedωmomentum distribution for
incident photon energies of 900 to 1300 MeV and for12C and
93Nb targets, compared to the theoretical predictions for diff
er-ent in-medium modifications scenarios: no modification (solid red line), collisional broadening (dashed green line), collisional broadening plus mass shift (dashed blue line) and mass shift (magenta line). All distributions are normalized to the same area [39].
5.2.4 Theω-nucleus real potential at low momenta
As has been pointed in 5.2.3, the average momentum of
ωandηmesons was around 0.6 - 1 GeV/c(see Fig. 13, Fig. 14). To study the possible momentum dependence of the real part of the meson-nucleus optical potential an ex-periment has been performed to produce ωmesons with low momenta (< 500 MeV/c). In the reaction γC →
pη’ [GeV/c ]
d
ση’
/dp
η
’
[
μ
b/GeV/c]
C data Eγ=1500-2200 MeV
V(ρ=ρ0) = 0 MeV
V(ρ=ρ0) = -75 MeV
V(ρ=ρ0) = -25 MeV
V(ρ=ρ0) = -100 MeV
V(ρ=ρ0) = -150 MeV
V(ρ=ρ0) = -50 MeV
10 -1
1
0 0.25 0.5 0.75 1 1.25 1.5 1.75 2
[GeV/c] '
η p
0.5 1 1.5 2 2.5
b/GeV/c]
μ
[ 'η
/dp
σ
d
1 10
Nb Eγ=1.3 - 2.6 GeV
= 13 mb
inel '
η σ
) = 0 MeV
0
ρ = ρ V(
) = - 25 MeV
0
ρ
=
ρ
V(
) = - 50 MeV
0
ρ
=
ρ
V(
) = - 75 MeV
0
ρ = ρ V(
) = -100 MeV
0 ρ
=
ρ
V(
) = -150 MeV
0
ρ = ρ V(
Figure 14. Left: Momentum distribution forη photoproduction offC for the incident photon energy range 1500-2200 MeV. The
calculations are forσηN=11 mb and have been reduced by a factor 0.75 (see text) [37]. Right: Momentum distribution forη
photo-production offNb for the incident photon energy range 1.3-2.6 GeV. The calculations are forσηinel =13 mb and have been multiplied by
a factor 0.83 (see text) [41]. In both spectra the theoretical curves are for potential depths V=0, -25, -50, -75, -100 and -150 MeV at
normal nuclear density. The color code is identical to the one in Fig. 12.
Figure 15.Left: Differential cross section for the photo production ofω-mesons offC in coincidence with protons inΘp =1◦−11◦
as a function of the total energy of theπ0γpairs minus 782 MeV. The data have been fitted with the Novosibirsk function [62]. Right:
Correlation between the potential depth and the peak position in the total energy distribution. The (blue) points represent the peak
positions in the total energy distribution for the different scenarios [11, 63–65]. The (blue) solid curve is a fit to the points. The red
dashed area corresponds to the peak position of (60.5±7) MeV [61].
detector (see Fig. 4 right) covering the polar angle range
Θp = 1◦ −11◦. In this case the forward going proton
takes over most of the momentum of the incoming photon beam. Being so low in energy, theω-mesons are partic-ularly sensitive to the ω nucleus potential. In case of a strong repulsive (attractive) interaction one would expect the peak in the kinetic energy distribution to be shifted to higher (lower) energies for the C target. The sensitivity of the peak position in the kinetic energy distribution on the potential depth, studied in [61], can be exploited to de-duce the depth of the real part of theω-nucleus potential.
The experimental data for theωkinetic energy distribution are shown in Fig. 15 (left). The data have been fitted with the Novosibirsk function [62], giving a peak position of (60.5±7) MeV [61]. The correlation between the poten-tial depth and the peak in the kinetic energy distribution is plotted in Fig. 15 (right). A comparison with the exper-imentally determined peak position indicates a potential depth of -(15±35) MeV which appears to be too small to allow for the formation and population ofωmesic states, in particular in view of the large in-medium width of≈90 MeV (see 5.3).
DOI: 10.1051/
,03003 (2017) 713403003
EPJ Web of Conferences 134 epjconf/201
[MeV] 'A
η
V 80
− −60 −40 −20 0 20
excitation function
kin
peak E
average
C
[MeV]
'A
η
V 80
− −60 −40 −20 0
excitation function
mom. distribution
weighted average
C
Nb
Figure 16.Depths of the real part of theω(left) andη(right) -nucleus potential determined by analyzing the excitation function and
the momentum distributions for C [37, 50] (full black circles) and for Nb [41] (red triangles). The weighted overall average is indicated by a blue square and the shaded area. The vertical hatched lines mark the range of systematic uncertainties
5.2.5 Conclusions on the real part of theω- andη -nucleus optical potential
Combining the results from the analysis of the excitation function and the peak position from the kinetic energy distribution an average depth of the real part of theω-C optical potential of V(ρ=ρ0)=-(29±19(stat)±20(syst))
MeV is obtained Fig. 16 (left).
From the analysis of the excitation functions and the momentum distributions and by proper weighting of the errors a depth of the real part of theη-C and -Nb optical potential of V(ρ =ρ0)=-(39±7(stat)±15(syst)) MeV is
obtained (see Fig. 16 (right)). The systematic error quoted is mainly due to uncertainties in normalizing the calcula-tions to the data. The sensitivity of the result on this nor-malization has been studied by varying the nornor-malization factor between 0.7 to 1.0 - well within the systematic er-rors of the cross section determinations.
This result for V(ρ = ρ0) is consistent with predictions
of theη-nucleus potential depth within the Quark-Meson Coupling model (QMC) [16] and with calculations in [60] but does not support larger mass shifts as discussed in [11, 14].
5.3 The imaginary part of the meson-nucleus optical potential
Figure 17 presents the differential cross sections per nu-cleon forω and η photoproduction off carbon and nio-bium as a function of the meson momentum for incident photon energies of 1.2-2.9 GeV [40]. The cross sections include a 15% correction for absorption of the incoming photon beam (photon shadowing) for both nuclear targets [54–56]. The distributions show a maximum at around 800 MeV/cand 1000 MeV/c for the ω and η, respec-tively, and fall offtowards higher momenta. The average momenta, given in Fig. 17, are close to 1000 MeV/c. To determine the meson attenuation in nuclei and the inelastic meson-nucleon cross sections as a function of the meson momentum, the transparency ratio [26] is deduced from the data as defined in Eq.5. To suppress nuclear effects not related to meson absorption, the transparency ratio is not taken relative to the free nucleon but rather to a nu-cleon in a light nucleus like carbon as suggested in [47].
The momentum dependence of the transparency ratio for a meson m is thus obtained by dividing the differential in-clusive meson production cross sections (see Fig. 17) for niobium by the one for carbon according to
Tm Nb/C=
12·σγNb→mX
93·σγC→mX,
(6)
where 12 and 93 are the nuclear mass numbers of carbon and niobium, respectively. The resulting transparency ra-tios as a function of the meson momentum are shown in Fig. 18. Consistent with earlier measurements [37, 48], a slight increase with momentum is observed for the ω meson while for theηmeson the transparency ratio is al-most independent of momentum. Differences between the transparency ratios in the present measurements and the earlier ones reflect the systematic uncertainties of the mea-surements. For the present data the thick error bars (red) in Fig. 18 and subsequent figures represent the statistical errors while the thinner error bars (black) include the sys-tematic errors added in quadrature.
The interpretation of the transparency ratio in terms of meson absorption will only give reliable results if two-step production processes are negligible, where e.g. a pion is produced in an initial step followed by production of the meson of interest in a subsequent pion-induced reac-tion on another nucleon within the nucleus. As shown in [22], two-step processes are negligible for ω and η mesons since the spectral distribution of pions falls off to-wards higher energies and - at the required pion momenta of≈1.3 and 1.5 GeV/c- pion induced meson production cross sections are only≈2.5 mb and 0.1 mb, respectively, compared to the total reaction cross section of about 30-40 mb [23]. Consequently, two-step processes are neglected in the subsequent analysis of the transparency ratio.
Following [22, 25, 48] the in-medium meson width is deduced from the measured transparency ratio within a Glauber model in the high energy eikonal approximation (for details see [40]). Hereby, the in-medium widthΓ(ρ) is assumed to depend linearly on the nuclear densityρ:
Γ(ρ)= Γ0·ρρ 0,
(7)
whereΓ0is the momentum dependent width at normal
[MeV/c] ω p
0 500 1000 1500 2000 2500
b/(GeV/c)]
μ
/A [ω
/dp
σ
d
0 0.5 1 1.5
2 2.5 3 3.5 4
Nb
C
[MeV/c] '
η p
0 500 1000 1500 2000 2500
b/(GeV/c)]
μ
/A [ '
η
/dp
σ
d
0 0.05 0.1 0.15 0.2 0.25
Nb
C
Figure 17. Differential cross section per nucleon for (Left)ωand (Right)ηphotoproduction offcarbon (red squares) and niobium
(blue circles) for the incident photon energies of 1.2-2.9 GeV. The data points for carbon are shifted by+10 MeV/cand for niobium by
−10 MeV/cto avoid an overlap of the error bars.
[MeV/c] ω p
0 500 1000 1500 2000 2500
ω Nb/C
T
0 0.2 0.4 0.6 0.8 1 1.2 1.4
PRL 100 (2008) 192302
this experiment
[MeV/c]
'
η p
0 500 1000 1500 2000 2500
'
η Nb/C
T
0 0.2 0.4 0.6 0.8 1 1.2 1.4
PLB 710 (2012) 600
this experiment
Figure 18.The transparency ratio according to Eq. 6 for (Left)ωand (Right)ηphotoproduction offcarbon and niobium (red stars)
in comparison to earlier measurements (open crosses) [22, 48]. The data points of the present work are shifted by+10 MeV/cand the
previuosly published data by−10 MeV/cto avoid an overlap of the error bars. For the present data the thick error bars (red) represent
the statistical errors. The thin error bars (black) include the systematic errors added in quadrature.
is shown in Fig. 19 as a function of theωandη momen-tum, respectively. The non-linearity in the correlation be-tween transparency ratio and in-medium width introduces strongly asymmetric error bars. Within errors, the results are consistent with previous measurements [22, 48, 66]. It is immediately apparent that theωwidths are larger than theηwidths by about a factor three. The finer binning in the present data also reveals more clearly a variation of the widths with momentum, indicating a rise with momentum at small momenta and a fall-offtowards higher momenta.
The data for theωmeson are compared to calculations of the in-mediumω width. Cabrera and Rapp [20] and
Ramoset al. [19] have studied the width of theωmeson in cold nuclear matter as a function of the nuclear density and the meson 3-momentum. Both groups independently find that the main contribution to the in-mediumωwidth is determined by theω→ ρπchannel whereby the dress-ing of theπandρpropagator in the medium is essential. Thus, they argue that theπρ cloud is the main agent for the in-medium broadening of theω meson. Both groups obtain in-mediumωwidths of the order of 100-200 MeV, somewhat larger than observed experimentally. They dif-fer in the partitioning into theπandρmodifications and obtain differences in the 3-momentum dependence of the
DOI: 10.1051/
,03003 (2017) 713403003
EPJ Web of Conferences 134 epjconf/201
[MeV/c]
ω
p
0 500 1000 1500 2000 2500
[MeV]
ω 0
Γ
0 50 100 150 200 250 300 350
PRL 114 (2015) 199903
this experiment
[MeV/c]
'
η
p
0 500 1000 1500 2000 2500
[MeV]
'
η 0
Γ
0 10 20 30 40 50 60 70 80 90
PLB 710 (2012) 600
this experiment
Figure 19.In-medium widthΓ0of (Left)ωand (Right)ηmesons as a function of the meson momentum (red stars), derived from the
data presented in Fig. 18, in comparison to earlier measurements (open crosses) [22, 48, 66]. The data points of the present work are
shifted by+10 MeV/cand the previously published data by−10 MeV/cto avoid an overlap of the error bars (symbols as in Fig. 18).
The solid curves correspond to calculations by Ramoset al.[19], the short dashed curves to calculations by Cabrera and Rapp [20] for
different model assumptions (see text). The brown dashed-dotted curve shows the momentum dependence of theωin-medium width
calculated in a coupled-channel resonance model [18]. The long dashed green curves correspond to different options for the in-medium
ωwidth used in GiBUU simulations [21]. The blue triangle and the red open circle represent the widths calculated for anωmeson at
rest in the nuclear medium in [13, 17], respectively.
[MeV/c]
ω
p
0 500 1000 1500 2000 2500
[mb]
ω inel
σ
0 50 100 150 200
PRL 114 (2015) 199903
this experiment
[MeV/c]
'
η
p
0 500 1000 1500 2000 2500
[mb]
'
η inel
σ
0 5 10 15 20 25 30 35 40
PLB 710 (2012) 600 this experiment
Figure 20.Left:ωinelastic cross section and Right:ηcross section as a function of the momentum (red stars) [40] in comparison to
earlier measurements (open crosses) [22, 48, 66].
ω width. While Cabrera and Rapp [20] find a moderate momentum dependence, Ramoset al. [19] get an almost linear increase of the width with momentum. Alterna-tively, Klingl et al. [13], Lutz et al. [17] and Mühlich et al. [18] consider the coupling of the ωmeson to nu-cleon resonances as the main effect driving the in-medium broadening of the ωmeson. In fact, the data are closer to the momentum dependence of theωin-medium width calculated in a coupled-channel resonance model [18] and are only slightly larger at low momenta than the width of 40 MeV calculated for theωat rest in the nuclear medium [13, 17]. The statistics of the present experiment is un-fortunately not sufficient to clearly discriminate between these different theoretical approaches.
From the in-medium widths Γ0 of Fig. 19 inelastic
cross sectionsσinelcan be derived, using the low-density
approximation which relates the in-medium meson width
Γ(ρ=ρ0)= Γ0at normal nuclear matter densityρ0to the
inelastic meson-nucleon cross sectionσinelby
Γ(ρ=ρ0)= Γ0=c·ρ0·σinel·β. (8)
Here,βis the relative velocity of the meson in the nu-clear restframe. The resulting inelastic cross sections are shown in Fig. 20 as a function of the meson momentum. To compare the data to a parametrization frequently used in the literature, the data for both mesons have been fitted with an ansatz
σinel[mb]=a+ b
p[GeV/c], (9)
as proposed by Lykasov et al. [67] and used as parametri-sation in GiBUU transport simulations [21]. The present inelastic η cross section data (Fig. 20 (right)) shows a mean value of (13 ±3) mb, slightly larger but consis-tent with the earlier result of (10.3±1.4) mb reported in [22]. The experimental data are compared to calculations by Oset and Ramos [68]. They have studied theη-nucleon interaction within a chiral unitary approach, includingπN
andηN coupled channels, which yields a very weakηN
[MeV]
thr
s
-ω
s
0 500 1000 1500 2000
) [MeV]
ω 0
-(Im U
0 20 40 60 80 100 120 140 160 180
PRL 114 (2015) 199903
this experiment
[MeV]
thr
s
-'
η
s
0 500 1000 1500
) [MeV]
'
η 0
-(Im U
0 5 10 15 20 25 30 35 40 45
PLB 710 (2012) 600
this experiment
Figure 21. Imaginary part of the (Left)ω-nucleus and (Right)η-nucleus optical potential as a function of the available energy in the
meson-93Nb system (red stars) [40] in comparison to earlier measurements (open crosses) [22, 48, 66]. The solid curves are
Breit-Wigner fits to the present data. The shaded areas indicate a confidence level of±1σof the fit curve taking statistical and systematic
errors into account.
of pseudo-scalar to vector mesons. In this approach in-elastic ηN cross sections rising from about 3 mb at pη
=600 MeV/cto about 20 mb at pη =50 MeV/care pre-dicted. The calculations seem to underestimate the exper-imentally determined inelasticηcross section. This may not be surprising since multi-particle production, proba-bly dominant because of the largeηmass, has not been considered in [68].
As a final step, the momentum dependence of the in-medium ω and η widths from Fig. 19 can be con-verted into the dependence of the imaginary part of the
ω- andη-nucleus potential as a function of the available energy in the meson-93Nb system, as shown in Fig. 21.
The imaginary part of the potential ImU at normal nu-clear matter density is just half of the in-medium width
Γ0 (see Fig. 19). The finer binning of the present data
allows a more reliable extrapolation towards the produc-tion threshold by fitting the data. Several fit funcproduc-tions have been applied (polynomial of 1st. and 2nd. order, Gaussian, Breit-Wigner). The range of -ImU(0) values obtained for different fit functions reflects the systematic uncertainties. For theωmeson the modulus of the imag-inary part of the meson nucleus potential near threshold is found to be (48±12(stat)±9(syst)) MeV comparable to the modulus of the real part of about 30 MeV, deter-mined in [50, 61, 69]. For the η meson the extrapola-tion towards the producextrapola-tion threshold yields an imaginary potential of (13±3(stat)±3(syst)) MeV, corresponding to an imaginary part of theη scattering length Im(aηN)= (0.16±0.05) fm. This is about a factor two smaller than obtained in the direct determination of theηNscattering length from an analysis of near threshold η production in the pp → ppηreaction [70]. The error bars of both completely independent determinations do, however, al-most overlap.
6 Meson-nucleus bound states
The existence of deeply bound pionic states is clearly es-tablished [71–74]. These systems are bound by the at-tractive Coulomb interaction between a negatively charged
pion and the positively charged nucleus. The superposition with the strong interaction, which is repulsive at low pion momenta, leads to a potential pocket near the nuclear sur-face and consequently to a halo-likeπ−distribution around the nucleus [75]. Thus pions are only weakly absorbed, giving rise to rather narrow bound states which facilitated their experimental observation.
potential depth [MeV]
0 10 20 30 40 50 60 70 80
imaginary part [MeV]
0 10 20 30 40 50 60 70 80
ω
'
η
Figure 22.The imaginary part versus the real part of the
meson-nucleus potential forωandηmesons
As outlined in the previous sections, the interaction of neutral mesons with nuclei has been studied to find out whether meson-nucleus states might exist as well, only bound by the strong interaction. Here, the meson-nucleus interaction has to be sufficiently attractive and the meson absorption in nuclei should be relatively weak to allow the formation of relatively narrow states. Considering the results obtained for the ωand η-nucleus potentials it is evident that the η meson is a much better candidate for the formation of meson-nucleus bound states than the ω meson since we found for the ηmeson that |W| << |V|, while the opposite was observed for theωmeson, as illus-trated in Fig. 22. For theηmeson there is a possibility for the existence of relatively narrow bound states while for theωmeson the imaginary potential is comparable to the
DOI: 10.1051/
,03003 (2017) 713403003
EPJ Web of Conferences 134 epjconf/201
Figure 23.Left: Kinetic energy distribution of theωmeson offCarbon (black starts) compared with the kinetic energy distribution of
theωmeson offthe free proton (full blue circles). The LH2data are normalized to the C data in the peak of the total energy distribution.
The experimental distributions are compared to Monte Carlo simulations (LH2: blue histogram; C: red histogram), taking the Fermi
motion of nucleons into account for the C target. All distributions request the detection of a proton in the polar angular range 1◦−11◦
and are normalized to the fitted peak height for C. The Monte Carlo simulations are folded with the experimental resolution ofσE ≈16
MeV [61]. Right: Missing energy spectra calculated by Marco and Weise [76] for the12C(γ,p)ω11B reaction at E
γ=2.75 GeV. Dotted
lines represent the contributions from two particular combinations of boundωand proton-hole states.
real one and only broad structures can be expected which makes it difficult to detect them experimentally.
Nevertheless, an attempt to search forω mesic states has been performed [61]. Using theγ12C→π0γ+p+X
re-action with the proton detected at forward angles in TAPS, the distribution of the total energy Eωofπ0γpairs with an
invariant mass in theωmass range has been measured and compared to the reactionγp → π0γp on a liquid
hydro-gen target as shown in Fig. 23 (Left) [61]. Positive val-ues Eω−mωgive the kinetic energy of theωin quasi-free production, while events with negative values may signal the decay ofω-11B bound states viaπ0γemission. Com-paring the energy distributions measured for both targets, some tailing is observed for the carbon target in the fall offtowards lower energies which is not observed for the reaction on the free proton, even if one accounts for the smearing due to Fermi motion which is taken into account in the Monte Carlo simulation. Theπ0γcross section in
the energy range from - 100 to 0 MeV is on average (0.3± 0.1) nb MeV−1sr−1. Correcting for the effective
branch-ing ratio for in-mediumω → π0γdecays of≈1.5% [61]
a population cross section of (22±7) nb MeV−1sr−1is
de-duced which is of the order of magnitude for the formation ofωmesic states as calculated by Marco and Weise [76] (see Fig. 23 (Right)). Structures at negative energies which would indicate the population and decay of boundω-11B
states are, however, not observed. The yield at negative energies may arise from the strong in-medium broadening of theωmeson, discussed in section 5.3.
Since theηmeson is the better candidate for the search of mesic states several corresponding experiments have been launched. At the Fragment Separator (FRS) at GSI an experiment to search forηbound states has been per-formed via missing mass spectroscopy in the12C(p,d)
re-action in almost recoil free kinematics [77] and is be-ing analysed. An alternative approach is the
photopro-duction ofηmesons in the12C(γ,p) reaction, again in al-most recoil-free kinematics. In the ongoing experiment at the LEPS2 facility (Spring8) [78] the missing mass spec-troscopy is combined with detecting the decay of the η mesic state in a semi-exclusive measurement. An analo-gous photoproduction measurement has been proposed for the BGO-OD setup at the ELSA accelerator in Bonn [79]. A semi-exclusive measurement has also been considered for the Super-FRS at FAIR [65].
7 Conclusion
The photoproduction of ω andη mesons off nuclei has been studied in the 1-3 GeV energy range to extract information on the in-medium properties of these mesons. The interaction of mesons with nuclei and the in-medium effects have been described with an optical model, com-prising a real part, associated with the mass modification in the nuclear medium, and an imaginary part, accounting for the absorption of mesons in nuclei. For the ω- and
η- nucleus optical potential values of U
ωA(ρ = ρ0)
= -((29 ±19(stat)±20(syst)) + i(48±12(stat)±9(syst))) MeV and UηA(ρ = ρ0) = -((39 ±7(stat)±15(syst)) +
i(13±3(stat)±3(syst))) MeV have been obtained. The latter measurement establishes for the first time an in-medium mass drop of a pseudoscalar meson at normal nuclear matter density. Although not very deep, the real part of theη - nucleus potential is about three time larger than the imaginary part and may thus allow the existence and observation ofη-nucleus states, only bound by the strong interaction. Corresponding experiments are ongoing.
The results reported here have been obtained within the
CBELSA/TAPS collaboration and would not have been achieved
PhD-students and postdocs, in particular F. Dietz, S. Friedrich, M. Kotulla, K. Makonyi, M. Thiel, and D. Trnka. M. Kotulla acted as co-projectleader in July 2008 before leaving our group. The
support by the staffmembers of the ELSA accelerator and
collab-orating universities is highly appreciated. This project benefitted a lot from the close collaboration with project B5 (U. Mosel, P. Mühlich and J. Weil) regarding the interpretation of model calculations and the link between theoretical predictions and ex-perimental observables, provided by transport calculations. The work reported here would not have been possible without the support from the Deutsche Forschungsgemeinschaft within the
SFB/TR16.
References
[1] V.- Bernard and Ulf-G. Meißner, Nucl. Phys. A489, 647 (1988).
[2] G. E. Brown and M. Rho, Phys. Rev. Lett.66, 2720 (1991).
[3] T. Hatsuda and S. Lee, Phys. Rev. C46, R34 (1992). [4] R. Rapp, J. Wambach, H. van Hees, in: R. Stock (Ed.), Relativistic Heavy-Ion Physics, in: Landolt Börnstein (Springer), New Series, vol. I/23A, 4-1 (2010)
[5] R. Hayano and T. Hatsuda, Rev. Mod. Phys.82, 2949 (2010)
[6] S. Leupold, V. Metag, and U. Mosel, Int. J. Mod. Phys. E19, 147 (2010)
[7] S. Klimt et al., Nucl. Phys. A516, 429 (1990). [8] V. Bernard, R. L. Jaffe and U.-G. Meißner, Nucl.
Phys. B308, 753 (1988).
[9] S. Leupold, W. Peters, and U. Mosel, Nucl. Phys. A
628, 311 (1998).
[10] V. Bernard and Ulf-G. Meißner, Phys. Rev. D 38, 1551 (1988).
[11] H. Nagahiro, M. Takizawa, and S. Hirenzaki, Phys. Rev. C74, 045203 (2006).
[12] H. Nagahiro and S. Hirenzaki, Phys. Rev. Lett.94, 232503 (2005).
[13] F. Klingl et al., Nucl. Phys. A610, 297 (1997), Nucl. Phys. A650, 299 (1999).
[14] S. Sakai and D. Jido, Phys. Rev. C 88, 064906 (2013).
[15] K.Saito, K.Tsushima, and A. W. Thomas, Prog. Part. Nucl. Phys.58, 1 (2007).
[16] S. D. Bass and A. W. Thomas, Phys. Lett. B634, 368 (2006).
[17] M. Lutz et al., Nucl. Phys. A706, 431 (2002). [18] P. Mühlich et al., Nucl. Phys. A780, 187 (2006). [19] A. Ramos, L. Tolos, R. Molina, and E. Oset, Eur.
Phys. J. A49, 148 (2013).
[20] D. Cabrera and R. Rapp, Phys. Lett. B 729, 67 (2014).
[21] O. Busset al., Phys. Rep.512, 1 (2012).
[22] M. Nanova et al., CBELSA/TAPS Collaboration, Phys. Lett. B710, 600 (2012).
[23] K. A. Olive et al., Particle Data Group, Chin. Phys. C38, 090001 (2014).
[24] J. Weil, U. Mosel, and V. Metag, Phys. Lett. B723, 120 (2013).
[25] E. Ya. Paryev, J. Phys. G: Nucl. Part. Phys. 40, 025201 (2013).
[26] D. Cabreraet al., Nucl. Phys. A733, 130 (2004). [27] D. Husmann and W. J. Schwille, Phys. Bl. 44, 40
(1988).
[28] W. Hillert, Eur. Phys. J. A28, 139 (2006).
[29] D. Elsneret al., CBELSA/TAPS Collaboration, Eur. Phys. J. A33, 147 (2007).
[30] E. Aker et al., Nucl. Instr. and Meth. A 321, 69 (1992).
[31] G. Suft et al., Nucl. Instr. and Meth. A 538, 416 (2005).
[32] R. Novotny et al., IEEE Trans. Nucl. Sci. 38, 392 (1991).
[33] A. R. Gableret al., Nucl. Instr. and Meth. A346, 168 (1994).
[34] T. Mertens et al., CBELSA/TAPS Collaboration, Eur. Phys. J. A38, 195 (2008).
[35] M. Nanova et al., CBELSA/TAPS Collaboration, Eur. Phys. J. A47, 16 (2011).
[36] M. Nanova et al., CBELSA/TAPS Collaboration, Phys. Rev. C82, 035209 (2010).
[37] M. Nanova et al., CBELSA/TAPS Collaboration, Phys. Lett. B727, 417 (2013).
[38] A. Thielet al., CBELSA/TAPS Collaboration, Phys. Rev. Lett.109, 102001 (2012).
[39] M. Thiel et al., Eur. Phys. J. A49, 132 (2013). [40] S. Friedrich et al., CBELSA/TAPS Collaboration,
Eur. Phys. J. A52, 297 (2016).
[41] M. Nanova et al., CBELSA/TAPS Collaboration, Phys. Rev. C94, 025205 (2016).
[42] R. Brunet al., GEANT, CERN/DD/ee/84-1 (1986). [43] F. Dietz et al., CBELSA/TAPS Collaboration, Eur.
Phys. J. A51, 6 (2015).
[44] I. Jaegle et al., CBELSA/TAPS Collaboration, Eur. Phys. J. A47, 11 (2011).
[45] C. Cioffidegli Atti and S. Simula, Phys. Rev. C53, 1689 (1996).
[46] J. G. Messchendorpl et al., Eur. Phys. J. A 11, 95 (2001).
[47] M. Kaskulovet al., Phys. Rev. C75, 064616 (2007). [48] M. Kotulla et al., CBELSA/TAPS Collaboration,
Phys. Rev. Lett.100, 192302 (2008).
[49] D. Trnkaet al., CBELSA/TAPS Collaboration, Phys. Rev. Lett.94, 192203 (2005).
[50] V. Metaget al., A2 Collaboration, Prog. Part. Nucl. Phys.67, 530 (2012).
[51] V. Credeet al., CBELSA/TAPS Collaboration, Phys. Rev. C80, 055202 (2009).
[52] S. V. Efremov and E. Ya. Paryev, Eur. Phys. J. A1, 99 (1998).
[53] Z. Rudyet al., Eur. Phys. J. A15, 303 (2002). [54] T. Falter, S. Leupold, and U. Mosel, Phys. Rev. C64,
024608 (2001).
[55] N. Bianchiet al., Phys. Rev. C54, 1688 (1996). DOI: 10.1051/
,03003 (2017) 713403003
EPJ Web of Conferences 134 epjconf/201
![Figure 1. Symmetry breaking pattern for pseudoscalar mesonsas described in the text, adapted from [7].](https://thumb-us.123doks.com/thumbv2/123dok_us/8150328.1359086/1.595.320.537.496.644/figure-symmetry-breaking-pattern-pseudoscalar-mesonsas-described-adapted.webp)
![Figure 6. π0γ invariant mass distribution measured for a carbontarget [40].](https://thumb-us.123doks.com/thumbv2/123dok_us/8150328.1359086/5.595.68.527.97.258/figure-p-g-invariant-mass-distribution-measured-carbontarget.webp)

![Figure 10. Comparison of the observedtrum for the Nb target for inclusive analysis with GiBUU calcu-lations [24] for disuming no in-medium modifications (red solid curve), only col-lisional broadening (green dashed curve), collisional broadeningand mass shift by -14% at normal nuclear matter density (shortdashed, blue curve) and mass shift without broadening (dotted, π0γ invariant mass spec-fferent in-medium modification scenarios, as-magenta curve) [39].](https://thumb-us.123doks.com/thumbv2/123dok_us/8150328.1359086/7.595.101.498.76.254/comparison-observedtrum-modications-broadening-collisional-broadeningand-shortdashed-modication.webp)
![Figure 11. Measured excitation function forparison to GiBUU transport calculations for several in-medium ω meson in com-modification scenarios [50].](https://thumb-us.123doks.com/thumbv2/123dok_us/8150328.1359086/8.595.82.263.259.434/measured-excitation-function-forparison-transport-calculations-modication-scenarios.webp)

![Figure 16. Depths of the real part of the ω (left) and η′ (right) -nucleus potential determined by analyzing the excitation function andthe momentum distributions for C [37, 50] (full black circles) and for Nb [41] (red triangles)](https://thumb-us.123doks.com/thumbv2/123dok_us/8150328.1359086/11.595.93.506.89.192/potential-determined-analyzing-excitation-function-momentum-distributions-triangles.webp)

