1
A limiting current O
2sensor constituted of (CeO
2)
0.95(Y
2O
3)
0.05as solid electrolyte layer and
(CeO
2)
0.75(ZrO
2)
0.25as dense diffusion barrier layer
Xiangnan Wang, Tao Liu*, Jingkun Yu
(School of Metallurgy, Northeastern University, Shenyang 110819, China)
Abstract Using co-precipitation to synthesize (CeO2)0.95(Y2O3)0.05 (YDC) and solid reaction method to synthesize
(CeO2)0.75(ZrO2)0.25 (ZDC), and the characterization for both crystal structure and micro-structure of the two
materials was conducted with X-ray diffraction (XRD) and scanning electron microscope (SEM) methods. Prepare the YDC and ZDC based limited current O2 sensor by employing platinum pasting bonding method.
Sensing characteristics of the sensor were obtained at different conditions and study on the impact of temperature, O2 concentration as well as water vapor pressure on the sensing characteristics had been conducted. XRD results
show that the phase structure of both YDC and ZDC is cubic phase. SEM results show that both YDC and ZDC layers are dense layers, which are then qualified to be the composition materials of the sensor. This limited current O2 sensor shows good sensing performance and conforms to the Knudsen model. Log(IL·T) depends linearly on
1000/T with R2 of 0.9904, I
L depends linearly on x(O2) with R2 of 0.9726 and sensing characteristics are not
affected by p(H2O).
Keywords Limited current O2 sensor; YDCsolid electrolyte; ZDC dense diffusion barrier; Water vapor pressure
1. Introduction
Electrochemical O2 sensors are intended for the oxygen concentration detection, therefore are very essential
to monitor and control the air fuel ratio (A/F) in the industrial boilers, automotive and metallurgical industries,
which contributes a lot to the combustion process optimization, energy savings and emission reductions [1-3].
Concentration potential and limiting current are different principles which make the electrochemical O2 sensors
into two different types [4]. Voltage of the former type of O2 sensor is correlated to logarithm of the oxygen partial
pressure ratio according to Nernst equation, and hence the insensitivity of the voltage to the small changes of the
oxygen concentration within a very low range (A/F less than 14.7) [5]. A linear correlation exists between the
2
limiting current of the limiting current O2 sensor and the O2 concentration in a certain O2 concentration range,
which indicates high detection sensitivity and therefore the O2 sensor successfully attracts the public attention [6,
7]. The limiting current O2 sensor has pore type and dense type according to different types of the diffusion barrier.
Pores of the pore type sensor can be blocked by solid particles from the environment without many obstacles.
Such disadvantage of the pore type sensor drives the dense type to become hot research focus [8, 9]. Scholars
from both domestic China and foreign countries have conducted many researches and studies on limiting current
oxygen. Garzon et al. prepared a limiting current O2 sensors constituted of 8 mol% Y2O3 stabilized ZrO2 (8YSZ)
solid electrolyte and La0.84Sr0.16MnO3 (LSM) dense diffusion barrier. The results show that LSM is prone to
chemical reaction with YSZ and cracking [10]. Peng et al. prepared a limiting current O2 sensor with YSZ solid
electrolyte and Pt/YSZ mixed materials diffusion barrier. The results show that the limiting current can achieve a
plateau when oxygen concentration range is from 0 to 1.8%, but the application of precious metal Pt greatly
increases the cost [11]. Therefore, cracks are not easy to appear between solid electrolyte and diffusion barrier, the
chemical stability of each other is good at high temperature, and the cost control of the sensor is an important
indicator. The oxygen ionic conductivity of Y2O3 doped CeO2 is greatly increased and is a good solid electrolyte
with good mechanical properties [12]. Meanwhile, the conductivity of ZrO2 doped CeO2 indicates that it has
electronic conductivity and can be as a dense diffusion barrier [13, 14]. So YDC and ZDC are assembled to a
limiting current O2 sensor, which have good chemical stability and high electrical conductivity, and may become
promising materials for O2 sensors.
In this paper, the researchers used co-precipitation to synthesize YDC and solid reaction method to synthesize
ZDC, and the characterization for both crystal structure and micro-structure of the two materials had been
conducted. The YDC and ZDC based limiting current O2 sensor was prepared by employing platinum pasting
3 sensing characteristics of the O2 sensor were conducted.
2. Experimental
Using co-precipitation to synthesize (CeO2)0.95(Y2O3)0.05 (YDC) and solid reaction method to synthesize
(CeO2)0.75(ZrO2)0.25 (ZDC). Directly use all the analytical reagents such as Ce(NO3)3·6H2O (purity 99.95%),
Y(NO3)3·6H2O (purity 99.99%), NH3·H2O (purity 0.1 M), Ce2(CO3)3·xH2O (purity 99.99%), ZrOCl2·8H2O
(purity 99.9%) and H2C2O4·2H2O (purity 99.99%) without prior purification treatment. Firstly, weigh reagents
Ce(NO3)3·6H2O, Y(NO3)3·6H2O and dissolve the reagents in distilled water by intense agitation. Drip reagent
NH3·H2O into nitrate salt solution and continuously stir the mixture until pH reached 9. Wash the obtained
precipitate by using distilled water and ethanol, then dry it at 70 ºC, calcine at 800 ºC for 2 h to obtain YDC solid
solution powder. Secondly, weigh the stoichiometric reagents Ce2(CO3)3·xH2O, ZrOCl2·8H2O and H2C2O4·2H2O
and mill them with agate beads for 96 h. Add 7 wt% Tween 60 into the above reagents at the 48th h. Calcine at 600
ºC for 4 h to obtain ZDC solid solution powder. Analyze the crystal structure of YDC and ZDC powders by using
XRD technology (Philips PW3040/60, Netherlands). Press the YDC and ZDC powders and sinter them at 1600 ºC
for 6 h in air to obtain sintered bodies for testing. Characterize the micro-structure of sintered bodies YDC and
ZDC by SEM equipment (Zeiss, Germany).
Prepare the YDC and ZDC based limiting current O2 sensor by employing platinum pasting bonding method.
Please refer to Fig. 1 for the structural drawing of the O2 sensor. Test and record the current-voltage (I-V)
characteristics of the O2 sensor by using electrochemical station (LK98BII, China) under different temperatures T,
oxygen concentrations x(O2) and water vapor pressure p(H2O). Adjust the above variable testing conditions by
setting the oxygen concentration from low to high, then setting the temperature from high to low and finally
setting the water vapor pressure from low to high. Adjust the oxygen concentration by mixing different portions of
4
and p(H2O) was controlled according to references [15-17]. Total flow rate of Ar/O2 flows was about 100 ml·min-1.
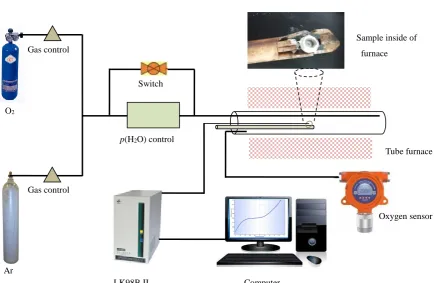
Fig. 2 demonstrates the I-V characteristics testing system[14].
Fig. 1 Structural drawing of the O2 sensor
Fig. 2 I-V characteristics testing system
3. Results and discussion
A Pt electrode
YDZ Glass glaze
ZDC
Glass tube
O2
Ar
Gas control
Gas control
p(H2O) control
Tube furnace
Oxygen sensor
LK98B II Computer
Sample inside of furnace
5 3.1 YDC and ZDC
The crystal structure of the YDC and ZDC powders is shown in Fig. 3 (a). It can be seen that YDC and ZDC are cubic phase CeO2, and a small amount of ZrO2 diffraction peaks are found in ZDC. The unit cell constants of
YDC and ZDC were calculated by GSAS software refinement as shown in Fig. 3 (b) and (c) [18]. The unit cell constant of YDC is a=b=c of 5.416 and the unit cell volume of 158.841. The unit cell constant of ZDC is a=b=c of 5.404 and the unit cell volume of 157.783. The YDC unit cell constant and unit cell volume are less than YDC due to the Zr ion radius being less than the Y ion radius.
20 25 30 35 40 45 50 55 60 65
ZDC
•⎯ CeO2
⎯ ZrO2
Inte
nsit
y (
a.u.)
2 (º)
YDC (a)
20 25 30 35 40 45 50 55 60 65
(b)
YDC Rwp=12.35% Rp=8.52%
=1.160
Inte
nsit
y (
a.u.)
6
20 25 30 35 40 45 50 55 60 65
(c)
ZDC Rwp=7.02% Rp=5.47%
=3.647
Inte
nsit
y (
a.u.)
2 (º)
Fig. 3 (a) Crystal structure of the YDC and ZDC, (b, c) unit cell constants of YDC and ZDC
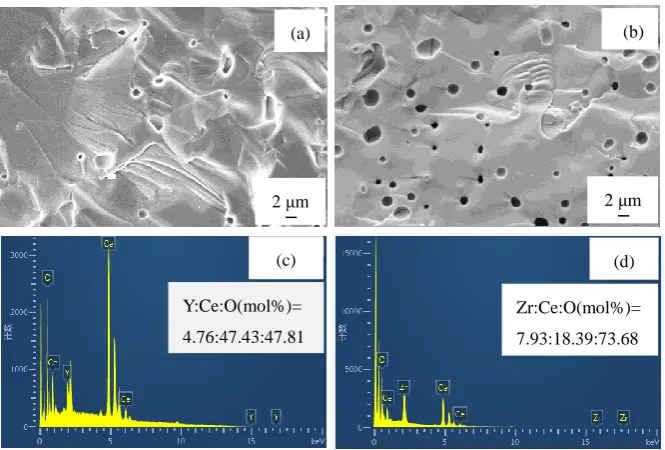
Fig. 4 (a) and (b) show the SEM images of YDC and ZDC sintered bodies from the cross-section side, and indicate that the cross-section grain of the sintered body is not obvious and the fracture is transgranular fracture. Fig. 4 (c) and (d) illustrate the elemental distributions of YDC and ZDC powders, which also clearly show that the molar ratios of Y to Ce and Zr to Ce are substantially comply with the stoichiometric ratios of YDC and ZDC solid solutions, respectively.
Fig. 4 (a, b) SEM images of YDC and ZDC sintered bodies, (c, d) elemental distributions of YDC and ZDC 2 μm
(a)
2 μm (b)
Zr:Ce:O(mol%)= 7.93:18.39:73.68 (d) Y:Ce:O(mol%)=
7
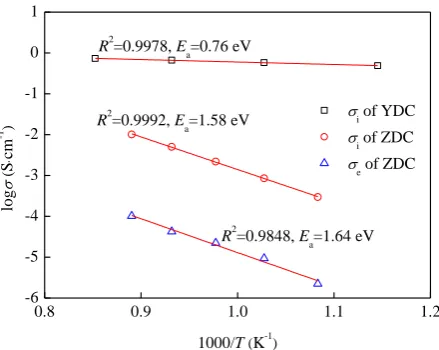
The ionic conductivity of YDC and ionic, electronic conductivity of ZDC are shown in Fig. 5 [12]. The electrical conductivities and temperature satisfy the Arrhenius law and the fittings have good fitting degree R2 of
0.9978 for ionic conductivity of YDC, 0.9992 for ionic conductivity of ZDC and 0.9848 for electronic conductivity of ZDC, respectively. The electrical conductivities of YDC and ZDC meet the requirements of solid electrolyte layer and dense diffusion barrier layer of the limiting current O2 sensor, respectively.
0.8 0.9 1.0 1.1 1.2
-6 -5 -4 -3 -2 -1 0 1
R2=0.9848, Ea=1.64 eV R2=0.9992, Ea=1.58 eV i of YDC
i of ZDC e of ZDC
lo
g
(
S
cm
-1 )
1000/T (K-1) R2=0.9978, Ea=0.76 eV
Fig. 5 Ionic conductivity of YDC and ionic, electronic conductivity of ZDC
3.2 I-V and T
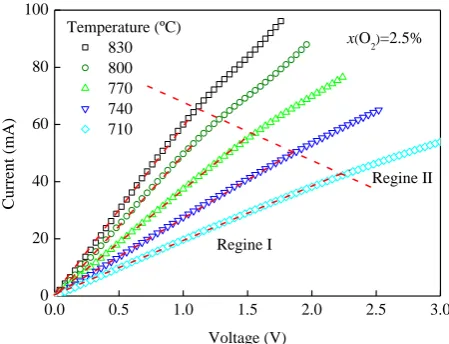
Measure the I-V characteristic of the YDC and ZDC based O2 sensor within the temperature range of
710-830 °C and control the O2 concentration at 2.50% to obtain the I-V characteristic curves as demonstrated in
Fig. 6, according to which, we can conclude that the curves mainly contains two areas, namely the ohmic area and the limiting current plateau area. In area I, with the increase of applied voltage, the output current increases linearly, owing to the ohmic behavior of YDC layer of the sensor [19].Theohmic slope has a certain relationship with the electrical conductivity of the solid electrolyte, and their change tendencies are the same. Meanwhile, electrical conductivity of the solid electrolyte increases or decreases just as temperature does, therefore, ohmic slope will also change toward the same direction as temperature does. In area II, slope of the I-V curve changes compared to that in area I, and the current in this area reaches plateau or close to plateau. Average current in this area is the limiting current value of the O2 sensor. Without a diffusion barrier, output current in area II will
8
barrier, oxygen will be blocked, and hence the reduced volume of oxygen that pass through the solid electrolyte layer, which then generates a new I-V slope. Voltage at junction of the two areas is the initial voltage of O2 sensor,
and normally the lower the initial voltage value is, the more sensitive the sensor is. There is a negative correlation between initial voltage and temperature, meaning initial voltage will decrease as temperature increases, because conductivity of ZDC dense diffusion barrier will increase as temperature increases.
0.0 0.5 1.0 1.5 2.0 2.5 3.0
0 20 40 60 80 100
x(O2)=2.5%
Regine II Temperature (ºC)
830 800 770 740 710
Curre
nt (mA)
Voltage (V) Regine I
Fig. 6 I-V characteristic curves at different temperature
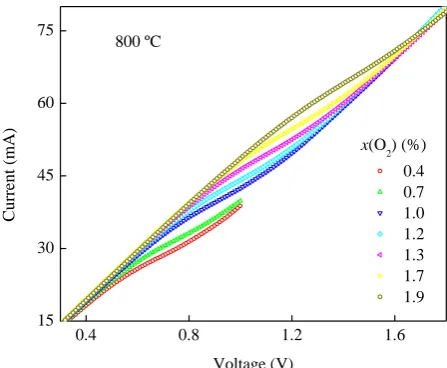
3.3 I-V and x(O2)
Fig. 7 demonstrates the I-V characteristic curves of the YDC and ZDC based O2 sensor with oxygen
9
rate from YDC layer is limited by oxygen diffusion rate from ZDC layer. When the pumping rate of the YDC solid electrolyte is limited by the oxygen diffusion rate of the ZDC dense diffusion barrier and the voltage increases to a certain value, the limiting current plateau is obtained. Initial voltage is positively related to oxygen concentration, which is consistent with phenomenon of other studies [20, 21].
0.4 0.8 1.2 1.6
15 30 45 60 75 800 ºC
x(O2) (%)
0.4 0.7 1.0 1.2 1.3 1.7 1.9 Curr ent (mA) Voltage (V)
Fig. 7 I-V characteristic curves in different x(O2)
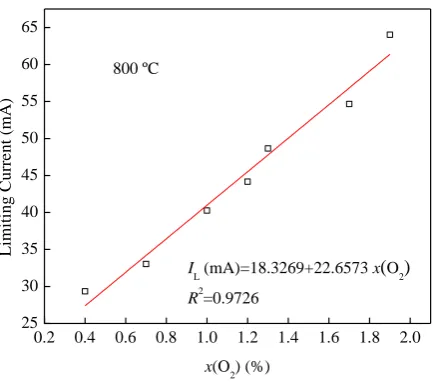
Fig. 8 demonstrates the linear correlation between the limiting current and the oxygen concentration at the temperature of 800 °C, and the linear correlation coefficient R2 is 0.9726. Refer to reference [2] for Knudsen
diffusion correlation theory, which is the same as this correlation.
) (O 4 2 K L x RTL SP FD
I = (1)
where DK is the oxygen diffusion coefficient, P the partial pressure difference between electrodes, T the
temperature, F the Faraday constant, R the gas constant, S the total cross-sectional area and L the length of diffusion path, respectively.
Solid state theory of solid ion diffusion mode, diffusion coefficient (DT) and temperature (T) is as follows:
= T k ε D D B O
T exp - (2)
10 Boltzmann constant, respectively.
Equation (3) is obtained by simultaneous equations (1) and (2):
) exp(-)
(O2 B
L x ε/k T
RLT SP 4FD
I = O (3)
Assuming the oxygen concentration is stable, then:
) (O2 x RL SP 4FD
a = O (4)
Equation (5) is obtained by introducing equation (4) into equation (3):
) exp(-1
B
L ε/k T
T a
I = (5)
Equation (6) is obtained by solving the logarithm of equation (5):
T k ε T I B L A-log
-log = (6)
and then,
B
-k ε
B = (7)
So get equation (8):
1 B log -A log L T T
I = + (8)
Equation (9) is obtained by sorting out:
1 B A ) ( log L T T
11
0.2 0.4 0.6 0.8 1.0 1.2 1.4 1.6 1.8 2.0 25
30 35 40 45 50 55 60 65
800 ºC
I
L (mA)=18.3269+22.6573 x(O2)
R2=0.9726
Limi
ti
ng Curr
ent (mA)
x(O
2) (%)
Fig. 8 Limiting current and the oxygen concentration at the temperature of 800 °C
Fig. 9 demonstrates the linear relationship between log(IL T) and 1000/T in x(O2) of 2.5% according to equation (9), and the linear correlation coefficient R2 is 0.9904. This relationship meets the Knudsen diffusion
model.
0.90 0.92 0.94 0.96 0.98 1.00 1.02 4.65
4.70 4.75 4.80 4.85 4.90 4.95 5.00
x(O2)=2.5%
R2=0.9904 log[I
LT] (mAK)=7.1894-2.44931000/T (K -1
)
log
[
IL
T
]
(
mAK)
1000/T (K-1)
Fig. 9 The log(IL T) and 1000/T in x(O2) of 2.5%
12
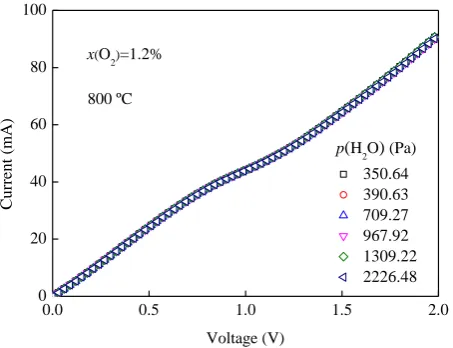
Fig. 10 demonstrates the effect of p(H2O) on I-V characteristic curves in oxygen concentration of 1.2% and at
temperature of 800 °C. As can be seen that the sensing characteristics of the O2 sensor obtained are almost
coincide under different p(H2O), indicating that the p(H2O) does not have significant effect on the I-V
characteristics within the test range. Some studies on the influence of p(H2O) on the limiting current sensor show
that the porous type sensor is affected by p(H2O), while the dense type sensor is not affected [14, 22, 23]. The O2
sensor has excellent selectivity to O2, which is an excellent indicator of the sensor.
0.0 0.5 1.0 1.5 2.0
0 20 40 60 80 100
800 ºC x(O2)=1.2%
p(H
2O) (Pa)
350.64 390.63 709.27 967.92 1309.22 2226.48
Curre
nt (mA)
Voltage (V)
Fig. 10 I-V characteristic curves and p(H2O) in oxygen concentration of 1.2% and at temperature of 800 °C
Conclusions
Using co-precipitation to synthesize YDC and solid reaction method to synthesize ZDC. Prepare a YDC and ZDC based limiting current O2 sensor by platinum pasting bonding method. XRD results show that YDC and
ZDC belong to cubic phase structure. SEM results show that the sintered bodies are dense and conform to the materials for limiting current O2 sensor. Log(IL·T) depends linearly on 1000/T with R2 of 0.9904, IL depends
linearly on x(O2) with R2 of 0.9726 and sensing characteristics are not affected by p(H2O), which indicating that
the O2 sensor has excellent sensing characteristics and conforms to Knudsen model.
Acknowledgement
13 References
[1] T. Liu, X.F. Zhang, L. Yuan, J.K. Yu, A review of high-temperature electrochemical sensors based on stabilized
zirconia, Solid State Ion. 283 (2015) 91–102.
[2] J.X. Han, F. Zhou, J.X. Bao, X.J. Wang, X.W. Song, A high performance limiting current oxygen sensor with
Ce0.8Sm0.2O1.9 electrolyte and La0.8Sr0.2Co0.8Fe0.2O3 diffusion barrier, Electrochim. Acta 108 (2013) 763–768.
[3] T. Liu, X.F. Zhang, X.N. Wang, J.K. Yu, L. Li, A review of zirconia-based solid electrolytes, Ionics 22 (2016)
2249–2262.
[4] X.N. Wang, T. Liu, J.K. Yu, Y.C. Mo, M.Y. Yi, J.Y. Li, L. Li, Preparation and electrical property of
CaZr0.7M0.3O3 (M=Fe, Cr and Co) dense diffusion barrier for application in limiting current oxygen sensor, Sens.
Actuator B-Chem. 266 (2018) 455–462.
[5] A.D. Brailsford, E.M. Logothetis, Selected aspects of gas sensing, Sens. Actuator B-Chem. 52 (1998)
195–203.
[6] T. Liu, X. Gao, B.G. He, J.K. Yu, A limiting current oxygen sensor based on LSGM as solid electrolyte and
LSGMN (N = Fe, Co) as dense diffusion barrier, J. Mater. Eng. Perform. 25 (2016) 2943–2950.
[7] X.F. Zhang, T. Liu, J.K. Yu, X. Gao, H.B. Jin, X.N. Wang, C. Wang, A limiting current oxygen sensor with
La0.8Sr0.2(Ga0.8Mg0.2)1-xFexO3-δ dense diffusion barrier, J. Solid State Electrochem. 21 (2017) 1323–1328.
[8] T. Liu, X.N. Wang, X.F. Zhang, X. Gao, L. Li, J.K. Yu, X.T. Yin, A limiting current oxygen sensor prepared by
a co-pressing and co-sintering technique, Sens. Actuator B-Chem. 277 (2018) 216–223.
[9] Y.C. Mo, T. Liu, C. Wang, A limiting current oxygen sensor based on (La0.4Ce0.6O2-δ)0.96(FeO1.5)0.04 as dense
diffusion barrier, Ceram. Int. 45 (2019) 8319–8324.
[10] F. Garzon, I. Raistrick, E. Brosha, R. Houlton, B.W. Chung, Dense diffusion barrier limiting current oxygen
14
[11] Peng Z Y, Liu M L, Balko E, A new type of amperometric oxygen sensor based on a mixed-conducting
composite membrane, Sens. Actuator B-Chem. 72(2001) 35–40.
[12] C.Z. Wang, Solid electrolytes and chemical sensors, Metallurgical Industry Press. 100.
[13] X.N. Wang, T. Liu, C. Wang, J.K. Yu, L. Li, Crystal structure, microstructure, thermal expansion and
electrical conductivity of CeO2-ZrO2 solid solution, Adv. Appl. Ceram. 116 (2017) 477–481.
[14] X.N. Wang, T. Liu, J.K. Yu, L. Li, X.F. Zhang, A new application of CexZr1-xO2 as dense diffusion barrier in
limiting current oxygen sensor, Sens. Actuator B-Chem. 285 (2019) 391–397.
[15] N.A. Gokcen, Vapor pressure of water above saturated lithium chloride solution, J. Am. Chem. Soc. 73 (1951)
3789–3790.
[16] T.W. Chung, C.M. Luo, Vapor pressures of the aqueous desiccants, J. Chem. Eng. Data 44 (1999) 1024–1027.
[17] P. Kolár, H. Nakata, A. Tsuboi, P. Wang, A. Anderko, Measurement and modeling of vapor-liquid equilibria at
high salt concentrations, Fluid Phase Equilib. 228-229 (2005) 493–497.
[18] B.H. Toby, EXPGUI, a graphical user interface for GSAS, J. Appl. Cryst. 34 (2001) 210–213.
[19] T. Usui, A. Asada, M. Nakazawa, H. Osanai, Gas polarographic oxygen sensor using an oxygen / zirconia
electrolyte, J. Electrochem. Soc. 136 (1989) 534–542.
[20] X. Gao, T. Liu, J.K. Yu, L. Li, Limiting current oxygen sensor based on La0.8Sr0.2Ga0.8Mg0.2O3-δ as both dense diffusion barrier and solid electrolyte, Ceram. Int. 43 (2017) 6329–6332.
[21] X. Gao, T. Liu, X.F. Zhang, B.G. He, J.K. Yu, Properties of limiting current oxygen sensor with La0.8Sr0.2Ga0.8Mg0.2O3-δ solid electrolyte and La0.8Sr0.2(Ga0.8Mg0.2)1-xCrxO3-δ dense diffusion barrier, Solid State Ion. 304 (2017) 135–144.
[22] C.M. Mari, G. Rabotti, Humidity determination by solid state limiting current sensor, Solid State Ion. 124 (1999) 309–315.