Article
1
Implementing vertical farming at university scale to
2
promote sustainable communities: A feasibility
3
analysis
4
Zhang He1, Asutosh, A.T.2*, Wei Hu2
5
1. M.E. Rinker, Sr. School of Construction Management, University of Florida;[email protected]
6
2. M.E. Rinker, Sr. School of Construction Management, University of Florida;[email protected]
7
3. School of Statistics, Renmin University of China; [email protected]
8
4. * Correspondence: [email protected], Tel: +1-(352)-745-9946
9
10
Abstract: The world is facing several global issues such as food and energy crisis, climate change
11
and greenhouse gases emissions. To subdue these issues, many entities from academia and
12
industries have innovated alternate techniques of performing regular activities which cause such
13
problems. One of these innovations is the introduction of vertical and zero acreage farming in the
14
field of sustainability. These carry the potential to solve one of the most important affairs of food
15
security in most countries of the world. But, this technology has been in its nascent stage for many
16
years. This paper uses a comprehensive framework proving the feasibility of initiating vertical
17
farming on university campuses to feed the staff and students, which could also set an example to
18
the rest of the world into using this technique on a wider scale. The study chose Huazhong
19
University of science and technology (HUST) in Wuhan city, China for accessing the return on
20
investment and food sufficiency if vertical farming is implemented. Using Central Limit Theorem,
21
a statistical model was developed, and various scenarios were analyzed. The results indicated that
22
if a separate vertical farm is constructed, the breakeven can be achieved in a range of 10-20
23
depending on parameters such as type of operation, number of floors and amount of vegetation.
24
The study has shown that the use of vertical farming cannot only bring in revenue for the campus
25
but also aid in mitigating climate change.
26
Keywords: Vertical farming; Zero acreage farming; University; Sustainability; Economics; Climate
27
change
28
29
1. Introduction
30
The issue of food and nutrition security is at crux which we are experiencing on Earth in today’s time.
31
A recent study shows that over 815 million people are facing food insecurity which is an increase of
32
38 million due to climate change and proliferation of vicious conflicts [1]. According to these numbers
33
in our current scenario, we must take the responsibility in mitigating this problem and to chase the
34
Sustainable Development Goals 2030 of United Nations, to eradicate hunger and poverty. At present,
35
the global food system is subjected to pressure in delivering food to the ever-growing population.
36
The consumer behavior and food production practices play important roles inefficiency of every type
37
of food system [2]. By 2050, almost 80 percent of the population will reside in urban areas. According
38
to traditional food production practices, an extra of 1 billion hectares of land will require feeding the
39
growing population in the meanwhile [3]. The scarcity of land and depleting of natural resources
40
have been a driving factor to find smart solutions in this fast-moving world. There have been many
41
successful attempts in research and innovative solutions to fight this issue in our built environment.
42
One of such innovation is the integration of farming into the building structure which is termed as
43
“Vertical Farming”. It is an alternate method where the food supply chain is shifted directly from the
44
producer to the consumer. This results in significant low carbon footprint and is environmentally
45
sustainable [4]. Although this concept has remained in its nascent state, there are real-time examples
46
which prove that vertical farming is a sustainable way to feed the best quality produce by spending
47
less amount of energy. Countries such as United States, Japan, and Singapore have shown significant
48
results in applying vertical farming to their buildings. This study provides a framework which
49
encourages institutions such as universities into adopting this system for their students. This study
50
also investigates food data from Huazhong University of Science and Technology (HUST) in China
51
which has over 24 canteens and compares the production and financial outcome using vertical
52
farming. This could lead the institution into producing their own food on site and use the financial
53
benefits to something more valuable. Additionally, this could also be a chance for all the commercial
54
and residential sectors in taking the initiative to mankind and environmental responsibility. This
55
study looks at the approach to vertical farming and how it could contribute to saving fossil fuels and
56
reduce resource wastage.
57
2. Materials and Methods
58
2.1 Definitions
59
There are various definitions of Vertical Farming but to put into simple words, it is a method of urban
60
farming of fruits, vegetables, and grains, inside a building in a city or urban centre, in which floors
61
are designed to lodge crops with the absence of soil ( Hydroponics & aeroponics) [5]. Using large
62
multistory buildings to cultivate agricultural produce was an incredible idea by Gilbert E. Bailey,
63
who was an American geologist. His book simply titled “Vertical Farming” was revolutionary in the
64
field of modern agriculture [6]. In the early 1980s, Dr. Yeang who was a Malaysian-born architect
65
advanced the ideas of Mr. Gilbert into the subset of arch itectural design. He believed that the way
66
agricultural products were grown, and all human activity must be based upon “eco-mimicry”, which
67
means that to be deeply sustainable, all built or devised human environments must mimic the,
68
patterns, characteristics, attributes and cycles of natural ecosystems [7]. Another definition states that
69
Vertical Farming is a system of commercial farming whereby plants, animals, fungi and other life
70
forms are cultivated for food, fuel, fibre or other products or services by artificially stacking them
71
vertically above each other [8]. The concept of supplying food using the city is not modern but the
72
idea of dedicating an entire building/skyscraper to cultivate produce is which is the concept of
73
vertical farming is a large-scale extension of urban agriculture within a building. [9]. Another concept
74
which is recently coined known as “Zero Acreage farming”’. It implies the farming which is carried
75
without using any additional farmland such as using rooftop gardens, indoor farming, rooftop
76
greenhouses. These are categorized as a subset of urban farming which is sustainable and
77
decentralized [ 10 ]. This concept has been introduced in cities such as Berlin (Germany) and
78
encourages other cities to incorporate these practices with recognizing its benefits and challenges
79
[10]. This could also be one of the trends which could give the common people control on their
80
produce quality and quantity
.
81
According to the U.N. (United Nations), the population of the world through mid-2017 was 7.6 billion
83
and is projected to reach 9.8 billion by 2050 and 11.2 billion by 2100 [11]. It is estimated that 19.5
84
million hectares of agriculture land are converted to urban centres and industrial developments
85
annually [ 12 ]. This is because cities are the hubs of ideas, science, jobs, productivity, social
86
development, prosperity and more. Due to the rapid urbanizations, resources such as water supplies,
87
sewage, biodiversity, land and soil resources and public health is under pressure. The sustainable
88
development of urban and rural areas requires addressing the demands for social, economic and
89
environmental land use in an integrated approach. Over 2 billion hectares of cultivable land is
90
degraded, and more than 1.5 billion people are living off the degraded land. Severe droughts in 2017
91
have led to starvation and famine which affected more than 25 million people [13].
92
A study done by Crawford School of Public Policy and Australian National University estimated 4.3
93
to 20.2 trillion dollars annually is lost in global land use change [14]. The direct costs of degradation
94
of land amount to approximately USD 66 billion per year [15]. The world needs an increase of 70
95
percent in food production to feed the 9.5 billion people expected to live by 2050 [16]. China had
96
population of 13,82,710,000 which is a rise of 8,090,000 compared to 2015. With 145 people/square
97
km, it was in the 138th ranking density in 2016 [17]. Interestingly, out of 130 million square kilometres
98
of ice-free land, about 46 percent is currently being for farming and forestry and 7 percent is
99
considered urban/pre-urban [18]. FAO estimates that up to 25 percent of the land is currently highly
100
degraded and 36 percent is moderately degraded while 10 percent is merely improving [19]. Two of
101
the most populated nations in the world have almost 42 percent of its population facing chronic
102
hunger [20]. The unprecedented explosion of megacities may lead to unstainable and ecological
103
disaster. In the year 2000, the megacities in the world took up to 2 percent of the earth’s land which
104
accounted for approximately 75 percent of the industrial use of wood, 60 percent of water use and 80
105
percent of carbon emissions [21].
106
107
2.2.1 Food and nutrition security
108
Over 8.7 million species are thought to have been living on the planet out of which 8 percent are
109
extinct and 22 percent are at risk of extinction due to habitat destruction [22]. There are numerous
110
studies which have indicated the impacts on food security by climate change [23]. Sustainable
111
management of land can minimize the impacts of conventional farming. By introducing vertical
112
farming, externals independents such as pesticides, heavy machinery and others can be reduced
113
significantly. Resources such as water and energy can also be minimized. This will help in improved
114
soil nutrient availability [24]. Fortunately, there are many ways to achieve such as afforestation, pest
115
management, soil erosion control, vegetation management and others.
116
117
2.2.2 Climate change
118
The average global temperature has risen by 0.85°C. For every increase in 1 degree, grain yield decline
119
by about 5 percent. The carbon emission grew rapidly in the last three previous decades from 2000 to
120
2010 [25]. The figures below demonstrate these increments through recent years which proves climate
121
change is real. Since 2001, the years have shown the warmest temperatures on a span of 136-year
122
record (Figure 1). The Consumption of food with low energy profiles have a substantial effect on
123
serious health issues such as obesity reduction and mitigation of climate change. Also, increase in
124
substantial role in meeting targets for GHG emissions and would result in major public-health
126
benefits [26]. The increase in greenhouse emissions is a major contributor to climate change and the
127
data from some of the largest economies can be observed in (figure 2).
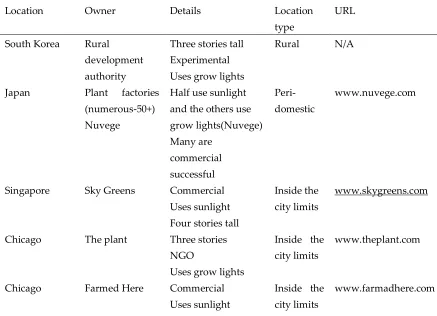
128
129
130
Figure 1: Global land-ocean temperature index
131
132
133
Figure 2: Greenhouse gas emissions for major economies
134
135
136
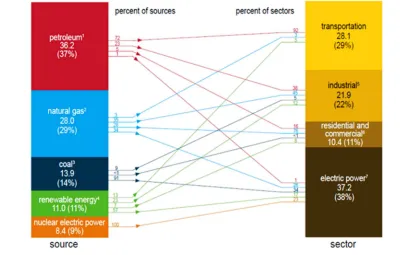
2.2.3 Energy crisis
137
Energy is the leading contributor to climate change, accounting for almost 60 percent of total global
138
greenhouse gas emissions. The rapid scaling up of low-carbon, clean and renewable energy sources
139
is a key solution in long-term climate goals. It is a keen factor to consider in the sector of farming.
140
Research shows that almost 1.4 billion people lack access to electricity and 2.7 billion people rely on
141
traditional use of biomass cooking. By 2030, 1.2 billion people will still lack access to electricity out of
142
The pattern across various industries with respect to different available sources (Figure 3). This
144
indicates that there is an urgent need for shifting from non-renewables to renewables. Also, 92
145
percent of the petroleum (fossil fuels) are used in transportation industry which can be saved by
146
using techniques such as vertical farming.
147
148
149
Figure 3: Energy consumption pattern across industries and their sources
150
151
152
2.2.4 Water
153
A land development is associated with a water decision and water management is very essential.
154
Sustainable land practices must include improvement of water efficiency and quality in a
cost-155
effective way as well as the restoration of ecosystems which are intended to mitigate water scarcity.
156
In case of vertical farming, the issue of water scarcity is significantly minimized. Water scarcity affects
157
almost 40 percent of the global population and with 1.7 billion people living on river basins where
158
recharge is minimal compared to usage, it can be dangerous for survival. Additionally, the water
159
discharge for irrigation peaks to 70 percent in the world of the total consumption and 80 percent of
160
the wastewater are simultaneously put free into the environment [28]. A study at the James Hutton
161
Institute found that up to 10 million of GBP could be saved over 25 years implementing sustainable
162
land management measures in a large drinking water catchment [29]. Vertical farming has a large
163
potential in saving consumption for the food production and the system can be designed to go off
164
grid (municipal supply).
165
166
2.2.5 Supply chain logistics
167
As from the describing the industries contributing to climate change, transportation on the second.
168
This refers to the supply chain logistics of the food industry (figure 4). The flowchart in the figure
169
describes a typical food supply logistics cycle. It can be inferred that using the vertical farming
170
machinery, labour and money are spent in the food industry. The most important resource is the time
172
which is heavily invested in providing food to the people. The rapid depletion of fossil fuels and
173
development of new technology has led to rethinking the process of food production and delivery.
174
Vertical farming can be promising in saving precious resources of the planet and provide better
175
health opportunity to the common man. Most importantly, there is a cost involved in every step of
176
this process which can be diverted into producing more food for the common people [30,31].
177
178
179
180
Figure 4: Agricultural producer to consumer logistic cycle
181
182
2.3 Types of vertical farming
183
2.3.1 Aquaponics
184
This is a type of vegetation production which includes edible and non-edible sources that combine
185
supporting the aquatic ecosystem (fish, snails and others) with a hydroponic system (harvesting with
186
only water & nutrients) in a symbiotic environment. The residue from the aquatic animals being
187
raised in the tank which gets suspended increase the toxicity of the water. These are then broken by
188
the nitrogen-fixing bacteria into nitrates and nitrites which are fed into the hydroponics systems used
189
by the plants as nutrients. It is a continuous cycle where the water is constantly recirculated where
190
the roots of the plants are impeded in nutrient-rich water. The water which has passed through the
191
hydroponic subsystem is cleaned and oxygenated which is returned to the aquaculture tanks. These
192
systems working together enable the ammonia that is toxic to the aquatic animals to be filtered out
193
of the system, while at the same time providing nutrients to the plants [32].
194
195
2.3.2 Hydroponics
196
Hydroponics is a subdivision of hydroculture where the plants are grown without soil, instead of
197
using mineral nutrient solutions in a water solvent. Certain plants such as terrestrial plants can be
198
grown with their roots exposed to the mineral solutions which could be supported by an inert
199
medium. One of the interesting parts of this system is that the nutrients can come from a plethora of
200
sources and not confined to duck manure or fish waste [33]. This requires minimal labour, time and
201
energy. Additionally, there many methods of installation of these systems and can be chosen
202
decreased use of toxic agrochemicals, pesticides and others. To prevent excess costs and increase
204
profits, hydroponics is based on automation of nutrient supply. Several types of research are aimed
205
at automation of nutrient cycle in closed systems and standardization of the substrate analysis [34].
206
207
2.3.3 Aeroponics
208
Aeroponics is based on the principle of cultivating plants where the roots are not immersed in any
209
kind of substratum or soil but immersed in containers filled with flowing plant nutrition (Figure 5).
210
This method uses a continuous cycle in an enclosed space and enables the workforce to learn the
211
skills in a short time whereas in traditional agriculture the workforce requires skills which are not
212
easily transferable. Putting these systems into perspective, to products 1 kilogram of tomatoes, it
213
requires up to 400 litres in traditional irrigation, 70 litres in hydroponics and only 20 litres in
214
aeroponics [35]. Furthermore, instead of using the richest soil for plants in traditional methods,
215
aeroponics allows the oxygen to provide nutrients to the rhizosphere which is the root zone of the
216
plant [36].
217
218
219
Figure 5: Pictorial representation of an Aeroponics system
220
221
2.4 Advantages of vertical farming
222
Vertical farming can produce a harvest that is environmentally friendly, nutritious and affordable
223
[37]. These farms would not require long-distance transportation resulting in reduced fuel usage,
224
which is currently consumed (20 percent) by of all USA. [38, 39]. Plants would be grown using
225
technologies such as aeroponics or hydroponics which requires little or no soil-based traditional
226
agricultural practices [9, 40 ]. Vertical farming not only produce crops year-round and be more
227
environmentally-friendly but also will make more efficient use of waste. According to Despommier
228
(2007), a city’s grey, brown and black water waste could be used for irrigation. Solid waste and plant
229
matter could be converted to methane gas using anaerobic digesters that could then be used to
230
generate electricity for the farm.
231
A vertical farm could also help diminish unemployment issues faced in many urban settings. The
232
farm would need workers to construct and maintain the structure. Also, they can include a system of
233
grocery stores, organic food markets, and eateries, and local distribution and transportation networks
234
psychosocial perspective, consumers will find confidence and comfort in knowing where their
236
produce came from [42].
237
By growing food in a neighbourhood, natives would not only have access to a year-round supply of
238
healthy food but also would have the security that their food locally grown and because there is a
239
limited transportation demand, the prices would be lower. Because of lower prices and better access
240
to a healthy diet, the neighbourhood can witness an increase in their general health by lowering their
241
risks of diseases [43]. Employees of the farm can directly sell their produce at reasonable prices to the
242
members of the community. It is reported that these types of farmers feel more satisfied in selling the
243
food to people with whom they have long-term relationships [38]. While using 90 percent less water
244
than a conventional farm, the Den Bosch farm in the Netherlands has been able to achieve yields that
245
are virtually three times greater than the average soil-based production system [44].
246
247
2.5 Existing vertical farms
248
There are several examples in the world that proves that vertical farming is a much better alternative.
249
Although there are many case studies over the world, the right amount of information is still not
250
accessible. The paper investigates four such success stories which have set an example of having
251
vertical farming including (Table 1). The future farm known as ‘plant lab’ in Den Bosch, Netherlands
252
uses artificial environmental planning for growing strawberries, bananas and other fruits. It showed
253
that the plants grew 3 times faster in LED and hydroponics than in general conditions which would
254
rely on pesticides and agrochemicals [45].
255
256
Table 1: Existing vertical farms in the world.
257
258
Location Owner Details Location
type
URL
South Korea Rural
development authority
Three stories tall Experimental Uses grow lights
Rural N/A
Japan Plant factories (numerous-50+) Nuvege
Half use sunlight and the others use grow lights(Nuvege) Many are
commercial successful
Peri-domestic
www.nuvege.com
Singapore Sky Greens Commercial Uses sunlight Four stories tall
Inside the city limits
www.skygreens.com
Chicago The plant Three stories NGO
Uses grow lights
Inside the city limits
www.theplant.com
Chicago Farmed Here Commercial Uses sunlight
Inside the city limits
Vancouver Alterrus Uses sunlight Four stories tall
Inside the city limits
www.alterrus.com
259
An office headquarters of Pasona located in downtown Tokyo which is 9 stories has been using
260
hydroponics and soil-based farming inside the building. Apart from profits of plantation and beauty,
261
the shading causes a reduction in energy usage, improved occupant health, the increased comfort of
262
employees and others. The office contains 200 species of fruits, vegetables and rice which comprises
263
a total space of 43,000 square feet [46]. Other techniques such as underground controlled environment
264
agriculture (CEA) and underground pharming has also been applied. This shows a golden
265
opportunity for commercial sectors to be independent of the current food chain and logistics and
266
becoming self-sustainable. Research has shown there is immense potential in using community and
267
roof gardens to produce vegetables and fruits in dense neighbourhoods. The farming concrete project
268
in New York mapped all the community gardens into tracking the amount of production of plants.
269
A study at the University of Bonn (Germany) experimented the economic feasibility of vertical farm
270
by constructing. The farm was hosted by 37-floor high building and was simulated in Berlin. The
271
farm yielded about 3500 of vegetables and fruits, 140 tons of tilapia fillets which was 516 times more
272
than a quarter of hectares footprint of stacking multiple harvests. The building costs up to € 210.5
273
million dollars including equipment. The crop production was around 500 times more than growing
274
them at same area [47]. The building which will house the vertical farm can be net zero for energy,
275
water and waste as there would no human habitat and interior structure will remain simple. The
276
building can go through many programs such as LEED (Leadership in Energy and Environmental
277
Design), LBC (Living Building Challenge) and others to ensure sustainability and generate revenue
278
throughout the lifecycle of the building.
279
Innovations in Fuji City (Japan) experimented vertical farming in March 2015. The total floor space
280
enclosed 185.5 square meters and focused on leafy vegetables. The production rate is around 12,420
281
stems/roots/day. The factory grows five varieties of lettuces, mainly frilled lettuce, green leaf and
282
romaine. It has advanced, automatically-controlled equipment that monitors everything from air
283
temperature, humidity, and CO2 concentration to nutrient liquid. Secondly, a company named
284
SPREAD Co. Ltd. has implemented one of the world's first large-scale vegetation in form of vertical
285
farming that is fully automated. It is proficient of producing 30,000 head of lettuce per day. It encloses
286
an area of 4,400 square meters and is projected to start shipping in summer of 2017. The investment
287
including R&D services and test facilities was approximately 1.6 to 2 billion yuan. The plant recycles
288
98 percent of the water used for cultivation in the factory. Labor cost has been reduced by 50 percent
289
by fully automating the processes from seeding to harvest. Importantly, Energy cost has been
290
reduced around 30 percent per head of lettuce with the use of LED lights specifically created for
291
SPREAD and the development of a unique air conditioning system with an initial investment
292
reduction of 25 percent cost per head of lettuce [48]. It is estimated that roughly 20 percent of plant
293
factories are making profit, 60 percent are breaking even, and 20 percent are losing money. The
294
number and percentage of plant factories that are profitable have been increasing steadily since 2009.
295
Depreciation costs account for roughly 30 percent, labor costs for 25 percent, and electricity [49]. In
296
2014, Mirai and Mitsui Fudosan Co., Ltd. initiated a full-scale operation of one of the largest plant
297
factories in Kashiwa-no-ha Smart City, Japan. The facility was targeted to produced 15 types of
298
been successful in vertical farms and there are many case studies to learn from. One of them is the
300
Singapore skygreens. The 4 stories rotating greenhouse produces 1 ton of leafy greens on alternate
301
days using a hydraulic-driven system that rotates and provides sunlight for the growing holders. The
302
farm consists of 1,000 vertical towers and produces 800 kilograms of spinach, Chinese cabbage and
303
other greens for everyday use to provide the active Southeast Asian metropolis [51]
304
305
2.6 A spotlight on China
306
China is one of the largest countries in the world with a population of 1.42 Billion as of 2017 [52]. It
307
has experienced high rates of urbanization in the recent years. One of the evidence is the floor space
308
of completed buildings in 2013 was almost double that of 2007 [53]. The United Nations predicted
309
that the percentage of China’s urban residents was expected to be 60 percent by 2020, and the urban
310
population would increase 350 million by 2025 with 219 cities having a population of more than 1
311
million (compared to 35 cities in Europe) [54]. The demand for land for urban housing soared along
312
with demand for business and built-up land use. Consequently, much of the farmland was converted
313
into non-agricultural built-up environments [55,56]. A land alternation survey performed by the
314
Ministry of Land and Resources in 2011 found that about 91.05 percent of the farmland loss was
315
caused by usurpation for construction, cultivated land is down to only 0.08ha/person, nationwide, a
316
figure which is just 40 percent of the world average [57]. For all these reasons, China started the
317
research and practice of vertical farming in early 2004 and being widely introduced in the market
318
since 2011. Meanwhile, because of the Low manufacturing costs and labour costs relative to other
319
developed countries, the industry attracted a huge amount of investment. For instance, in 2014, the
320
Evergrande group from China invested a billion dollars to established 22 vertical farming [58]. Dr
321
Qichang Yang as the chief scientist presided over the research which funded 8 million U.S dollars on
322
intelligent plant factory production technology, national high science and technology project.
323
Organized by Chinese Academy of Agriculture sciences [59]. However, even though the vertical farm
324
in China is growing rapidly, the government policy and economic support are still a very limited
325
contribution to its fullest potential which leads to project defects of operational capability and
326
maintenance defects. Furthermore, it caused low economic benefits and high energy consumption
327
[60]. Under current national policy and legal system, it is hard to solve the problems about lifecycle
328
cost of a vertical farming project such as maintenance, monitoring, marketing and energy utility is
329
hard to increase the acceptability of vertical farming between the public community. Another adverse
330
factor is lack of regional scientific research institution except certain state-level lab doing research on
331
vertical farming, which led to the local vertical farming project cannot effective technical support
332
[61,62]. This paper focuses on developing a framework to look at the feasibility of having vertical
333
farms starting from university scale.
334
Universities have a huge demand from young people. As of 2016, China had 2596 universities
335
compared to its population of 1.379 billion [63]. This implies the staff and students will be on a
336
constant growing curve in the upcoming years. We believe that educational universities have
337
managed to have stable income sources for many years. A report from 2017 by Economic
338
Commentary states that the individual fees of the students have risen in private and public
339
universities [64]. This is a very big opportunity to introduce vertical farming to showcase the benefits
340
According to a 2017 report, the unit price for a kilogram of rice is $0.75-$0.77 . It takes about 100~240
342
days with two production periods (April-July and August -October) [65]. For 0.0667 hectares (equals
343
to 1 mu), the costs involved are $22.3 for fertilizer, seed and $23 for corresponding pesticide, labour
344
force $46.15 RMB, rent for land $46.5 which equals to a total cost of $107.7 to $138.5 in typical
345
conditions. In 1996, 19.51 hundred million mu of farming area was available but in 2010 only 18.26
346
hundred million mu of farming area was available. The area of farmland per capita is 1.38 (only 40
347
percent of World average). Only 6.09 percent of total farming land have an ability which can produce
348
Over 1000 kg per mu. Table 2 is an example where it shows the agricultural demand of China in 2012
349
and the numbers increase as the population rises. This is a burden on the farmers as well as the
350
acquisition of more fertile land.
351
352
Table 2: Average agricultural demand in China in 2012
353
354
Daily Product
Beans& Nuts
Livestock Fish& Shrimp
Eggs Vegetables Fruits Grains
Daily
demand(g/person/day)
300 30-50 50-75 75-100 25-100
300-500 200-400
250-400
Conversion factor (1/edible rate)
1.00 1.30 1.00 1.75 1.19 1.15 1.39 1.19
Annual Min. demand(kg/person)
110 14 18 48 11 126 101 109
Annual Max. demand(kg/person)
110 24 27 64 22 210 203 174
Population 100(million)
13.08 13.08 13.08 13.08 13.08 13.08 13.08 13.08
Annual Min. demand (100 million tons)
1.432 0.186 0.238 0.626 0.142 1.647 1.327 1.420
Annual Max. demand (100 million tons)
1.432 0.310 0.358 0.835 0.284 2.745 2.654 2.272
355
In Wuhan, which is a city in China has a population of 10.2 million has an urban area of 8494 square
356
kilometres. There is a severe shortage of agricultural land and resources suffer inflation of prices.
357
Only 61.3 percent of agricultural land is cultivable, and rest includes forestland, pasture area, park
358
area and others. The national land contamination rate in China is 19.4 percent. Over 4.7 million
359
hectares of land in steep slope cultivation which gives rise to serious soil erosion, main component
360
parts of erosion matter are coming from farmlands. Additionally, there is a huge economic issue for
361
these farmers and direct farm income is no longer the only source [66]. Wuhan has many universities
362
and one of them is Huazhong University of Science and Technology which is one of the largest
363
universities in China. This university was chosen to test the feasibility of implementing vertical
364
366
2.7 Methodology
367
This study reviewed the latest trends in technology and best practices on vertical farming from google
368
scholar and trade information around the world. In the first step, the data of existing vertical farm
369
practices was collected through media and literature research. A survey that was carried out in
370
Huazhong University of Science and Technology (HUST) in the city of Wuhan, China to find out the
371
average daily food requirements across campus including students, staff and faculty. HUST is one of
372
the largest universities in China. The campus has 24 canteens which bring food from all over the
373
province to feed its enormous population of 57,839 people. The university as of January 2018 has
374
24599 undergraduates, 23140 graduates and 5500 staff and 4600 retire [67]. The climate, logistics and
375
demand of the city were taken into consideration while analyzing the demand proportions. In the
376
survey, with the help of General Services Department and Data Information Centre of HUST, food
377
consumption and demand data were collected from all canteens and restaurants in the campus
378
boundary. The data was then segregated into types of food, seasonal variations, amount of
379
consumption and their cost. A mixed method mode was chosen for this research to find the feasibility
380
and challenges to introducing vertical farming on the campus of HUST which could encourage
381
sustainable urban agriculture and be self-sustainable while being independent of external farming
382
conditions. Based on Central Limit Theorem, a statistical concept model was developed to determine
383
the financial scenario if a vertical was built and operated on campus to supply food to the people
384
belonging to the university. Using this model and previous case studies, a qualitative and
385
quantitative analysis was carried out for governing the advantages and challenges of modern urban
386
agriculture in this genre of our built environment. The data focused on two aspects, the one is the
387
production capacity of the current global vertical farms, such as annual output value, production
388
efficiency, vegetable species and economic benefit. And another is the usage condition of vertical
389
farming technologies. In the next step, we chose Huazhong University of science and technology
390
(HUST) as a sample to gather the specific information of all 24 canteens about procurement chain and
391
supply quantity. The data for total fruits and vegetables consumed the year 2016 was collected.
392
According to the annual report, the total amount of fruits and vegetables consumed were 2,639,720.40
393
and 108,164 kilograms respectively which resulted in a total cost of $2,477,247.38. The individual
394
breakdown of these plants and their costs associated were collected and analyzed.
395
396
The Assumptions made for the model to conduct this study were
397
1. The vertical farm building is simple box-shaped having a building footprint of 5000 square
398
meters.
399
2. The building can provide more than 6.67 hectares of planting space by Multilayer cultivation.
400
3. The construction price for each square meter is about 1450 RMB or $227. (In Wuhan, China)
401
4. Unpredictable factors such as building materials were temporarily ignored, the average building
402
cost resulted in 5.25 million per floor.
403
5. 0.0667hectares which are equal to 1 mu (Chinese standard farmland area unit)
404
6. Under typical conditions, the costs included in the cost of 145 RMB fertilizer, corresponding
405
electricity and water 150-RMB, labour force 300 RMB, land 300 RMB equivalent to the total cost
406
7. Annual operating costs are 5,000 RMB ($775.20)
408
8. We give two types of changes of operating costs per year. One is that the annual cost this year is
409
500 more than the previous year, and the other is that the annual cost this year is 1.1 times of the
410
previous year.
411
9. The canteen's vegetable prices are considered fixed each year.
412
10. Cucumber-30000 kg per 0.0667 hectares
413
11. Tomatoes, two times a year, 20000 kg/0.0667 hectares, 40000 kilograms per 0.0667 hectares per
414
year
415
12. Pepper, once a year, 5000 kg/0.0667 hectares
416
13. Carrots, two times a year, 10000 kg/0.0667 hectares/year
417
14. Chinese cabbage, once a year, 10000 kg/0.0667 hectares/year
418
15. Chinese cabbage, 8 times a year, 10000 kg/0.0667 hectares/year
419
16. Kale, two times a year, 3000/0.0667 hectares,6000 kg/0.0667 hectares per year
420
17. lotus root, once a year, 2000 kg/0.0667 hectares
421
18. If the building has only one floor, then we can assume the cost of the building is about 15 million,
422
else if the building has three floors, then we can assume the cost of the building is about
423
15+10+10=35 million.
424
425
3. Results
426
The goal behind the statistical model was to calculate the following
427
1. Breakeven time on the initial investment.
428
2. Profits which can be generated from the vertical farm if the eligible resources are recycled?
429
From the Central Limit Theorem, the output was set for nine varieties of vegetables to be random
430
variables that satisfy the normal distribution. The mean value is the aforesaid annual output of mu,
431
and the standard deviation parameter is set to 1/10th of the yield per 0.0667 hectares per year as
432
shown in formula 1.
433
434
⎩
⎨
⎧
_1~ ( ,
)
_ ~ ( ,
)
⋮
_10~ ( ,
)
435
The formula shows the annual output of each of the nine varieties of vegetables that satisfies the
436
normal distribution expression. The output of different vegetables does not affect each other
437
independently. (assuming climate conditions are maintained). W is used to indicate the silent costs
438
which are the initial investment of the vertical farm. Op costs (operating costs) is used to represent
439
the annual operating costs, num_unit_i to represent the number of 0.0667 hectares of [i]th vegetables.
440
For example, num_unit_1=2 and num_unit_9=1 means that [2 *0.0667] hectares of cucumber are
441
planted, and cabbage is planted in [0.0667*hectares]. Price [i] represents the price of each vegetable.
442
The “rec” years represents recovery/breakeven years of the recycling cost can be expressed as the
443
total cost divided by the annual profit (Formula 2).
444
445
_
=
∑( _ × _ _ × _ ) _
446
447
The parameters of the random variables representing the output value of each of nine kinds of
448
vegetables per 0.0667 hectares are calculated. The average value is therefore mentioned per-mu per
449
year and the standard deviation parameter is set to 1/10th of the annual yield per 0.0667 hectares.
450
First, (cucumber, tomato, potato, cabbage, and five kinds of vegetables) are planted on 2*0.0667
451
hectares and the rest are not planted. They can be expressed as in (Formula 3):
452
453
⎩
⎪
⎨
⎪
⎧
_1~ (30000, 3000 )
ℎ
_2~ (40000, 4000 )
_5~ (11000, 1100 )
_7~ (10000, 1000 )
ℎ
_8~ (15000, 1500 )
(Formula 3)
454
455
According to the Distribution Law of the normal distribution of random variables, if the building
456
has only one floor, then regardless of how the annual operating costs change, the average years of
457
recycling costs is 11.5 years. The substitution calculation can get the 68.3 percent confidence to recover
458
the cost between 10.5-12.9 years, there is 95.4 percent confidence to recover the cost between 9.6 and
459
14.5 years. If the climate is suitable and technical management is good, the cost may be recovered in
460
10 years. And if the technical management and climate situation are poor, the cost will also be
461
recovered in 15 years. If the average value and fluctuation range of production are changed in the
462
actual situation, the value of the parameters in the model can be adjusted and recalculated.
463
After recovering the cost, we can choose to grow (2 *0.0667) hectares of cucumbers, tomatoes,
464
potatoes, bokchoy, and cabbage steadily each year. The average income is about 947,000 RMB
465
($148000). There is 68.3 percent certainty that the annual income is between 825,000 and 1,041,000
466
RMB ($129,000-$163,000). There is 95.4 percent certainty that the income will range between 757,000
467
and 1136,000 RMB ($118,000-$177,500) per year.
468
We can also select cucumbers, tomatoes, peppers, carrots, potatoes, Chinese cabbage, Chinese
469
cabbage, cabbage, and cabbage. Each of the nine high-yield and high-demand vegetables grows
470
0.0667 hectares for each variety, and the remaining land can be allocated on its own, which can
471
achieve an average annual stable profit of 592,000 RMB ($92,500). Even if the remaining land is not
472
cultivated, there is 68.3 percent certainty that makes an annual income of 533,000-651,000 RMB
473
($83,000-$102,000), with 95.4 percent of the determination to make annual income about
474,000-474
710,000 RMB ($74,000-$110,000).
475
Additionally, If the building has three floors then regardless of how the annual operating costs
476
change, the average years of recycling costs would be 9 years, the substitution calculation can get 68.3
477
percent certainty to recover the cost between 8.2-10 years, there is a 95.4 percent certainty to recover
478
the cost between 7.5 and 11.3 years. And the annual income of planting vegetables is three times that
479
of the original strategy where the building has only one floor. If the building has ten floors, then we
480
can assume the cost of the whole building is about 120 million RMB ( $18.75 million). Then the whole
481
building can provide more than (10*10*0.0667) hectares of planting space. The building can plant all
482
kinds of vegetation to meet the demand of the university. The calculation method is the same as
483
above.
484
4. Discussion
485
Universities have multiple sources of income through research, industry involvement, investment,
486
government grants and others. This is one of the major reasons of why universities can implement
487
new technologies such as vertical farming for their students and staff. The increasing population will
488
also increase the demand-supply chain of food systems. This can be managed by installing vertical
489
farming.
490
Introducing vertical farms in university campuses will not only save money and resources but also
491
facilitate multiple streams of income. Research labs can be established in these farm buildings where
492
people from national and international institutions can be brought in for new innovations and
493
technologies. These farms will able to supply specific foods according to specific seasons.
494
Additionally, universities can monitor the production and usage in real time and make decisions
495
could benefit the society. This will start an incredible chain of advanced research and development
496
in the field of sustainability, science, social science, business, materials, agriculture, mathematics and
497
other interdisciplinary domains. The universities can set an example of taking bold initiative which
498
would bring them fame and they can attract resources. In the educational industry, profits may not
499
be focused on short-term gains rather than pushing boundaries for students and faculty with having
500
financially benefited in the long term.
501
Construction of vertical farming can save labour, packaging, logistics costs. Logistics have direct and
502
indirect impacts on the environment. The use of plastic sheets, styrofoam and others are
non-503
biodegradable. Also using fossil fuels in vehicles have a direct impact on the air pollution and
504
depletion of natural resources. The produce from vertical farming is free from any harmful chemicals
505
and is more healthy than traditional farming. Furthermore, this system produces the least waste
506
which is highly beneficial. The vertical farming building can serve as a teaching space for the students
507
all over the world and can inspire other institutions in getting involved in advanced urban
508
agriculture. For the general production of plants, the students can be considered as a key element.
509
Training and part/ full-time employment can motivate them to get involved in the process. This will
510
enable to create a strong sense of community belongingness. Whenever there is an excess production,
511
the vegetation can be donated or sold at a reasonable price to people outside of the university. The
512
building can be built through best sustainable practices and the operational energy can be harnessed
513
from renewable sources such as solar, wind and hydropower. Finally, there can be multiple
514
opportunities for bringing in financial resources from research labs, innovations in technology,
515
governmental capitalizations and others.
516
517
5. Conclusions
518
The concept of introducing vertical farming can be a strong tool used in the built environment for
519
fighting climate change and global warming. As per the study conducted on various scenarios, a
520
vertical farm can break even economically in 10-20 years and could alleviate the stress on the
521
environment. Additionally, the stress on fertile land all over the world can be reduced to great extent
522
throughout the countries which makes it difficult to recognize its true value. Furthermore, enterprises
524
who have initiated vertical farming have not been completely transparent which results in less
525
awareness among industries, and the application on a large scale is not evident.
The quality of all
526
aspects of technologies in vertical farms are also important because it relates to the ability of
527
these to achieve sustainable development and achieve cost recovery and profitability.
528
However, in the vertical farm environment, the yield and fluctuation of crops are still unclear,
529
and further practical experiments and conclusions are needed.
For using vertical farming on a530
pragmatic undertaking, there should more research focused on industrial scale, location-based
531
climate analysis, financial models scoring lower breakeven time and higher profit margins. There can
532
be federal and state incentives to push this idea among the citizens. We believe that vertical farming
533
and sustainable urban agriculture has tremendous potential in recovering from social and planetary
534
issues.
535
536
Conflicts of Interest: “The authors declare no conflict of interest."
537
538
References
539
1. FAO.; IFAD.; UNICEF.; WFP and WHO. The State of Food Security and Nutrition in the World 2017.
Building resilience for peace and food security. Rome, FAO. 2017; pp.2-199; 978-92-5-109888-2 [CrossRef]
2. Alexander, P.; Brown, C.; Arneth, A.; Finnigan, J.; Moran, D.; Rounsevell, M. D. Losses, inefficiencies and
waste in the global food system. Agricultural systems, 2017, 153, 190-200. [CrossRef]
3. Vertical farm-The Problem, Dickson Despommier, 2017 Available online: http://www.verticalfarm.com/
(accessed on 22 April 2018).
4. Vertical Farming: The Future of Agriculture? Josh Hamilton, 2016 Available online: https://www.honeycolony.com/article/vertical-farming/ (accessed on 20 Nov 2017). 5. Fischetti, M. Growing vertical. Scientific American,2008, 18(S3), 74-79. [CrossRef]
6. Mancebo, F. Urban Agriculture for Urban Regeneration in the Sustainable City. In Quality of Life in Urban
Landscapes. Springer, Cham. 2018, 311-317 [CrossRef]
7. Fred H. Besthorn. Vertical farming: social work and sustainable urban agriculture in an age of global food
crises. Australian Social Work. 2013, 66(2), 187-203. [CrossRef]
8. Banerjee, C.; Adenaeuer, L. Up, up and away! the economics of vertical farming. Journal of Agricultural
Studies. 2014, 2(1), 40-60. [CrossRef]
9. Despommier, Dickson. “The RISE of VERTICAL FARMS.” Scientific American, vol. 301, no. 5, 2009, 80–87.
[CrossRef]
10. Thomaier, S.; Specht, K.; Henckel, D.; Dierich, A.; Siebert, R.; Freisinger, U. B.; Sawicka, M. Farming in and on urban buildings: Present practice and specific novelties of Zero-Acreage Farming
(ZFarming). Renewable Agriculture and Food Systems. 2015 30,1, 43-54. [CrossRef]
11. World Population Prospects: The 2017 Revision. United Nations, Department of Social Affairs. Key Findings
and Advance Tables. Working Paper No. ESA/P/WP/248. 2017, 7 Available online:
https://www.compassion.com/multimedia/world-population-prospects.pdf (accessed on 20 Aug 2017).
12. Cities and their rural surroundings. The urban- rural interface. UN-Water Decade Program on Advocacy
http://www.un.org/waterforlifedecade/swm_cities_zaragoza_2010/pdf/04_cities_and_rural_surrondings.
pdf (accessed on 20 Aug 2017).
13. United Nations Convention to Combat Desertification (UNCCD). UN Convention to Combat Desertification. Land matters for climate. Reducing the gap and approaching the target. 24 pp. 2015. Available Online:
http://www.unccd.int/Lists/SiteDocumentLibrary/Publications/2015Nov_Land_matters_For_Climate_EN G.pdf (accessed on 20 Nov 2017).
14. Costanza, R.; de Groot, R.; Sutton, P.; Van der Ploeg, S.; Anderson, S.J.; Kubiszewski, I.; Farber, S.; Turner,
R.K. Changes in the global value of ecosystem services. Global environmental change, 2014, 26, 152-158.
[CrossRef]
15. Nkonya, E.; Gerber, N.; Von Braun, J.; De Pinto, A. Economics of land degradation: The costs of action
versus inaction, IFPRI issue brief no. 68. 2011,9 [CrossRef]
16. United Nations Convention to Combat Desertification 2014 (UNCCD). The Land in Numbers
Livelihoods at a Tipping Point. UN Campus, Platz der VereintenNationen 1, 53113 Bonn, Germany. 2014
Available Online:
http://www.unccd.int/Lists/SiteDocumentLibrary/Publications/Land_In_Numbers_web.pdf (accessed on 20 Aug 2017).
17. Country economy, China population, 2017. Available online:
https://countryeconomy.com/demography/population/china (accessed on 22 Aug 2017).
18. Hooke, R.; L., Martín; Duque, J. F; Pedraza, J.; Land transformation by humans: a review. GSA today 2012, 22(12), 4-10. DOI: 10.1130/GSAT151A.1 [ CrossRef]
19. World Hunger Rise. How close are we to #ZeroHunger? Available online: http://www.fao.org/hunger/en (accessed on 8 March 2018)
20. The state of food security and nutrition in the world 2017. Available online:
http://www.who.int/nutrition/publications/foodsecurity/state-food-security-nutrition-2017/en/
(accessed on 20 April 2017).
21 . United Nations, Department of Economic and Social Affairs, Population Division (UNPD) World
Population Prospects: The 2008 Revision, Highlights, Working Paper No. ESA/P/WP.210.2009. Available
online: http://www.un.org/esa/population/publications/wpp2008/wpp2008_highlights.pdf (accessed on 8
April 2018)
22. Mora, C.; Tittensor, D. P.; Adl, S.; Simpson, A. G.; Worm, B.; How many species are there on Earth and in
the ocean?. PLoS biology 2011, 9(8), e1001127. [CrossRef]
23. Schmidhuber, J.;Tubiello, F. N; Global food security under climate change. Proceedings of the National
Academy of Sciences 2007, 104(50), 19703-19708 [CrossRef]
24. Sustainable land management contribution to successful land-based climate change adaptation and
mitigation. Available online:
https://www.unccd.int/sites/default/files/documents/2017-09/UNCCD_Report_SLM.pdf (accessed on 20 January 2018).
25. Land matters for climate. Reducing the gap and approaching the target. Available online:
https://www.unccd.int/sites/default/files/documents/2015Nov_Land_matters_For_Climate_ENG_0.pdf
(accessed on 22 April 2017)
26. An, R.; Ji, M.; Zhang, S. Global warming and obesity: a systematic review. Obesity Reviews 2018, 19(2),
150-163. [CrossRef]
27. World Energy Outlook 2015 - Executive Summary - English Version. Available online:
https://www.iea.org/Textbase/npsum/WEO2015SUM.pdf (accessed on 28 January 2018)
28. Connor, R., 2015. The United Nations world water development report 2015: Water for a sustainable world
29. Morris, S and Holstead, K.L. Review of the economics of sustainable land management measures in
drinking water catchments 2013. CREW report CD2012/34 Available online: crew.ac.uk/publications.
(accessed on 17 January 2018)
30. Bin Kaichun. The vegetable distribution mode for college canteen in China. China Market. 2011 10.
105-106. [CrossRef]
31. Xiuzhen, Zhang.; Hong, Tan.; Yuanfeng, Wu., Weichun, Li.; A joint distribution system for agriculture products of Colloge canteen in China.E-Business Journal. 2013, 12. 95-96 :[CrossRef]
32. Higgins KW, inventor. Aquatree Global, Llc, assignee. Aquaponics system. United States patent application
US 14/254,446. 2015 Oct 22. [CrossRef]
33. Santos, J. D. D.; Silva, A. L. L. D.; Costa, J. D. L.; Scheidt, G. N.; Novak, A. C.; Sydney, E. B.; Soccol, C.R.
Development of a vinasse nutritive solution for hydroponics. Journal of environmental management. 2013,
114, pp.8-12. [CrossRef]
34. Savvas, D. Hydroponics: A modern technology supporting the application of integrated crop management
in greenhouse. Journal of Food Agriculture and Environment. 2003,1, 80-86. [CrossRef]
35 . R, Ziegler. The vertical aeroponic growing system. Patent Pending. Synergy International Inc. 2015.
[CrossRef]
36. Methodologies. Botanicare. Available online:
https://www.botanicare.com/hydro_101/nft-nutrient-film-technique/(accessed on 6 February 2018).
37 Walsh, B. America’s food crisis and how to fix it. 2009, Available Online:
http://www.time.com/time/health/article/0,8599,1917458,00.html. (accessed on 8 Nov 2017)
38. Macias, T.. Working toward a just, equitable, and local food system: The social impact of
Community-Based agriculture. Social science quarterly, 2008, 89(5), 1086-1101. [CrossRef]
39. Polack, R.; Wood, S.; Bradley, E. Fossil fuels and food security: Analysis and recommendations for
community organizers. Journal of Community Practice, 2008,16(3), 359-375. [CrossRef]
40. Despommier, D. The vertical farm essay 1: Reducing the impact of agriculture on ecosystem function and
services. 2007. Available online: http://www.verticalfarm.com/more?eassy1 (accessed on 23 Aug 2017).
41 . Hwang, J. Vertical farming in Las Vegas? Beyond pragmatism toward desire. In M. White &M.
Przybylski (Eds.), On farming: Bracket 1. New York: Actar Publishing. 2010, 180-187
42. Dixon, J.; Omwega, A.M.; Friel, S.; Burns, C.; Donati, K.; Carlisle, R.The health equity dimensions of
urban food systems. Journal of Urban Health, 2007, 84(1), pp.118-129. [CrossRef]
43 . Larsen, K.; Gilliland, J. A farmers’ market in a food desert: Evaluating impacts on the price and
availability of healthy food. Health & Place, 2009. 15(4), 1158-1162. [CrossRef]
44 Max, A. Future farm: sunless, rainless, indoors.2011,4 Available online:
https://www.smh.com.au/technology/future-farm-a-sunless-rainless-room-indoors-20110411-1db87.html (accessed on 25 Aug 2017).
45 . Plant paradise emancipation of the plant. Available online: https://www.plantlab.nl/plant-paradise/
(accessed on 4 April 2017).
46. Andrews,K; Pasona Urban farm by Kono Designs. Available online:
https://www.dezeen.com/2013/09/12/pasona-urban-farm-by-kono-designs/ (accessed on 7 April 2017).
47 . Banerjee, C.; Adenaeuer, L. (2014). Up, up and away! The economics of vertical farming. Journal of
48. SPREAD to Construct World's First Fully Automated, Large-scale Vegetable Factory.2015. Available
online:
https://www.prnewswire.com/news-releases/spread-to-construct-worlds-first-fully-automated-large-scale-vegetable-factory-300122974.html (accessed on 9 April 2017).
49. Kozai, T. Resource use efficiency of closed plant production system with artificial light: Concept,
estimation and application to plant factory. Proceedings of the Japan Academy, 2013 Series B, 89(10),
447-461. [CrossRef]
50. Japan’s Largest Plant Factory Producing 10,000 Vegetables Daily Starts Full-Scale Operation at
Kashiwa-no-ha Smart City Plant Factory.2014. Available online:
http://www.mitsuifudosan.co.jp/english/corporate/news/2014/0605_01/index.html (accessed on 9 April
2017).
51. About SkyGreens. Available online: https://www.skygreens.com/about-skygreens/ (accessed on 10 April
2017).
52. Population of China (2018 and historical). Available online:
http://www.worldometers.info/world-population/china-population/ (accessed on 15 April 2017).
53. National Bureau of Statistics of China, 2014. yearbook 2014. China Statistics Press, Beijing 2014.
Available online: www.stats.gov.cn/tjsj/ndsj/2014/indexeh.htm (accessed on 17 April 2017)
54. World Population Prospects. United nations2017 Available online:
https://esa.un.org/unpd/wpp/Download/Standard/Population/ (accessed on 18 April 2018)
55. Long, H.; Liu, Y.; Wu, X.; Dong, G. Spatio-temporal dynamic patterns of farmland and rural settlements in
Su–Xi–Chang region: Implications for building a new countryside in coastal China. Land Use Policy
2009, 26(2), 322-333. [CrossRef]
56. Li, Y.; Chen, C.; Wang, Y.; Liu, Y. Urban-rural transformation and farmland conversion in China: The
application of the environmental Kuznets Curve. Journal of rural studies. 2014. 36, 311-317. [CrossRef]
57. Ministry of Land and Resource of China (MLR) 2011.The publication of land use change survey data of
China in 2011. Available online: http://www.mlr.gov.cn/mlrenglish/communique/ (accessed on 19 April
2017).
58. Xishou Yu.; Yueping Liu. Status quo of China plant factory industry development and its future
prospect. Agricultural Outlook. In Chinese. 2014,7, 1673-3908,58-61.[CrossRef]
59. Liu, S., & Teng, P. High-Tech Plant Factories: Challenges and Way Forward. Policy Brief, S. Rajaratnam
School of International Studies, 2017 Nanyang Technological University Singapore. [CrossRef]
60. Xishou Yu.; Yueping Liu. Status quo of China plant factory industry development and its future
prospect. Agricultural Outlook. In Chinese. 2014,7, 1673-3908,58-61. [CrossRef]
61. Chen Yuming. Prospect and strategies of the development of vertical farm in Chinese cities. Modern
Business Trade Industry. In Chinese. 2013, 23(20):96 1672-3198. [CrossRef]
62. Qichang, Y. Developmental strategy of plant factory. Science & Technology Review. 2014, 32(10), 20-24.
[CrossRef]
63. Number of universities in China between 2006 and 2016. Available online:
https://www.statista.com/statistics/226982/number-of-universities-in-china/ (accessed on 21 May 2017)
64. Hinrichs, Peter. Trends in Employment at US Colleges and Universities, 1987–2013. 2106. Available
online:
https://www.clevelandfed.org/newsroom-and-events/publications/economic-commentary/2016-economic-commentaries/ec-201605-trends-in-employment-at-us-colleges-and-universities.aspx
65. Economic benefit analysis of rice scale cultivation 2012,4. Available online:
http://www.nczfj.com/liangshizhongzhi/20106214.html (accessed on 25 May 2017)
66. He Xiurong. The thinking about scale of agricultural operation in China. Issues in Agricultural Economy
2016, 9. 37(09), 4-15. [CrossRef]
67. The university information profile, Huazhong University of Science and Technology. Available online: http://www.hust.edu.cn/755/list.htm (accessed on 28 January 2018)
List of Figures:
Figure 1: - Global land ocean temperature index, NASA; Available online (CrossRef )
Figure 2: Greenhouse gas emissions for major economies, Center for Climate and Energy Solutions; available online [CrossRef]
Figure 3: Energy consumption pattern across industries and their sources, EIA; available online [CrossRef ] Figure 4: Agricultural producer to consumer logistic cycle, prepared by author [30,31]
Figure 5: Pictorial representation of an Aeroponics system, prepared by author Figure 6: Existing vertical farms,
List of Tables:
Table 1: Existing vertical farms Despommier, D. (2013). Farming up the city: the rise of urban vertical farms. Trends in Biotechnology,31(7), 388-9.
Table 2: Average agricultural demand in China in 2012
,
Zhenya, Zhou.; Mingjie, Gao.; Wuanxin, Li.; Qing, Zhang.; Qiyou Luo. Estimation of the primary products demand in China based on the balanced diet. Chinese journal of agricultural resources and regional planning. 2015 9. 85-90.[CrossRef]
Appendix A
The vegetable and fruit consumption by HUST (Huazhong University of Science and Technology) in 2016 as per the data collected is shown in the following tables.
Vegetables Amount(kg) Price in USD(RMB 6.45:1)
Sea mushroom 6.2 11.05
Mushroom(capped) 3583 8474.57
Mushroom 11611.45 32763.87
Mongolia mushroom 166.5 331.32
Babysbreath 25 48.06
Nostoc commune 346.2 1011.91
Straight cucumber 83195.45 51366.13
Bitter gourd 21099.9 14339.96
Wax gourd 60530.9 25939.09
Pumpkin 31886.6 16043.10
Horredcucumbern 31780.1 20914.94
Tomato 156396.1 107086.70
Cherry tomato 33856.6 15101.83
Opo squash 11521.5 7025.43
Eggplant 57386 34925.47
Eggplant king 34979.5 40608.17
Pimenton 127100.05 95853.45
Cayenne pepper 26811.85 33270.69
Wuhu pepper 16064 15812.03
Hangzhou-pepper 15437.95 15458.42
Green bean 68904.2 82643.19
Fresh corn 18540.6 33702.60
Fresh lotus root 11073.1 17297.94
Net onion 28949 23002.34
Cutted lettuce 19264.9 15381.63
Head of lettuce 29397.5 39637.13
Chinese cabbage 105107.7 56670.61
Pakchoi 86014.5 54379.11
Cabbage plants 85700.4 67020.45
Cabbage sprouts 44027 21018.60
Red Brassica campestris 11023 17477.43
Cabbage 157831 78485.54
Rain-water food 11264.7 7121.88
Romaine 16230.45 21568.87
Lactuca sativa 19153.45 16276.58
Spinaciaoleracea 18078.5 21057.89
Caraway 8265.1 13830.48
Cauliflower 36706.85 37887.78