*
Recent ECRH/ECCD experiments aiming for higher density and
temperature operations in the LHD
Hiroe Igami1*, Shin Kubo1,2, Takashi Shimozuma1, Yasuo Yoshimura1, Toru Ii Tsujimura1,3, Sakuji Kobayashi1, Yoshinori Mizuno1Hidenori Takubo1, Kenji Tanaka1, Masayuki Yokoyama1,3, Ryosuke Seki1, Ichihiro Yamada1, Ryo Yasuhara1, Hayato Tsuchiya1, Katsumi Ida1,3, Mikiro Yoshinuma1,3, Tatsuya Kobayashi1,3, Satoshi Ohdachi1,3, Masaki Osakabe1,3, Tomohiro Morisaki1,3 and the LHD Experiment Group
1National Institute for Fusion Science, National Institutes of Natural Sciences, Toki 509-5292, Japan 2Nagoya University, Nagoya 464-8603, Japan
3SOKENDAI (Graduate University for Advanced Studies), Toki 509-5292, Japan
Abstract. In LHD, real-time control of the incident EC wave polarization and quick response microwave bolometer for monitoring the stray radiations have been developed for efficient and safe operation of the high power and long pulse ECRH/ECCD. As a high power ECRH/ECCD application aiming for high density, ECRH has been demonstrated up to 85% of the cutoff density by the fundamental X-mode excitation in HFS with use of a horizontal port antenna located in LFS. As another application aiming for high temperature, the effect of the control of the rotational transform with use of the ECCD on the sustainment of the e-ITB is investigated. It has been suggested that higher local electron energy confinement time is obtained inside the e-ITB with placing the m/n = 2/1 magnetic island near the edge of the e-ITB compared to the case when the 2/1 island is vanished in the plasma.
1 Introduction
The electron cyclotron resonance heating (ECRH) and current drive (ECCD) have various important roles in fusion oriented magnetically confined plasmas. Development of the gyrotrons aiming for high power and long pulse operation has expanded the possibility of applications of the ECRH/ECCD. With increasing of the available gyrotron power, to reduce the heat load caused by non-absorbed stray radiation by improvement of the heating efficiency with monitoring the stray radiation has become more important from the viewpoint of safety. Moreover, to save the required total power oscillated by gyrotrons contributes to save the money to build and run the plasma devices including future fusion reactors. In addition to the improvement of the transmission efficiency, the improvement of the heating efficiency is also important.
In the Large Helical Device (LHD), the operation region toward both higher temperature and higher density has been expanded with increasing the available heating power, optimizations of the operation conditions, and progress in studying the underlying physics [1]. After the start of the deuterium operation, the highest record of the ion temperature, Ti = 10 keV with the formation of the ion
internal transport barrier (i-ITB), was achieved through several optimizations of the operation conditions, for example, wall condition, magnetic configuration, and timing of the impurity pellet injection [2]. As one of the optimizations of the operation conditions, the ECRH
discharge cleaning with Helium gas puffing contributed to form the peaked density profile that is preferable for realizing high ion temperature by reducing the wall recycling. Through the experiments, the isotope effect on the confinement characteristics has been indicated in both the i-ITB plasmas [2] and the electron internal transport barrier (e-ITB) plasmas [3]. When the highest Ti = 10 keV
was obtained with formation of the i-ITB, the electron temperature Te was only 3.5 keV. Since both Ti and Te are
high in the fusion reactor, studies on the confinement and the transport characteristics of ions and electrons in such a plasma are important. In LHD, Ti ~ 6 keV and Te ~ 8
keV were already achieved simultaneously with simultaneous formations of the i-ITB and the e-ITB with neutral beam injection (NBI) of 26 MW and the centralized ECRH of 5.1 MW [4]. To expand the operation region of the simultaneous pursuit of high Ti
and Te, we must have a better understanding of the role of
ECRH/ECCD on the formation and the sustainment of the internal transport barriers (ITB)s.
regime is desired because it is considered difficult to produce a high power and long pulse gyrotron of the second harmonic frequency ( > 300 GHz) at this time.
In this paper, the experimental apparatuses are explained first in section 2. In section 3, recent progress of control and measurement systems developed for efficient and safe operation of the ECRH are introduced. In section 4, applications of the ECRH/ECCD aiming for high density and high temperature operations are reported. The summary is in section 5.
2 Experimental Apparatuses
2.1 The Large Helical Device (LHD)
LHD is the second largest superconducting helical device with poloidal/toroidal period numbers of 2/10. The plasma major radius is 3.42-4.1 m and the average minor radius is approximately 0.6 m [6]. The magnetic field strength at the magnetic axis Rax = 3.6 m can be raised up
to 2.85 T by super-cooling of the helical coils. Three negative ion-based neutral beams (NBs) of 180 keV with total heating power of ~16 MW (hydrogen) / ~20 MW (deuterium) are injected tangentially to the magnetic axis to generate and heat the plasma. Two positive ion-based neutral beams of 60 keV and 80 keV with total heating power of ~12 MW (hydrogen) / ~20 MW (deuterium) are also injected perpendicularly to the magnetic axis. The electron cyclotron resonance heating (ECRH) with the total heating power of 5.4MW is also used to generate and heat the plasma. Further information about the ECRH system is described below.
2.2 Present ECRH system
The present ECRH system consists of one 82.7 GHz (0.45 MW/ 2 s, GYCOM) diode gyrotron, three 77 GHz (1-1.5 MW/2 s, 0.3 MW/CW, TETD) triode CPD gyrotrons, two 154 GHz triode CPD gyrotrons (1 MW/2 s, 0.5 MW/CW, TETD), six evacuated transmission lines using corrugated waveguides of 88.9 mm diameter, and six quasi optical mirror antennas. Two of the antennas are installed in a top port named 5.5-U and the other four antennas are installed in a horizontal port named 2-O. As mentioned above, the maximum simultaneous input power is 5.4 MW for short pulse (< 2 seconds) operations. During the last experimental campaign, two of the gyrotrons failed. One gyrtron failed because of the water leakage from a piping joint at the exit of the gyrotoron cavity in the oil tank. However, this gyrotron is already ready for operation after the component replacement. Another one gyrotron failed because its relief window broke. This gyrotron will be operated in the next experimental campaign after repair in the factory.
3
Development
of
control
and
measurement systems for efficient and
safe operation of the ECRH
3.1 Real time control of the EC wave polarization
In the peripheral region of the LHD plasma, the ratio of the O mode and the X mode of the EC wave significantly changes during the propagation because of the existence of the strong magnetic shear and the electron density that is widely distributed even outside of the last closed flux surface (LCFS). For efficient ECRH, optimization of the polarization of the launched EC wave with taking into account this effect is necessary to excite pure O/X mode at the electron cyclotron resonance (ECR) layer. In the transmission line of the 77 GHz wave launched from one of the top port antennas, the real-time polarization control under real-time acquisition of the density profile is performed with real-time field programmable gate array (FPGA) processing with using CompactRIO (cRIO) [cRIO-9035] and its input/output modules made by National Instruments and its software through LabView FPGA programming. This optimization method and experimental results are reported precisely in Ref. [7]. The deviation of the rotation angle of each l/4 and l/8 elliptically polarizer from the optimum angle can be corrected with the time rate of change of the polarization rotator at about 40∘/sec.
3.2 Stray radiation measurement with use of a quick response microwave bolometer
In LHD, sniffer probes were used for the stray radiation measurement [8]. However, they were removed before the start of deuterium operation because the neutrons generated as fusion products in the deuterium operation degrade the sensitivity of the microwave detectors made from semiconductors. The microwave bolometer [9] has been used to estimate the accumulated energy of the stray radiation [10]. Different from the sniffer probe, the existing microwave bolometers which consist of a microwave absorber and a thermocouple cannot respond to the fast change of the stray radiation intensity. To estimate the stray radiation intensity in several ten milliseconds we have developed a quick response microwave bolometer as an alternative to the sniffer probes.
3.1.1 Design of a quick response microwave bolometer
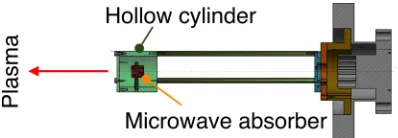
The microwave absorber of our quick response microwave bolometer consists of Al2O3-TiO2(87%/13%)
coated copper cylinder whose diameter and height are 10 mm. The copper cylinder is divided into two blocks to
squeeze the super-fine sheathed thermocouple whose diameter is 0.25 mm tightly with screws. As shown in Fig. 1, this copper cylinder is mounted in a hollow cylinder made from aluminium alloy with three-point support by set screws to avoid the metallization and to shade the radiations directly come from the plasma. The output of the sheathed thermocouple is transmitted via vacuum feedthroughs mounted on an ICF 114 flange and a compensating lead wired to a fast thermocouple signal convertor [MS3701, MTT Corporation].
3.1.2 Experimental results
For the first step, a quick response microwave bolometer was installed in a horizontal port where four of the ECRH antennas are installed. Fig.2 shows discharge waveforms when the ECRH of 2.5 MW in total was performed from 3.30 s to 5.30 s. The plasma was initiated just after the simultaneous start of neutral beam injection (NBI) and ECRH with fast increases of the electron temperature and density. The temperature of the microwave bolometer increases within 15 ms after the start of ECRH and does not increase any more after the stop of ECRH although the plasma radiation remains the same level. Therefore, this system has almost no sensitivity of plasma radiations. The averaged increasing rate of the temperature dT/dt during the ECRH is 3.11 Celsius degrees/sec. Since dT/dt =1.43 degrees/sec. for the power flux of 10 kW/m2 is expected with assuming that the absorption rate is 0.82 and the emissivity is 0.4 at the surface, the local power flux at the bolometer is estimated to be 22 kW/m2. The local power flux per unit power is 8.8 kW/m2/MW. The total ECRH efficiency estimated by the ray-tracing code “LHDGauss” [11] with using post-processing three-dimensional (3D) equilibrium mapping obtained from experiments is about 90% without the start-up phase of the plasma.
For the case of 10 ms 154 GHz, 0.8 MW EC wave launching to the plasma where no ECR layer exists the
microwave bolometer could respond even within 5 ms with dT/dt =10 degrees/sec. The estimated power flux per unit power is 87 kW/m2/MW, which is approximately ten times larger than the above case of 90 % ECRH efficiency. Although it has been pointed out that the stray radiation intensity measured close to the ECRH antenna does not directly reflect the ECRH efficiency because the stray radiation is not isotropic, these experimental results may suggest the order of the stray radiation. Although the microwave bolometer can respond within 15 ms, irregular voltage fluctuations come into the signal line of this system frequently. Considering the typical time width of the voltage fluctuation, the increase of temperature caused by the strong stray radiation larger than 28 kW/m2, or the stray radiation accumulated for more than 50 ms can be discriminated from the voltage fluctuation.
4 ECRH experiments to aim high density
and temperature operations
4.1 ECRH by the fundamental X-mode and/or the EBW excited by direct oblique launching from the LFS
4.1.1 Launching method to realize fundamental X-mode propagation at the HFS of the ECR layer
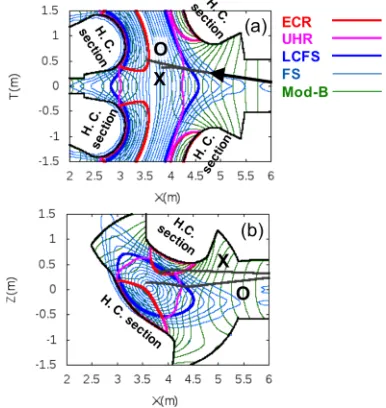
For usual ECCD in LHD, the fundamental ordinary (O) mode is launched obliquely to the external magnetic field from the horizontal port antenna to access the ECR layer from the low magnetic field side (LFS) as shown in Fig. 3. While a ray tracing calculation with taking into account the density profile even outside the last closed flux surface (LCFS) (see Fig.4) suggests that the
Fig.2 : Time changes of (a) averaged central electron temperature, (b) line averaged electron density, (c) total input power of ECRH and total input power of NBs, (d) radiation power from the plasma, and (e) temperature of the microwave bolometer, raw (grey) and low-pass filtered (fcutoff=40Hz, red) output of the thermocouple
signal convertor.
extraordinary (X) mode launched from the same antenna can access the high field side (HFS) of the ECR layer with aiming for the upper space located slightly below the neighboring helical coil. This fast X (FX) mode propagates at HFS with a finite parallel refractive index (N//) that changes along the propagation because of the
inhomogeneity of the external magnetic field. If the FX mode passes the ECR layer with a finite N//, then strong
power absorption is expected. On the other hand, if N//
becomes close to zero, the power absorption rate is reduced. The non-absorbed power of the FX mode reaches the upper hybrid resonance (UHR) layer and excites the electron Bernstein wave (EBW) via the linear mode conversion process. ECRH by the EBW is expected in that case. In the parameter space of We/w > 1, where We
is the electron cyclotron angular frequency and w is the wave angular frequency, the FX-mode can propagate until the electron density reaches twice the plasma cutoff density in maximum. Therefore, ECRH from the under-dense to the over-under-dense regime is expected without changing of the launching direction.
4.1.2 Experimental results
In the experiment, we started to launch the 77 GHz EC wave in the manner shown in Fig. 3 in parallel with NB 2,3, (tangential) and 4 (perpendicular) just after the stop of NB 1 (tangential) and 5 (perpendicular) as shown in Fig. 5 (a), (b). The magnetic configuration was (Rax, Bt)
= (3.6 m, 2.75 T), where Rax is the position of the magnetic
axis, where the magnetic field strength is Bt. The electron
density is maintained at about 35% of the cutoff density. The right handed circularly polarization is selected as the incident wave polarization to couple with the X-mode. As shown in Fig.5 (b)-(d), the electron cyclotron emission (ECE) and the stored energy were modulated with following the 23 Hz/100 % ECRH power modulation. Fig. 6 shows the result of the FFT analysis of ECE signals of each channel with taking the differences from their time trends and normalizing by the time averaged values. It is suggested that the power absorption occurs in the peripheral region where the peak of the modulation amplitude (Fig.6-(a)) and the bottom of the phase delay
(Fig.6- (b)) are located. The ray-tracing calculation with using the equilibrium mapping data associated with the electron temperature and density profiles at 6.0 s in this discharge suggests that the power absorption of the fundamental X-mode occurs in the peripheral region (Fig. Fig.6 : (a) modulation amplitude normalized by the time average, (b) coherence function, and (c) phase delay are plotted versus the normalized minor radius for the 23 Hz component obtained by FFT analysis of each ECE channel from 6.0 s. to 7.0 s.
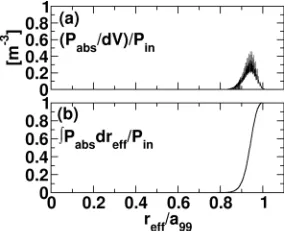
Fig.7 : Profiles of (a) local power absorption per unit volume and (b) integrated power absorption, plotted versus the normalized minor radius. These profiles are obtained by the ray tracing calculation with use of the fitted electron density profile shown in Fig. 4 Fig.5 : Time changes of (a) input powers of the NBs, (b) input power of the modulated ECRH, (c) difference of the ECE (measured at R=4.216 m) from the time trend between 5.5 and 7.3 s, (c) difference of the stored energy from the time trend between 5.5 and 7.3 s, and (e) line averaged electron density.
Fig. 4: The electron density profile obtained by Thomson scattering measurement (square) and its polynomial fitted profiles (solid line) plotted versus the effective minor radius “reff”. The dashed lines represent
the a99 surface inside which 99% of the electron kinetic
7). The absorbed power of the ECRH (Pabs) can be
estimated from the difference of the time derivative of the stored energy between before and after power input for the ECRH as follows.
𝑃"#$=&'&) )(
*+,)-./01
)*+,)-./01,∆) −&'(
&) )*+4∆)
)_67
(1)
In the above equation, Wp is the stored energy
obtained by the diamagnetic flux loop signal, t_on is the time when the modulated ECRH is turned on, and Dt (= 1 ms) is the time for linear fitting to calculate the time derivative dWp/dt. To take into account the response time
of the diamagnetic flux loop signal, dWp/dt is calculated
t_delay (= 5 ms) later from t_on. After taking the conditional average of Wp during the power modulation,
the ECRH efficiency Pabs /Pin= 70 % is obtained, where
Pin is the input power. However, the ray-tracing
calculation at the beam center indicates 100 % power absorption. There are some possible reasons for reducing the heating efficiency. One of the possibilities may be caused from the broadening of the launched beam. A fraction of the launched beam at the wall side may encounter the vacuum vessel wall and cannot penetrate into the plasma. Another fraction in the opposite side of the wall encounters the right handed cutoff (RC). Since the reflection occurs at the RC to some extent, the power fraction that couples with the FX mode at HFS is reduced. However, as it was pointed in the previous studies [12, 13], the rest fraction can transmit through the thin evanescent region between the RC and the UHR layer and couple with the FX mode. The ECRH efficiency obtained in this experiment is improved compared to the previous studies with use of the similar launching method with use of the bottom port antennas. The power fraction that can reach the HFS might be improved with use of the horizontal port antenna. In addition, the deviation of the incident wave polarization from the optimum polarization for exciting the pure X-mode might be also possible.
In another discharge, the electron density was ramped up during the ECRH as shown in Fig. 8-(e). The 77 GHz
EC wave was launched in the manner shown in Fig. 3 with 23 Hz/100 % power modulation. It was observed that the ECE and the stored energy were modulated with following the modulated ECRH until 7.17 s. when the line averaged electron density reaches 85 % of the cutoff density. Since the MHD instability appears and grows with the increase of the density in this magnetic field configuration of (Rax, Bt) = (3.6 m, 2.75 T), it is difficult
to increase the electron density more than the cutoff density of 77GHz. In Fig.9, similar to the case above, the peak of the normalized amplitude and the bottom of the phase delay are located in the peripheral region locally in the time range of 5.5-5.8 s. Meanwhile, it is suggested that the power absorption region spreads across a wide area in the time range of 6.8-7.1 s. because the bottom of the phase cannot be found clearly. To demonstrate the ECRH in the over-dense plasma with this launching method effectively, the magnetic axis outside 3.6 m should be selected to suppress the MHD instabilities and to place the ECR layer closer to the magnetic axis with increasing the magnetic field strength by super-cooling operation of the helical coils.
4.2 Control of the e-ITB performance with controlling the rotational transform by ECCD
The formation of the ITB is necessary to realize a high temperature core plasma in helical systems. It is known that the electron ITB (e-ITB) is formed when the applied power of the centralized ECRH is above the threshold value in helical systems. Although the threshold power tends to increase with the increase of the electron density of the target plasma, it has been pointed out that the threshold power can be different even for the similar density if the profile of the rotational transform, i/2p, is different [14, 15]. It has also been pointed out that the required ECRH power to sustain the similar central electron temperature in the e-ITB is different [15]. It is important to investigate what type of i/2p profile is better for sustaining the e-ITB inside which higher electron temperature and higher density is realized over a wider region with less power input. From this point of view the performance of the e-ITB is characterized by the local energy confinement time defined inside reff≤ 0.25 m and
Fig.9 : Profiles similar to Fig. 6 obtained by FFT analysis of each ECE channel from 5.5 s. to 5.8 s. (circles) and from 6.8 s. to 7.1 s. (squares).
Fig.8 : Plots similar to Fig. 5. The electron density was ramped up. Differences of the ECE and the stored energy from their time trends were taken between 5.5 s to 7.17 s. when NB2 stopped.
investigated for various i/2p profiles controlled by ECCD and neutral beam current drive (NBCD).
4.2.1 Control of i/2p by ECCD and NBCD
In the experiment where (Rax, Bt) =
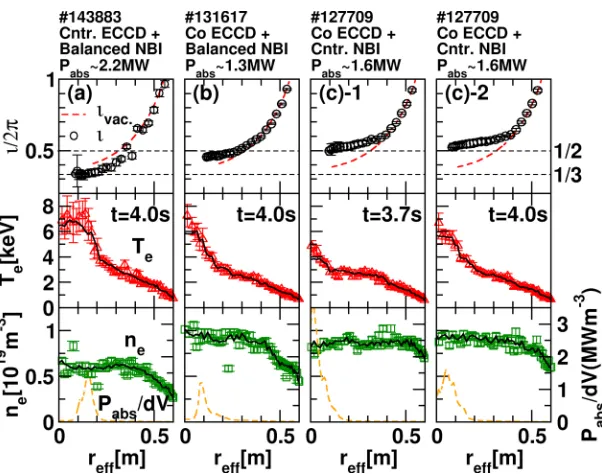
(3.6 m, 2.75 T), one of the tangential negative ion-based counter NBs was injected to measure i/2p profile experimentally by the motional Stark effect (MSE) spectroscopy [16,17]. The inductive current that compensates the toroidal current driven by this counter NBI increases i/2p in the core region. This inductive current can be cancelled by the opposite tangential negative co NBI of similar input power. We call this combination of co and counter tangential NBIs as the “balanced NBI” here. The co ECCD increase i/2p and the counter (cntr.) ECCD decrease i/2p in the core
region. With the counter ECCD superimposed on the balanced NBI, i/2p in the core decreased close to 1/3 (Fig.10 (a)). With the co ECCD superimposed on the balanced NBI, i/2p in the core increased near but at slightly lower than 1/2 (Fig.10 (b)). With the co ECCD superimposed on the counter NBI i/2p was changed from1/2 (Fig.10 (c)-1) to far beyond 1/2 (Fig.10 (c)-2) during a discharge.
4.2.2 Evaluation of the e-ITB performance with a partial-coverage energy confinement time in the core region
In the fusion reactor, higher temperature and density should be realized with less input power in wider region. In this paper, we would like to introduce the partial-coverage electron energy confinement time as a measure of inclusive e-ITB performance in the core region where reff≤ 0.25 m (te_reff ≤ 0.25m) as follows.
𝜏9_:.;;<=.?@A ≡ D ?𝑛9𝑇9
&G
&:.;; 𝑃"#$ 𝑑𝑟9JJ =.?@
= (2)
Pabsin eq. (2) is the sum of the ECRH and NBI powers
absorbed by electrons. The former is calculated by the “LHDGauss” and the latter is calculated by the “FIT3D” [18] codes. Both the “LHDGauss” and the “FIT3D” codes use the post-processing three-dimensional (3D) equilibrium mapping obtained from the experiment.
4.2.3 Co ECCD superimposed on the counter NBI
Fig. 11 shows the time change of te_reff ≤ 0.25m when the
co ECCD was superimposed on the counter NBI. Both
te_reff ≤ 0.25m and ECE signals shown in Fig.12 near the core
show sudden drops and quick recoveries before and after
Fig.11 : Time changes of (a) line averaged density, (b) the total absorption power in reff≤ 0.25 m, (c) i/2p in
the core region (averaged in 0.10 m ≤ reff≤ 0.20 m),
(d) te_reff ≤ 0.25m, and (e) magnetic shear near the edge
of the e-ITB (averaged in 0.25 m ≤ reff≤ 0.30 m). The
co ECCD was superimposed on the counter NBI.
Fig.12 : Low pass filtered (fcutoff=40Hz) ECE measured at
0.144 m ≤ reff≤ 0.25 m in the same discharge of Fig.11.
i/2p near the core crosses 1/2. At the bottom of the temperature drop (3.7 s), i/2p=1/2 is realized with gentle gradient (weak magnetic shear) at the core region and the flattening of the electron temperature around the e-ITB is observed as shown in Fig.10 (c)-1.It was reported that the stochastization can occur in the core region when the weak magnetic shear is realized near i/2p=1/2 and causes the flattening of the density and temperature profiles [19-22]. It was also reported that the required ECRH power to form and sustain the e-ITB is higher when the stochastic region exists in the core region of the target plasma [15]. In this experiment, it is suggested that the reduction of
te_reff ≤ 0.25m is caused by the partial stochastization around
the e-ITB. From 3.5 s to 4.0 s, harmonic magnetic fluctuations of ~2.5 kHz, ~5kHz, ~7.5 KHz, and 10 KHz are observed. On the contrary, after 4.0 s, only magnetic fluctuation of ~2.5 kHz remained. This indicates that the MHD instabilities which restrict the increase of the electron temperature are well suppressed after the quick recovery from the partial stochastization. Moreover, te_reff ≤ 0.25m increases slightly after the magnetic shear near the
edge of the e-ITB changes from positive to negative. Here, the magnetic shear is defined as di/ds ≡r/i(di/dr) and r ≡ reff/a99, where a99 is the flux surface inside which 99% of
the electron kinetic energy is included. It is speculated that the reduction of the magnetic shear near the edge of the e-ITB may affect the radial heat transport to some extent in this case as the previous studies (e.g., [23]) pointed out.
4.2.4 Counter ECCD superimposed on the balanced NBI
When the counter ECCD was superimposed on the balanced NBI, i/2p =1/3 was realized near the core with gentle gradient as shown in Fig 10-(a). i/2p remains to be
1/3 and te_reff ≤ 0.25m decreases as time passes. Wideband
magnetic fluctuations up to 6 kHz observed during the sustainment of the e-ITB suggest the existence of MHD instabilities which may restrict the increase of the electron temperature and resultant decrease of te_reff ≤ 0.25m.
Actually, rapid rises and drops of low pass filtered (< 40 Hz) ECE signals shown in Fig. 13 indicate the local collapse of the electron temperature profile in the core region. Note that these rises and drops of the low pass filtered ECE signals are observed independently from the perpendicular NBI (every 0.4 s from 3.6 s) for 20 ms superimposed for the ion temperature measurement by charge exchange spectroscopy (CXS).
4.2.5 Co ECCD superimposed on the balanced NBI
In the case of co ECCD superimposed on the balanced NBI, the highest te_reff ≤ 0.25m ~30 ms is obtained as shown
in Fig. 15. As shown in Fig. 10-(b) i/2p = 1/2 is located near the edge of the e-ITB at the early phase of the discharge. Then i/2p = 1/2 moves to the central region. It was reported that the existence of i/2p = 1/2 near the edge of the e-ITB can realize higher central electron temperature [14]. And it is pointed out that the strong shear of the radial electric field at the boundary of the magnetic island in the helical plasma can contribute to the reduction of transport through turbulence suppression by
E × Bshear [24]. This mechanism can explain that higher
te_reff ≤ 0.25m is obtained with the existence of i/2p = 1/2
near the edge of the e-ITB compared to the case when
i/2p = 1/2 is vanished by co ECCD superimposed on the
counter NBI, as described above. However, te_reff ≤ 0.25m
decreases and increases repeatedly as shown in Fig. 13. A sudden drop (4.2 s) and gradual decrease (4.7 s) with fluctuations are also observed in low pass filtered (< 40
Fig.15 : Plots similar to Fig. 13. The co ECCD was superimposed on the balanced NBI.
Fig.16 : Low pass filtered (fcutoff=40Hz) ECE measured at
0.02 m ≤ reff≤ 0.23 m in the same discharge of Fig.15.
Fig.13 : Plots similar to Fig. 11 without (e). The counter ECCD was superimposed on the balanced NBI.
Fig.14 : Low pass filtered (fcutoff=40Hz) ECE measured
Hz) ECE signals independently from the perpendicular NBI (every 0.4 s from 3.6 s) for 20 ms. Since several harmonic magnetic fluctuations are observed from 3.5 s to 4.5 s and wideband (10 kHz -17 kHz) fluctuations with frequency chirping down are observed from 4.5 s to 5.0 s, the existence of MHD instabilities that prohibit the increase of the electron temperature is indicated also in this case.
4.2.6 Discussion
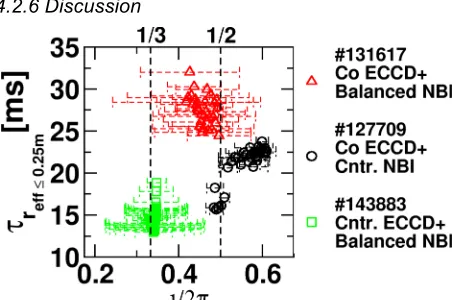
In Fig. 17, te_reff ≤ 0.25m obtained by the above three
types of current drive is plotted versus i/2p which is averaged near the core (0.1 m ≤ reff≤ 0.2 m). When i/2p
near the core is close to the 1/2 or 1/3 rational surface where the magnetic shear is weak, te_reff ≤ 0.25m decreases to
the lowest level although the e-ITB is formed in such cases as shown in Fig. 10. MHD instabilities which occur near the rational surfaces prohibit the increase of the electron temperature. To realize high electron temperature with high density, such i/2p profiles should be avoided.
When the Co ECCD is superimposed to the balanced NBI, the highest te_reff ≤ 0.25m is obtained. The improvement
of te_reff ≤ 0.25m by the existence of the m/n=2/1 magnetic
island near the edge of the e-ITB is clearly indicated compared to the case of the co ECCD superimposed to the counter NBI in which i/2p=1/2 is vanished in the plasma. However, te_reff ≤ 0.25m cannot be kept stable with the
existence of i/2p=1/2 which causes MHD instabilities. In contrast, te_reff ≤ 0.25m can be kept stable without MHD
instabilities by vanishing i/2p = 1/2 and increases slightly after the magnetic shear near the edge of the e-ITB decreases from the positive to negative. To validate the effect of the magnetic shear on the e-ITB performance, such an i/2p profile is favorable.
5 Summary
With the development of high power and long pulse gyrotron, application of the ECRH/ECCD has been expanded toward higher temperature and density. Improvement of the ECRH efficiency and reliable monitoring of the stray radiation has become more important from both economic and safety viewpoints. In
LHD, real-time controlling of the incident wave polarization has been successfully demonstrated and a quick response microwave bolometer developed as a substitute for the sniffer probe has been able to respond to the change of the stray radiation intensity within 20 ms. As an application aiming for high density operation, ECRH up to 85 % of the cutoff density has been demonstrated by X-mode excitation in HFS with use of an antenna located in LFS. As an application aiming for high temperature operation, the effect of the control of the rotational transform on the sustainment of the e-ITB has been investigated with ECCD for seconds. It has been clearly derived that the existence of the m/n=2/1 island improves the confinement inside e-ITB compared to the case when the m/n=2/1 island is vanished in the plasma.
This work has been supported by the NIFS LHD project under ULRR701, ULRR804, ULRR025, and JSPS KAKENHI Grant Number 18K03590.
References
1. Y. Takeiri et al., Nucl. Fusion57, 102023 (2017) 2. H. Takahashi et al., Nucl. Fusion58, 106028 (2018) 3. F. Warmer et al., Nucl. Fusion58, 106025 (2018) 4. H. Takahashi et al, Nucl. Fusion57, 086029 (2017) 5. O. Mitarai et al., Plasma Fusion Res.2 021 (2007) 6. O. Motojima et al., Physics of Plasmas6 1843 (1999) 7. T. Ii Tsujimura et al., Fusion Eng. Des. 131 130
(2018)
8. H. Igami et al., Rev. Sci.c Instrum.77 10E931 (2006) 9. M. Hirsh et. al., AIP Conference Proceedings1612,
39 (2014)
10. S. Marsen et al., Nucl. Fusion57, 086014 (2017) 11. T. Ii Tsujimura, et al., Nucl. Fusion 55, 123019
(2015)
12. H. Igami, et al., Nucl. Fusion49, 115005 (2009) 13. H. Igami, et al, Plasma Fusion Res.7 2402110 (2012) 14. T. Shimozuma et al., Nucl. Fusion45 1396 (2005) 15.
H. Igami, et al.,
EPJ Web of Conferences32, 02006(2012)
16. K. Ida, et al., Rev. Sci. Instrum.76 (2005) 05350 17. T. J. Dobbins et al., Rev. Sci. Instrum. 88, 093518
(2017)
18. S. Murakami et al., Trans. Fusion Technol. 27, 256 (1995)
19. K. Ida et al., Phys. Rev. Lett. 100 (2008) 045003 20. K. Ida et al., Plasma Phys, Control. Fusion57 (2015)
014036
21. K. Ida et al., Nature Communications6, 5816 (2015) 22. K. Ida et al., New Journal of Physics 15 013061
(2013)
23. Y. Kishimoto et. al, Plasma Phys, Control. Fusion41 A663, (1999)
24. K. C. Shaing et al., Nucl. Fusion55 (2015) 125001
Fig. 17 : Local electron energy confinement time inside reff =0.25 m (te_reff ≤ 0.25m) plotted versus i/2p near the