A Road Sign Identification and Analysis of
Augmented Reality using Image Processing
Technique
Nikita S. Mali1, Prof.Dr.M.P.Satone2
PG Student [VLSI and Embedded System], Dept. of E&TC, K. K. Wagh Institute of Engineering, Nashik,
Maharashtra, India1
Professor, Dept. of E&TC, K. K. Wagh Institute of Engineering College, Nashik, Maharashtra, India2
ABSTRACT: In past decades, India is rapidly developing country in the world. Therefore, people in India has demanded own vehicles. Population in India increases day by day and so transportation methods. Road accidents are increased especially on highways. Many people’s get injured and loss their life because they do not aware about meaning of road sign boards. Augmented Reality enhances intelligent transportation system by superimposing surrounding traffic information on the users view and keeps drivers view on road. A proposed system identifies the road sign using augmented reality and image processing techniques. A system collects the video of road signs with the help of camera which is mounted on moving vehicle. Image videos are converted into frames of image at the rate of 25frames/sec. Image pre-processing techniques such as converting RGB image to gray scale, resizing of image are used. Images are enhanced using median filtering technique. To extract features of image speeded-up robust features technology is used. The standard road sign images are stored in database and for classification of features linear support vector machine is used. Results are tested on 10 videos of road signs and it shows that proposed method correctly detects normal, blur and partial view of road sign videos.
KEYWORDS: Augmented Reality, Image Pre-processing, Feature Extraction, SURF Features, Support Vector
Machine.
I.INTRODUCTION
In recent years, many applications are developed for transportation safety. To solve road accident problem Automatic Traffic Sign Detection and Recognition (TSDR) system has been introduced. The objective of automatic TSDR system is to detect and recognize traffic signs within image captured by camera. Generally, driver does not notice road sign board in traffic which may cause accident.However, continuous changes in environment, lighting conditions, multiple traffic signs appearing at same time and blurring traffic signs are main difficulties for automatic TSDR system to detect correct name of road sign board [1].
Navigation system is providing information on traffic conditions and suggesting alternative directions. It depends on global positioning system and driver receives information from a satellite. It is capable of containing maps, which may be displayed in human readable format via text or in a graphical format. The main drawback of navigation system is that it requires internet connection. It is incapable of understanding meaning of blur and partial view of road sign images. So, it does not provide information of all road signs in front of driver such as left turn, right turn, one-way etc. [1].
contain many strong geometric shapes that could easily be misclassified as road signs. Accuracy is a key consideration, because even one misclassified or undetected sign could have an adverse impact on the driver.A proposed method collects the video of road signs with the help of camera which is mounted on moving vehicle. If captured image by camera and stored image in database are equivalent then driver will hear sound with name of corresponding road sign board. Road sign identification using augmented reality and image processing technique does not required internet connection. Blurred sign as well as partial view of road sign boards are virtually corrected through augmented reality (AR). The objective of proposed method is to identify road sign from video captured by camera and provide information to the driver about meaning of corresponding road sign board [2].
II. BLOCK DIAGRAM
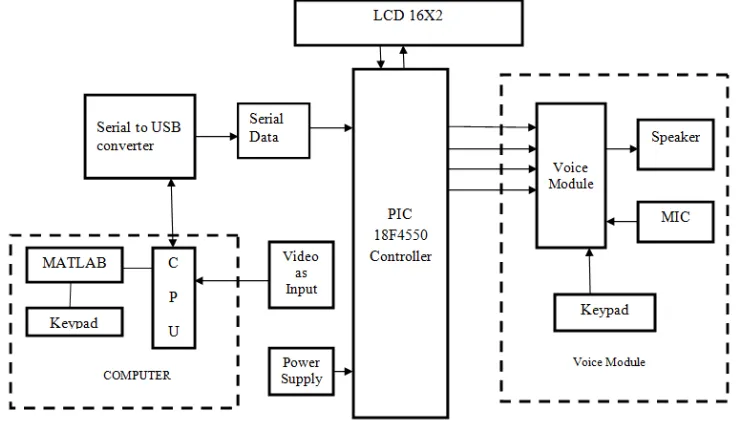
Fig. 1 shows block diagram of road sign identification using image processing technique. The video is stored on personal computer (PC) and process using MATLAB software. First, video is converted into frames then pre-processing, enhancement, segmentation, edge detection, features of road sign images are extracted using SURF method and road sign images are classified as per images stored in database using linear support vector machine (SVM) method.
After classification, code of matched database image is transferred to PIC 18F4550 controller through serial communication. PIC controller is continuously monitors the input and checks input code received with code stored in its look up tables. Once the matched code is found it displays the text of matched sign on LCD and plays the voice of same sign which is recorded and stored in apr 2080 voice IC. Eight switches of voice IC are used for recording different name of road signs [3].
Fig.1 Block diagram of road sign identification using image processing technique
III. FLOWCHART FOR ROAD SIGN IDENTIFICATION USING IMAGE PROCESSING TECHNIQUE
images stored in database using linear support vector machine. After classification, a feature matching consists of detecting a set of interest points from image data. After feature matching, road sign image is identified [4].
Fig.2 Flowchart for road sign identification using image processing technique
IV. SURF FEATURES
Features of road sign images are extracted using speeded-up robust features (SURF) method.It is local feature detector and descriptor. Interest point detection, local neighborhood description and matching are three main parts of SURF algorithm. To find points of interest in image SURF uses a BLOB detector which is based on the Hessian matrix. Blob detection method is detecting regions in a digital image that differ in properties, such as brightness or color, compared to surrounding regions. SURF uses the wavelet responses for feature description. A neighborhood around the key point is selected and divided into sub regions and then for each sub region the wavelet responses are taken and represented to get SURF feature descriptor [5].
The SURF descriptor starts by constructing a square region around the detected interest point. The size of window is 20s, where s is the scale at which the interest point is detected. Then, the interest region is further divided into smaller 4 × 4 sub-regions and for each sub region the Harr wavelet responses in the vertical and horizontal directions (denoted dx and dy, respectively) are computed at a 5×5 sampled points as shown in fig.3. These responses are weighted with a Gaussian window centered at the interest point to increase the robustness against geometric deformations and localization errors. The wavelet responses dx and dy are summed up for each sub-region and entered in a feature vector v, where
v = (dx, |dx|, dy, |dy|)
Fig.3: Dividing the interest region into 4×4 sub-regions for computing the SURF descriptor
V. SUPPORT VECTOR MACHINE
Support vector machine (SVM) is used for classification purpose. This method constructs a set of hyper-planes in a high dimensional space, which is use for classification or regression. The good separation achieved by the hyper-plane. SVM uses non-parametric with binary classifier approach and handles more input data efficiently. The easiest way to train the SVM is by using linearly separable classes [7].
The Fig.4 shows the simple model for representing support vector machine technique. The model consists of two different patterns and the goal of SVM is to separate these two patterns [8]. The model consists of three different lines. The line w.x-b=0 is known as margin of separation or marginal line. The lines w.x - b = 1 and w.x – b = -1 are the lines on the either side of the line of margin. These three lines together construct the hyper plane that separates the given patterns and the pattern that lies on the edges of the hyper plane is called support vectors. The perpendicular distance between the line of margin and the edges of hyper plane is known as margin. The objective of SVM isto maximize the margin for better classification. The larger the value of margin or the perpendicular distance, the better is the classification process and hence minimizing the occurrence of error [9].
Fig.4 SVM Model
VI. RESULTS
1) The clear view of road sign image ‘STOP’ is correctly detected in fig.5.
Fig.5Road sign image ‘STOP’
2) ‘DO NOT ENTER’ road sign is correctly detected using proposed method as shown in fig.6.
Fig.6Road sign image ‘DO NOT ENTER’
3) The clear view of road sign ‘YIELD’is correctly detected in Fig.7. The partial and blurred view of road sign ‘YIELD’ are correctly detected using augmented reality and image processing in fig.8.and fig.9respectively.
Fig.8 Partial view of road sign image ‘YIELD’
Fig.9 Blur view of road sign image ‘YIELD’
VI.CONCLUSION
A proposed method identifies the road signs using augmented reality and image processing technique. Speeded-up robust features (SURF) technology is used for extracting road sign image features. The standard road sign images are stored in database and for classification of features linear support vector machine (SVM) is used. It delivers unique solution and very efficient image classification method. SVM is able to deal with large amount of dissimilar information. A proposed method detects the blurred and partial view of road sign images correctly without internet.
REFERENCES
[1] Azuma, R., Baillot, Y., Behringer, R., Feiner, S., Julier, S., MacIntyre, B. Recent advances in augmented reality. IEEE Computer Graphics and Applications 21(6),pp.34–47,2001.
[2] A. Mogelmose, M. M. Trivedi, and T. B. Moeslund, “Vision-based traffic sign detection and analysis for intelligent driver assistance systems: Perspectives and survey,” IEEE Trans. Intell. Transp. Syst., vol. 13, no. 4,pp. 1484–1497, Dec. 2012.
[3] Y. Yang, H. Luo, H. Xu, and F. Wu, “Towards real-time traffic sign detection and classification,” in Proc. IEEE 17th ITSC, pp. 87–92, Oct.2014. [4] H. Fleyeh, and M. Dougherty. Traffic sign classification using invariant features and support vector machines.In Proc. IEEE Intelligent
VehiclesSymp.pages 530–535 (2008).
[5] Bay, H., Ess, A., Tuytelaars, T., Gool, L.: Speeded-up robust features (SURF). Comput. Vis. Image Underst. 110(3), 346–359 (2008).
[6] Janan, F., Brady, M.: Shape description and matching using integral invariants on eccentricity transformed images. Int. J. Comput. Vis. 113(2), 92–112 (2015)
[7] Jianxin Wu, "Efficient Hik SVM Learning For Image Classification", IEEE Transactions On Image Processing, Vol. 21, No. 10, October 2012. [8] “Feature Selection Using Genetic Algorithm for Face Recognition Based on PCA, Wavelet and SVM”, International Journal on Electrical Engineering
and Informatics,Vol. 6, No. 1, March 2014.