2089 | P a g e
Optimization and Predicting the Influence of Cutting
Parameters over Surface Roughness and Delamination of
Viapal VUP 9731 GFRP on Milling Operations through
GA seed Scatter Search Algorithm
Dr.D.Ramalingam*
1, R.RinuKaarthikeyen
2, Dr.S.Muthu
3, Dr.V.Sankar
4*
1Associate Professor, Nehru Institute of Technology, Coimbatore,( India)
*corresponding author
1
Research Associate, Manager – Engineering, TCMPFL, Chennai,(India)
2
Principal, Adithya Institute of Technology, Coimbatore, (India)
3
Professor, Nehru Institute of Engineering and Technology, Coimbatore, (India)
ABSTRACT
Milling operation is one of the common unconventional machining processes to achieve the size, shape and required surface quality. During milling operations on composite materials, delamination is one of the inevitable challenges which are commonly connected with the input machining parameters. In this attempt during milling on Viapal VUP 9731 GFRP composite material, the optimization of machining parameters referring to the surface roughness and delamination is analyzed through eleven optimization algorithms and forecasting of the combinations of such parameters is arrived in order to draw a path for reference according to the requirement of the product end quality. Initially algorithms are executed to iterate the values and the error rate is analyzed individually. Out of all the algorithms two best algorithms are chosen as best and second best based on the error rate occurred while computing the output. Two algorithms are combined by seeding the outcome values of the second best algorithm as the input values to the best algorithm to compute further. On confirming the outcome found to be tuned with the earlier results further forecasting of delamination factor, surface roughness for various combination of machining parameters is executed with step up number of iterations.
Keywords
Viapal VUP 9731; Milling; Delamination; SSA, SAA, ABC, ACO, PSO, HSA, GA, TSA, IWDA, FFA and BAT Algorithm; MATLAB. Minitab.
I. INTRODUCTION
2090 | P a g e
associated with the input cutting parameters. During the machining operations on GFRP composite materials as they are extremely abrasive the choice of the cutting tool and the cutting parameters is extremely significant. Machining forces significantly influence the major impact on the surface quality such as delamination and surface roughness.
ABBREVIATIONS USED
GFRP Glass Fiber Reinforced Plastic v Cutting speed, m/min f Feed, mm/rev Fw Machining force
Fd Delamination factor Ra Surface Roughness, µm
EXP Experiment SSA Scatter Search Algorithm SAA Simulated Annealing Algorithm ABC Artificial Bee Colony Algorithm ACO Ant Colony Algorithm PSO Particle Swarm Optimization Algorithm HSA Harmony Search Algorithm GA Genetic Algorithm
TSA Tabu Search Algorithm IWDA Intelligent Water Drop Optimization Algorithm
FFA Fruit Fly Algorithm BAT BAT Algorithm
II.RELATED LITERATURE REVIEW
2091 | P a g e
presented a new hybrid approach, named parallel genetic simulated annealing (PGSA) to find the optimal machining parameters for multi-pass milling operations. In this paper investigations is performed regarding the output parameters like machining force (Fw), delamination factor (Fd), surface roughness (Ra) influenced by the cutting parameters (cutting velocity and feed rate) on GFRP composite materials.
III. EXPERIMENT DATA
J Paulo Davim et al [1] has performed milling operation experiment on the reinforced with 65% of glass fiber unsaturated polyester hand lay-up material Viapal VUP 9731 which posses the mechanical and thermal properties as mentioned in the Table 3.1.
Table 3.1 Properties of Viapal VUP 9731 composite
Flexural strength (DIN EN 63) 480 N/mm2 Tensile modulus (DIN 53457) 26,470 N/mm2 Tensile strength (DIN EN 61) 480 N/mm2 Compressive strength (DIN 53454) 196 N/mm2 Tensile elongation (DIN EN 61) 1.7 % Impact resistance (DIN 53453) 150 190 kJ/m2 Martens temperature (DIN 53458) 200 0C
Thermal conductivity (DIN 52612) 0.15 0.22 W/m0C
The conducted experiments were on the hand lay-up discs made up of 22 mm thickness with a 5 mm diameter cemented carbide end mill (R12419680). During machining the depth of the cut was fixed as 2 mm. Experiment was performed on the „„VCE500 MIKRON‟‟ machining center with 11 kW spindle power and a maximum
spindle speed of 7500 rpm. Through the plan of experiments 9 tests were carried out by assigning cutting velocity (v); feed rate (f) as machining parameters to study the outputs variables machining force on the workpiece (Fw), delamination factor (Fd), surface roughness (Ra). The three levels of machining variables
selected are mentioned in Table 3.2.
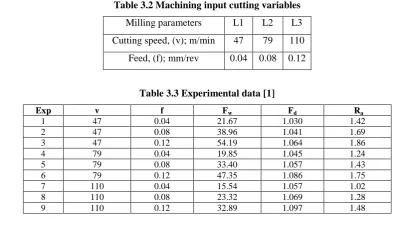
Table 3.2 Machining input cutting variables
Milling parameters L1 L2 L3
Cutting speed, (v); m/min 47 79 110
Feed, (f); mm/rev 0.04 0.08 0.12
Table 3.3 Experimental data [1]
Exp v f Fw Fd Ra
1 47 0.04 21.67 1.030 1.42
2 47 0.08 38.96 1.041 1.69
3 47 0.12 54.19 1.064 1.86
4 79 0.04 19.85 1.045 1.24
5 79 0.08 33.40 1.057 1.43
6 79 0.12 47.35 1.086 1.75
7 110 0.04 15.54 1.057 1.02
8 110 0.08 23.32 1.069 1.28
2092 | P a g e
With the Kistler piezoelectric dynamometer 9257B the machining forces were measured and Hommel tester T1000 profilometer was used to evaluate the surface roughness. Of 30x magnification, 1 µm resolution Mitutoyo TM 500 microscope used to measure the damage caused on the specimen composite material. The obtained observation outcome of the experiments was arranged in the Table 3.3.
IV. MATHEMATICAL MODELLING
On performing Best Subsets Regression analysis in Minitab the point noted through Table 3.1, Table 3.2 and Table3.3 is the contribution of tool feed presents the greater impact on Fw, Fd and Ra over the cutting speed.
Table 3.1 Best Subsets Regression: Fw Vs v, f
R-Sq R-Sq (adj) R-Sq (pred) v f
72.3 68.4 52.8 - x
22.3 11.2 0 x - 91.6 92.8 83.9 x x
Table3.2 Best Subsets Regression: Fd Vs v, f
R-Sq R-Sq (adj) R-Sq (pred) v f
60.5 54.9 32.7 - x
35.5 26.3 0 x - 96.0 94.7 92.0 x x
Table3.3 Best Subset Regression: Ra Vs v, f
R-Sq R-Sq (adj) R-Sq (pred) v f
57.5 51.7 28.7 - x
41.1 32.6 2.2 x -
98.8 98.4 97.3 x x
In the regression analysis of Fw versus v, f the p value is less than 0.01 which shows the statistically significant relationship between the variables at the 95% confidence level and the model summary in Table 3.4 reveals the R-sq value as 94.94% which is significant.
Table3.4 Regression Analysis: Fw versus v, f
S R-Sq R-Sq (adj) R-Sq (pred)
3.51237 94.64% 92.85% 83.93%
Regression Equation of Machining force is, Fw = 24.01 - 0.2275 v + 322.4 f ; and the Durbin-Watson test the statistic value is 0.894468 which is greater than 0.05, shows that there is no indication of serial autocorrelation. In the Fd versus v, f regression analysis the p value is less 0.01 (statistically significant at the 95% confidence level) and the R-sq value is 94.64% which is shown in Table 3.5
Table3.5 Regression Analysis: Fd versus v, f
2093 | P a g e
The Regression Equation of Delamination factor is, Fd = 0.98567 + 0.000466 v + 0.4792 f in which the Durbin- Watson Statistic is 2.79985. Of the Regression Analysis: Ra versus v, f statistical significance relationship between the variables at the 95% confidence level exists as the p < 0.01and the model summary analysis of Table 3.6 gives the R-sq value as 98.77 % which confirms the significance.
Table3.6 Regression Analysis: Ra versus v, f
S R-Sq R-Sq (adj) R-Sq (pred)
0.0342588 98.77% 98.36% 97.28%
The Regression Equation of Surface roughness is , Ra = 1.4884 - 0.006293 v + 5.875 f with the Durbin-Watson Statistic = 3.32343.
V. PROPOSED OPTIMIZATION TECHNIQUES
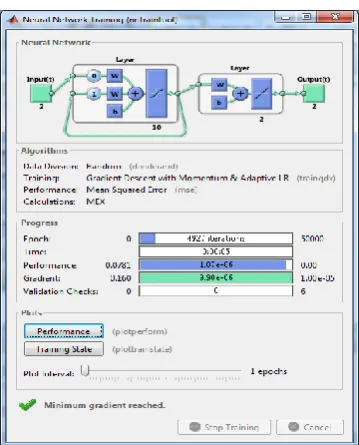
Forecasting of the Delamination factor and Surface roughness in the experimented composite materials was done with the objective of analyzing the influence of the cutting velocity, and the feed rate through the optimization algorithms Scatter Search Algorithm, Simulated Annealing Algorithm, Artificial Bee Colony Algorithm, Ant Colony Algorithm, Particle Swarm Optimization Algorithm, Harmony Search Algorithm, Genetic Algorithm, Tabu Search Algorithm, Intelligent Water Drop Optimization Algorithm, Fruit Fly Algorithm and BAT Algorithm in MATLAB ( Elman Back Propagation) The computed values of the output parameters arrived through these algorithms with initial iterations (500 iterations) are compared with the experimental observations individually and the error rate with respect to each algorithm is verified. Figure 5.1 indicates the menu list in MATLAB, Figure 5.2 shows the training data in progress.
2094 | P a g e
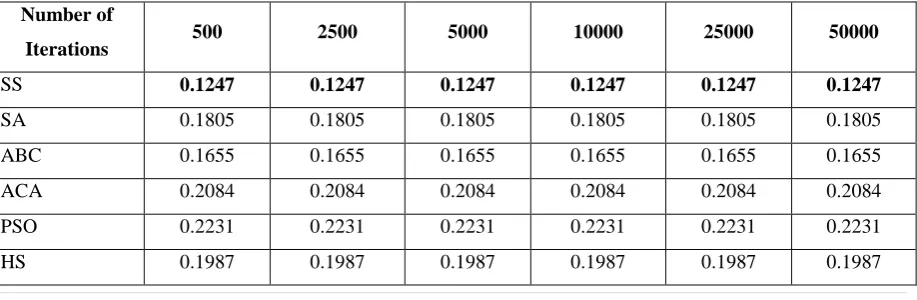
Figure 5.3 GA seed Scatter Search AlgorithmUpon the comparison, it is evident that the Scatter Search Algorithm is registered the most optimized values as the error rate registered is by the lowest value (0.124675) and next lowest error comparison value (0.154807) is obtained in Genetic Algorithm. In order to obtain tuned error rate, an attempt is made by seeding the output values of Genetic Algorithm as the input initialization values of the Scatter search and computed the combined GA Seed – Scatter Search Algorithm by shown in Figure 5.3. The output and the error rate value is recorded (0.012672) which is further less than the lowest error rate of the Scatter Search Algorithm and all the other algorithms are performed individually. Second set of computation with 1000 turns iterations also done and verified the results. As the same set of outcome registered as Scatter Search is the best and GA is the second best while the GA Seed – Scatter Search Algorithm output and the error rate value is recorded (0.010539) is found to be further tuned. Hence forth further computation of the above sequence is carried out with the iterations (stepwise as 2500, 5000, 10000, 25000 and 50000 iterations). The error rate of the individual algorithm on computing referring to each set of experimental combination are arranged in the Table 5.1 to 4 decimal points from 15 decimal computing values and the error rate comparison is revealed in Figure 5.4.
Table 5.1 Error Rate comparison with the experimental values of the incremental number of iterations
Number of
Iterations 500 2500 5000 10000 25000 50000
SS 0.1247 0.1247 0.1247 0.1247 0.1247 0.1247
SA 0.1805 0.1805 0.1805 0.1805 0.1805 0.1805
ABC 0.1655 0.1655 0.1655 0.1655 0.1655 0.1655
ACA 0.2084 0.2084 0.2084 0.2084 0.2084 0.2084 PSO 0.2231 0.2231 0.2231 0.2231 0.2231 0.2231
HS 0.1987 0.1987 0.1987 0.1987 0.1987 0.1987
Mutation Start
Check Termination
Cross Over Reproduction
Fitness calculation & generation evaluation Initialize Generation counter
Initialize Population
No
Yes
Generation Counter
Improvement Method
Best Output solution
Subset generation Solution Combination Reference update
Evaluation objective Function by Neural
network Improvement Method
Diversification generation method
Start
Check Termination
G
en
et
ic
A
lg
o
ri
th
m
S
ca
tt
er
S
ea
rc
h
A
lg
o
ri
th
2095 | P a g e
GA 0.1548 0.1548 0.1548 0.1548 0.1548 0.1548
TS 0.1900 0.1900 0.1900 0.1900 0.1900 0.1900
IWD 0.1974 0.1974 0.1974 0.1974 0.1974 0.1974 FFO 0.2177 0.2177 0.2177 0.2177 0.2177 0.2177
BAT 0.1841 0.1841 0.1841 0.1841 0.1841 0.1841
Best Algorithm SS SS SS SS SS SS
Second Best
Algorithm GA GA GA GA GA GA
The error rate comparison of Scatter Search Algorithm, Genetic Algorithm and GA seed – Scatter Search algorithm is arranged iteration wise along with the percentage fall in each stage in the Table 5.2.
Table 5.2 Error rate comparison of SSA, GA and GA Seed SSA
No of Iterations Scatter Search Genetic Algorithm GA Seed Scatter Search
Algorithm Error fall %
500 0.124675 0.154807 0.0126715133 - 2500 0.124675 0.154807 0.0065282484 15.10
5000 0.124675 0.154807 0.0039425539 7.86 10000 0.124675 0.154807 0.0022516798 42.89
25000 0.124675 0.154807 0.0012934700 42.56
50000 0.124675 0.154807 0.0008659841 33.05
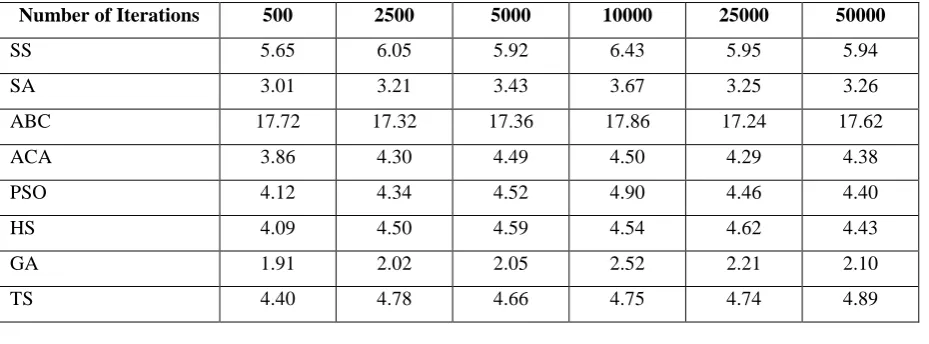
As the error rate is steadily stepped down with the increased number of iterations and the value is 0.0008659841 for the combination GA seed – SS algorithm of 50000 iterations, the performance is considered for further evaluating the influence of input machining parameters on the output variables. Simultaneously the time for computing through each algorithm individually and combined algorithm referring to each set of experimental combination are arranged in the Table 5.3 to 2 decimal points. The comparison of time taken and mean error comparison between the algorithms can be witnessed through Figure 5.5 and Figure 5.6.
Table 5.3 Time values to compute referring to the incremental iterations (up to 2 decimal)
Number of Iterations 500 2500 5000 10000 25000 50000
SS 5.65 6.05 5.92 6.43 5.95 5.94
SA 3.01 3.21 3.43 3.67 3.25 3.26
ABC 17.72 17.32 17.36 17.86 17.24 17.62
ACA 3.86 4.30 4.49 4.50 4.29 4.38
PSO 4.12 4.34 4.52 4.90 4.46 4.40
HS 4.09 4.50 4.59 4.54 4.62 4.43
GA 1.91 2.02 2.05 2.52 2.21 2.10
2096 | P a g e
IWD 3.87 4.40 4.28 5.55 4.24 4.25
FFO 3.90 4.18 4.26 4.44 4.25 4.17
BAT 3.50 3.73 3.81 4.20 3.77 3.91
GA seed SSA 6.34 15.96 26.28 37.20 55.82 105.11
Figure 5.4 Comparison of Error on computing Figure 5.5 Comparison of time of computing
VI. RESULTS AND DISCUSSIONS
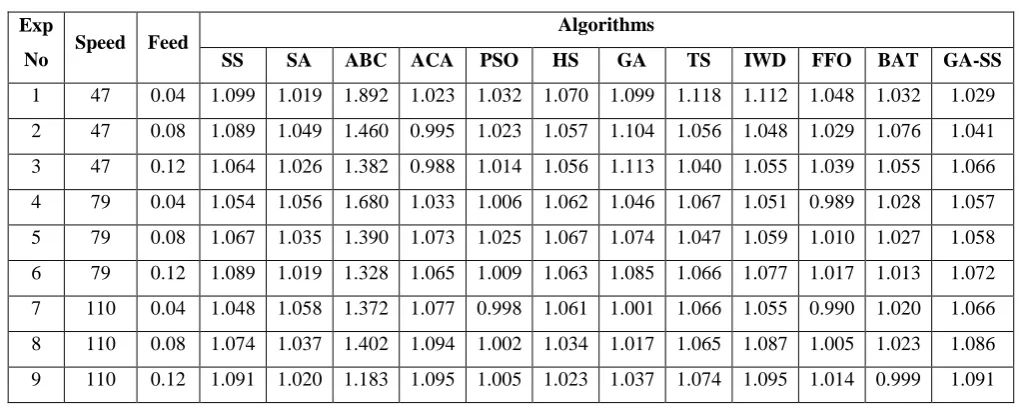
The computed values of delamination factor and surface roughness through the GA-SS combined algorithm with 50000 turns of iterations for the input machining parameters in line with the experimental combination are arranged in Table 6.1 and 6.2 respectively.
Table 6.1 Computed values of Delamination Factor through Algorithms
Exp
No Speed Feed
Algorithms
SS SA ABC ACA PSO HS GA TS IWD FFO BAT GA-SS
1 47 0.04 1.099 1.019 1.892 1.023 1.032 1.070 1.099 1.118 1.112 1.048 1.032 1.029
2 47 0.08 1.089 1.049 1.460 0.995 1.023 1.057 1.104 1.056 1.048 1.029 1.076 1.041 3 47 0.12 1.064 1.026 1.382 0.988 1.014 1.056 1.113 1.040 1.055 1.039 1.055 1.066
4 79 0.04 1.054 1.056 1.680 1.033 1.006 1.062 1.046 1.067 1.051 0.989 1.028 1.057
5 79 0.08 1.067 1.035 1.390 1.073 1.025 1.067 1.074 1.047 1.059 1.010 1.027 1.058 6 79 0.12 1.089 1.019 1.328 1.065 1.009 1.063 1.085 1.066 1.077 1.017 1.013 1.072
7 110 0.04 1.048 1.058 1.372 1.077 0.998 1.061 1.001 1.066 1.055 0.990 1.020 1.066 8 110 0.08 1.074 1.037 1.402 1.094 1.002 1.034 1.017 1.065 1.087 1.005 1.023 1.086
9 110 0.12 1.091 1.020 1.183 1.095 1.005 1.023 1.037 1.074 1.095 1.014 0.999 1.091
2097 | P a g e
ExpNo Speed Feed
Algorithms
SS SA ABC ACA PSO HS GA TS IWD FFO BAT GA-SS
1 47.0 0.040 1.426 1.910 1.095 1.360 1.085 1.615 1.886 1.913 1.524 1.151 1.391 1.420
2 47.0 0.080 1.442 1.587 1.083 1.485 1.529 1.512 1.338 1.403 1.374 1.310 1.586 1.649 3 47.0 0.120 1.518 1.555 1.072 1.390 1.685 1.393 1.389 1.545 1.330 1.244 2.002 1.877
4 79.0 0.040 1.551 1.401 1.092 1.534 0.766 1.554 1.033 1.177 1.357 1.163 1.124 1.300 5 79.0 0.080 1.723 1.480 1.060 1.440 0.958 1.537 1.274 1.394 1.505 1.089 1.280 1.517
6 79.0 0.120 1.020 1.476 1.044 1.374 1.386 1.419 1.310 1.535 1.488 1.086 1.304 1.631
7 110.0 0.040 1.605 1.383 1.051 1.664 0.717 1.307 1.043 1.232 1.320 1.014 0.991 1.106
8 110.0 0.080 1.048 1.423 1.033 1.431 1.092 1.814 1.181 2.124 1.837 0.900 0.908 1.284
9 110.0 0.120 1.607 1.411 1.032 1.278 1.413 1.849 1.285 2.167 1.531 1.034 0.915 1.336
The optimized value of surface roughness is 1.106 µm is attained through the combination of speed as 110 m / min and feed rate 0.040 mm / rev. For the Delamination optimized value the combination is 47 m /min speed and 0.04 mm / rev feed rate. Further to obtain and examine the inclination of the respondent variables referring to the input variables combination and to form a smooth curve plotting, an attempt is made by fixing the interval between the input parameters cutting speed and feed (the first two levels considered in the experimental approach) are subdivided into ten steps L1 to L12 as noted in Table 6.3 and the combined algorithm is trained to compile.
Table 6.3 Subdivision of cutting parameters assigned for computation
Milling parameters L1 L2 L3 L4 L5 L6
Cutting speed, (v); m/min. 47.0 50.2 53.4 56.6 59.8 63.0 Feed, (f); mm/rev. 0.04 0.044 0.048 0.052 0.056 0.06
Milling parameters L7 L8 L9 L10 L11 L12
Cutting speed, (v); m/min. 66.2 69.4 72.6 75.8 79.0 110.0 Feed, (f); mm/rev. 0.064 0.068 0.072 0.076 0.08 0.12
.
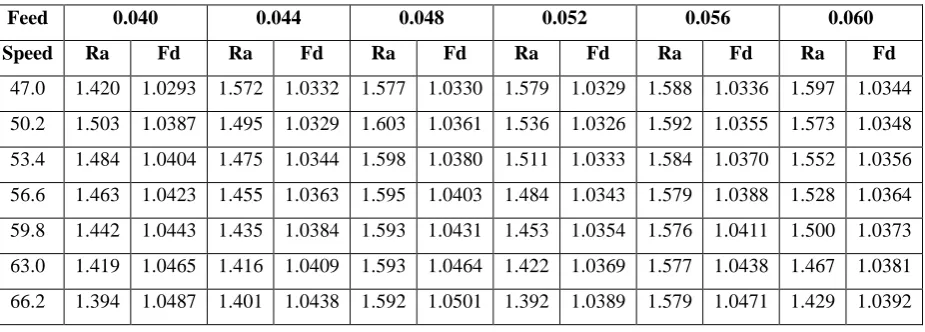
Table 6.4a Computed values of Ra and Fd by GA – SSA
Feed 0.040 0.044 0.048 0.052 0.056 0.060
Speed Ra Fd Ra Fd Ra Fd Ra Fd Ra Fd Ra Fd
47.0 1.420 1.0293 1.572 1.0332 1.577 1.0330 1.579 1.0329 1.588 1.0336 1.597 1.0344 50.2 1.503 1.0387 1.495 1.0329 1.603 1.0361 1.536 1.0326 1.592 1.0355 1.573 1.0348
53.4 1.484 1.0404 1.475 1.0344 1.598 1.0380 1.511 1.0333 1.584 1.0370 1.552 1.0356
56.6 1.463 1.0423 1.455 1.0363 1.595 1.0403 1.484 1.0343 1.579 1.0388 1.528 1.0364 59.8 1.442 1.0443 1.435 1.0384 1.593 1.0431 1.453 1.0354 1.576 1.0411 1.500 1.0373
63.0 1.419 1.0465 1.416 1.0409 1.593 1.0464 1.422 1.0369 1.577 1.0438 1.467 1.0381
2098 | P a g e
69.4 1.367 1.0508 1.392 1.0472 1.589 1.0541 1.368 1.0417 1.580 1.0507 1.393 1.0406
72.6 1.339 1.0528 1.390 1.0510 1.580 1.0580 1.357 1.0455 1.575 1.0544 1.365 1.0429
75.8 1.314 1.0548 1.391 1.0550 1.565 1.0620 1.358 1.0503 1.563 1.0584 1.351 1.0465 79.0 1.300 1.0571 1.386 1.0586 1.553 1.0660 1.361 1.0555 1.548 1.0628 1.346 1.0511
110.0 1.106 1.0659 1.209 1.0668 1.432 1.0869 1.298 1.0804 1.371 1.0894 1.302 1.0872
Table 6.4 b Computed values of Ra and Fd by GA – SSA
Feed 0.064 0.068 0.072 0.076 0.08 0.12
Speed Ra Fd Ra Fd Ra Fd Ra Fd Ra Fd Ra Fd
47.0 1.606 1.0353 1.616 1.0364 1.626 1.0377 1.638 1.0390 1.649 1.0405 1.877 1.0658
50.2 1.595 1.0365 1.600 1.0373 1.612 1.0385 1.624 1.0400 1.634 1.0414 1.865 1.0666 53.4 1.583 1.0377 1.583 1.0382 1.596 1.0396 1.608 1.0410 1.617 1.0423 1.852 1.0674
56.6 1.572 1.0391 1.564 1.0392 1.580 1.0407 1.592 1.0421 1.599 1.0434 1.837 1.0683
59.8 1.564 1.0410 1.541 1.0401 1.565 1.0421 1.573 1.0433 1.580 1.0445 1.822 1.0693 63.0 1.560 1.0432 1.513 1.0411 1.553 1.0439 1.552 1.0446 1.559 1.0458 1.805 1.0704
66.2 1.561 1.0461 1.478 1.0419 1.545 1.0461 1.526 1.0457 1.540 1.0473 1.785 1.0715
69.4 1.564 1.0493 1.439 1.0428 1.543 1.0489 1.492 1.0467 1.525 1.0492 1.759 1.0723 72.6 1.565 1.0528 1.400 1.0440 1.546 1.0521 1.453 1.0475 1.518 1.0518 1.724 1.0727
75.8 1.557 1.0562 1.370 1.0459 1.545 1.0555 1.413 1.0486 1.517 1.0549 1.680 1.0724 79.0 1.544 1.0600 1.350 1.0489 1.539 1.0589 1.378 1.0501 1.517 1.0582 1.631 1.0718
110.0 1.319 1.0887 1.299 1.0879 1.298 1.0876 1.291 1.0870 1.284 1.0859 1.336 1.0912
The outcome of the respondent parameters surface roughness and delamination factor through this computation are given in the Table 6.4a and 6.4b. The computed outcome values of surface roughness and delamination factor for the feed rate of 0.040 mm / rev for all the cutting speed combinations are presented in the Figure 6.1. From this plot the combination of cutting parameters can be located with respect to any required outcome.
Figure 6.1 Fd, Ra of feed rate 0.04 mm /rev Figure 6.2 Fd, Ra of feed rate 0.044 mm /rev
1.25 1.30 1.35 1.40 1.45 1.50 1.55 1.020 1.030 1.040 1.050 1.060 45 65 Su rf ac e R o u g h n ess Dela m in atio n Facto r Spindle Speed
Feed Rate 0.04 mm / rev
Fd Ra 1.03 1.04 1.05 1.06 1.07 1.025 1.225 1.425 1.625 45 65 Dela m in atio n Facto r Su rf ac e R o u g h n ess Spindle Speed
Feed Rate 0.044 mm / rev
Ra Fd
2099 | P a g e
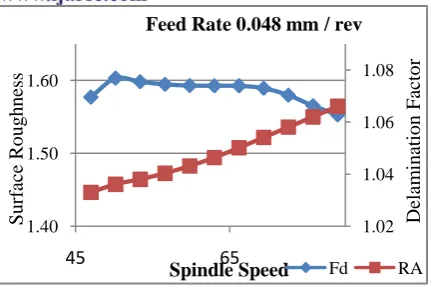
Figure 6.3 Fd, Ra of feed rate 0.048 mm /rev Figure 6.4 Fd, Ra of feed rate 0.052 mm /revFigure 6.5 Fd, Ra of feed rate 0.056 mm /rev Figure 6.6 Fd, Ra of feed rate 0.06 mm /rev
Figure 6.7Fd, Ra of feed rate 0.064 mm /rev Figure 6.8 Fd, Ra of feed rate 0.068 mm /rev
Figure 6.9 Fd, Ra of feed rate 0.072 mm /rev Figure 6.10 Fd, Ra of feed rate 0.076 mm /rev
1.02 1.04 1.06 1.08 1.40 1.50 1.60 45 65 Dela m in atio n Facto r Su rf ac e R o u g h n ess Spindle Speed
Feed Rate 0.048 mm / rev
Fd RA 1.02 1.04 1.06 1.08 1.20 1.30 1.40 1.50 1.60 45 65 Dela m in atio n Facto r Sur fa ce Ro u g h n ess Spindle Speed
Feed Rate 0.052 mm /rev
Ra Fd 1.030 1.040 1.050 1.060 1.070 1.540 1.560 1.580 1.600
45 65 Dela
m in atio n Facto r Sur fa ce Ro u g h n ess Spindle Speed
Feed Rate 0.056 mm / rev
Ra Fd 1.02 1.07 1.20 1.40 1.60
45 55 65 75 Dela
m in atio n Facto r Su rf ac e R o u g h n ess Spindle Speed
Feed Rate 0.06 mm / rev
Ra Fd 1.030 1.040 1.050 1.060 1.54 1.56 1.58 1.60 1.62 45 65 Dela m in atio n Facto r Su rf ac e R o u g h n ess Spindle Speed
Feed Rate 0.064 mm / rev
Ra Fd 1.02 1.04 1.06 1.08 1.25 1.45 1.65
45 55 65 75
Dela m in atio n Facto r Su rf ac e R o u g h n ess Spindle Speed
Feed Rate 0.068 mm / rev
Ra Fd 1.02 1.04 1.06 1.08 1.20 1.40 1.60
40 60 80
Dela m in atio n Facto r Su rf ac e R o u g h n ess Spindle Speed
Feed Rate 0.072 mm / rev
Ra Fd 1.02 1.07 1.25 1.45 1.65
40 60 80
Dela m in atio n Facto r Su rf ac e R o u g h n ess Spindle Speed
Feed Rate 0.076 mm / rev
2100 | P a g e
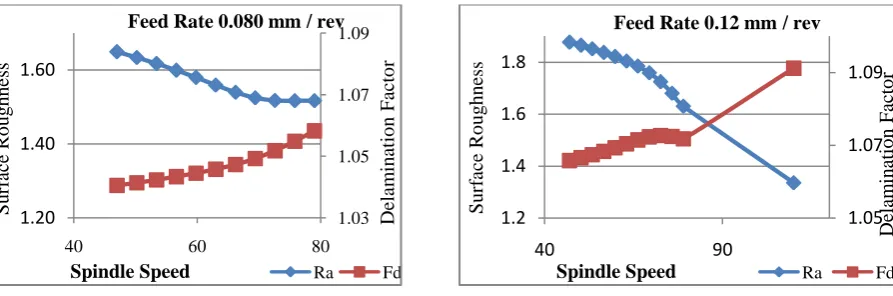
Figure 6.11 Fd, Ra of feed rate 0.08 mm /rev Figure 6.12 Fd, Ra of feed rate 0.12 mm /revBy this way, Figures 6.2 to Figures 6.12 depicts the forecasting values of Fd and Ra for the feed rate of 0.044, 0.048, 0.052, 0.056, 0.060, 0.064, 0.068, 0.072, 0.078, 0.080 and 0.120 respectively. On verification the regression analysis of the computed outcome, the regression equation of delamination factor is, Fd = 0.98181 + 0.000736 v + 0.2828 f; with Durbin-Watson Statistic value 1.33841 and for the surface roughness is, Ra = 1.6161 - 0.005116 v + 3.717 f; with Durbin-Watson Statistic value 2.90319.
VII. CONCLUSION
In this attempt SSA, SAA, ABC, ACO, PSO, HSA, GA, TSA, IWDA, FFA and BAT Algorithm are used to
forecasting of the Delamination factor and Surface roughness in the experimented composite materials Viapal VUP 9731 with the objective of analyzing the influence of the cutting velocity, and the feed rate. The application of optimization algorithms are executed in MATLAB (Elman Back Propagation).
Both the delamination and surface roughness is increased with the increase in feed rate.
The optimized value of surface roughness is 1.106 µm is attained through the combination of speed as 110 m
/ min and feed rate 0.040 mm / rev.
For the Delamination optimized value the combination is 47 m /min speed and 0.04 mm / rev feed rate.
Upon the comparison, it is evident that the Scatter Search Algorithm registered the most optimized values
with the lowest value (0.124675) error rate in computation.
Next lowest error in computation is by Genetic Algorithm (0.154807).
In order to tune the results, an attempt is made by allowing the output values of Genetic Algorithm as the
input values to the Scatter search and computed the combined GA – Scatter output. The error rate in computing is recorded (0.012672) which is the lowest error rate of all the algorithms performed individually.
The error rate is steadily in decreasing trend on the increased number of iterations and the value is 0.0009 for
the combination GA – SS algorithm of 50000 iterations.
Also to form a smooth curve plotting, an attempt is made by fixing ten divisions in the input parameters first
two level interval in the experimental approach and the GA –SA combined algorithm is trained to compile. The results are plotted feed rate wise to locate the combination of machining parameters based on the expected product quality in future.
1.03 1.05 1.07 1.09
1.20 1.40 1.60
40 60 80
Dela
m
in
atio
n
Facto
r
Su
rf
ac
e
R
o
u
g
h
n
ess
Spindle Speed
Feed Rate 0.080 mm / rev
Ra Fd
1.05 1.07 1.09
1.2 1.4 1.6 1.8
40 90 Dela
m
in
atio
n
Facto
r
Su
rf
ac
e
R
o
u
g
h
n
ess
Spindle Speed
Feed Rate 0.12 mm / rev
2101 | P a g e
Other algorithms are also may be tried to forecast the product quality in the machining parametersoptimization in future.
REFERENCES
[1] J. Paulo Davim, Pedro Reis, C. Conceic ao Antonio, “A study on milling of glass fiber reinforced plastics
manufactured by hand-lay up using statistical analysis (ANOVA),” Composite Structures 64: 493–500, 2004.
[2] Anthony Xavior M, Adithan M “Determining the influence of cutting fluids on tool wear and surface
roughness during turning of AISI 304 austenitic stainless steel,” J Mater Process Technol 209:900–909, 2009.
[3] Dhar NR, Kamruzzaman M, Ahmed M “Effect of minimum quantity lubrication (MQL) on tool wear and
surface roughness in turning AISI-4340 steel,” J Mater Process Technol 172:299–304, 2006.
[4] Ezugwu EO, Bonney J, Fadare DA, Sales WF, “Machining of nickel-base, Inconel 718, alloy with ceramic
tools under finishing conditions with various coolant supply pressures,” J Mater Process Technol 162– 163:609–614, 2005.
[5] Isik Y, “Investigating the machinability of tool steels in turning operations,” Mater Des 28:1417–1424, 2007. [6] Noordin MY, Venkatesh VC, Chan CL, Abdullah A, “Performance evaluation of cemented carbide tools in
turning AISI 1010 steel,” J Mater Process Technol, 116:16–21, 2001.
[7] Zafer T, Sezgin Y, “Investigation of the cutting parameters depending on process sound during turning of AISI 304 austenitic stainless steel,” Mater Des, 25:507–513, 2004.
[8] Thepsonthi T, Hamdi M, Mitsui K, “Investigation into minimal-cutting-fluid application in high-speed milling of hardened steel using carbide mills,” Int J Mach Tools Manuf, 49:156– 162, 2009.
[9] Ramulu M, Wern CW, Garbini JL, “Effect of the direction on surface roughness measurements of machined graphite / epoxy composite,” Compos Manuf, 4(1):39–51, 1993.
[10] Erisken E, “Influence from production parameters on the surface roughness of a machine short fibre reinforced thermoplastic,” Int J Machine Tools Manuf, 39:1611–18, 1999.
[11] KoplevA, Lystrup A, Vorm T. “The cutting process, chips and cutting forces in machining CFRP,” Composites 3;14(4):371– 6, 1983.
[12] Santhanakrishman G, Krishnamurthy R, Malhota SK. “Machinability characteristics of fibre reinforced plastics composites,” J Mech Working Technol, 17:195–204, 1998.
[13] Ramulu M, Arola D, Colligan K. “Preliminary investigation of effects on the surface integrity of fiber reinforced plastics,” In: Engineering systems design and analysis 2, PD, 64(2) ASME; 93–101, 1994.
[14] Hocheng H, Puw HY, Huang Y. Preliminary study on milling of unidirectional carbon fiber-reinforced plastics. Compos Manuf, 4(2):103–8, 1993.
[15] P.G. Petropoulos, “Optimal selection of machining rate variable by geometric programming,” International
Journal of Production Research, 11(4) 305-314, 1973.
[16] Y.C. Shin, Y.S. Joo, “Optimization of machining conditions with practical constraints,” International
2102 | P a g e
[17] J.S. Agapiou, “The optimisation of machining operations based on a combined criterion Part 2: Multipass operations,” Journal of Engineering for Industry, 114, 508-513, 1992.
[18] E.J.A. Armarego, A.J.R. Simith, J. Wang, “Computer-aided constrained optimization analyses strategies for
multipass helical tooth milling operation,‟ Annals of the CIRP, 43(1) 437-442, 1994.
[19] R. Gupta, J.L. Batra, J.K. Lal, “Determination of optimal subdivision of depth of cut in multipass turning with constraints,” International Journal of Production Research, 33 115- 127, 1995.
[20] S.E. Kilic, C. Cogun, D.T. Sen, “A computer-aided graphical technique for the optimization of machining conditions,” Computers in Industry, 22(3) 319-326, 1993.
[21] E.J.A. Armarego, A.J.R. Smith, J. Wang, “Constrained optimization strategies CAM software for single-pass peripheral milling,” International Journal of Production Research, 31(9) 2139-2160, 1993.
[22] M.T. Rad, I.M. Bidhendi, “On the optimization of machining parameters for milling operations,”
International Journal of Machine Tools & Manufacture, 37(1) 1-16, 1997.
[23] J. Wang, “Computer-aided economic optimization of end-milling operations,” International Journal of
Production Economics, 54(3) 307-320, 1998.
[24] Kunakote, T Bureerat, S “Multi-objective topology optimization using evolutionary algorithms,” Engineering Optimization, 43(5) 541-557, 2011.
[25] H. Md. Azamathulla, Wu, Fu-Chun, A Ab. Ghani, S. Narulkar, N. A. Zakaria, C. K. Chang, “Comparison between genetic algorithm and linear programming approach for real time Operation,” Journal of
Hydro-Environment Research, Elsevier & KWRA.,2(3)171-180, 2008.
[26] A. Ab. Ghani, H. Md. Azamathulla, “Gene-Expression Programming for sediment transport sewer pipe systems,” ASCE Journal of Pipeline Systems Engineering & Practice, 2(3) 102- 106, 2011.
[27] Z.G. Wang, M. Rahman, Y.S. Wong, J.Sun, “Optimization of multi-pass milling using parallel genetic algorithm parallel genetic simulated annealing,” International Journal of Machine Tools & Manufacture, 45(15) 1726-1734, 2005.
[28] Z.G. Wang, Y.S. Wong, M. Rahman, “Optimization of multi-pass milling using genetic algorithm genetic simulated annealing,” International Journal of Advanced Manufacturing Technology, 24 (9-10) 727-732,