1171 | P a g e
Heat Transfer Analysis of Cone Shaped Helical Coil Heat
Exchanger of Different Pitches and Diameter
Mukesh Kumar
1, Professor Manojkumar Singh
2 1M.Tech Research Scholar, Heat & Power,
2Associate Professor Mechanical Engineering
1,2B.I.T. Sindri, Dhanbad, Jharkhand, (India.)
ABSTRACT
Heat exchanger is a device in which both hot and cold fluids exchange heat between themselves without absorbing or losing heat from ambient.In the present study an experimental investigation of heat transfer in cone shaped helical coil heat exchanger ireported for various Reynolds number. The purpose of this article is to compare the heat transfer in cone shaped helical coil and simple helical coil. The pitch, height and length of both the coils are kept same for comparative analysis. The calculations have been performed for the steady state condition and experiments were conducted for different flow rates in laminar and turbulent flow regime. The coil side flow rate is kept varying while the coil side flow rate is kept constant. It was observed that the effectiveness of the heat exchanger for the cone shaped helical coil is more than that for the simple helical coil. Results show that the heat transfer rates for the cone shaped helical coil are comparatively higher than that of the simple helical coil.
I. INTRODUCTION
Heat exchanger is a device in which both hot and cold fluids exchange heat between themselves without
absorbing or losing heat from ambient. Examples are -Steam condenser (steam or vapour to water), Economizer
(flue gases to feed water), Super heater (flue gases to steam), Cooling tower (hot water to ambient air), Air pre
heater (hot flue gases to combustion air), Oil cooler (hot oil to coolant), etc.
Heat exchangers are broadly used in process industries for ample variety of applications including refrigeration
and air-conditioning, nuclear reactors, chemical processing, food industries, steam power plant and medical
equipment. By improving coefficient of heat transfer, the heat exchanger dimensions will reduce and its
performance will improve. At present various techniques of heat transfer augmentation are used by researchers.
These are classified into three groups: active, passive and compound techniques [1]. In active techniques
external force are required for improvement like electric field, surface vibration and fluid vibration, where as in
passive techniques various tube insert or unique surface geometries are used. If two or more of these techniques
are used for augmentation in heat transfer they are called as compound enhancement. In industries shell and coil
tube configuration are frequently used which is a significant passive technique. In equipments like heat
exchangers and reactors, helical coil arrangement is very effective because of compact structure which produces
large heat transfer surface area in a small space [2].
In laminar and turbulent flow system broad research on experimental and numerical investigation on simple
helical coils was done by different researchers. However, fluid flow through helical coil of cone shape is still
1172 | P a g e
characteristic with numerical replication method was investigated by Pei-qi (2011) for conical spiral tubepackage. They observed that cross section and cone angle have major effect while helical pitch has little effect
on heat transfer augmentation. At constant cross section area, circular section has larger heat transfer coefficient
than elliptical section [3]. Salimpour (2009) investigated heat transfer coefficient for three heat exchanger of
different pitch and found that larger pitch have higher heat transfer coefficient than smaller pitches [4]. Pawar et
al. (2011) carried out a survey of heat transfer through circular helical coils. They developed correlation in terms
of M number to determine pattern of flow in helical coils [5].
Classification of Heat Exchanger
Heat exchanger are mainly classified into three group
Direct transfer type H.E. - In any direct transfer type H.E. there is no contact between both the fluids but heat
transfer takes place by pipe wall of separation e.g.- economizer, surface condenser, air pre heater. Direct transfer
type heat exchangers are sub classified as:
a. Parallel flow H.E.
b. Counter flow H.E.
c. Cross flow H.E.
Direct contact type H.E. – In this type of H.E both hot and cold fluid mix up in one another while transferring
heat between them. Examples- cooling tower, jet condenser.
Regenerative or storage type H.E. –Both types of hot and cold fluids were alternately passed through the
cellulose matrix, one heats the matrix and other picks the heat from it. e.g. Ljungstorm air preheater.
Log. Mean Temper. Difference (LMTD)
LMTD is the temperature difference which, if kept constant, will lead to the same rate of heat transfer that
actually takes place under varying conditions of temperature difference.
LMTD=
Where =inlet temp. Difference and
=outlet temp. Difference
Effectiveness of Heat Exchanger – Effectiveness of H.E. is defined as the ratio of actual heat transfer rate to
maximum possible heat transfer rate between hot and cold fluids.
ᵋ =
Number of Transfer Units- The 'NTU' in a heat exchanger is given by
NTU=
Where, =Overall heat transfer coefficient
C= Heat capacity
ᵋ = Effectiveness of H.E.
1173 | P a g e
II. LITERATURE REVIEW
Ghorbani et al. (2010) gives experimental analysis of mixed convection heat transfer at different Reynolds and
Rayleigh number, different tube to coil diameter ratio and pitch coil in a coil in shell heat exchanger. Purpose of
this article was to determine the flow rate and coil pitch over the modified effectiveness and performance
coefficient for vertical coil tube heat exchanger. They found that LMTD decreases as mass flow ratio increases.
Mujumdar et al. (2011) evaluated the heat transfer performance of non circular helical coil tubes. They
investigated the conical, helical, and in-plane spiral configuration and their performances are compared with the
straight duct. It is reported coiled ducts gave higher heat transfer rates, at the cost of high pressure drop.
Kumar et al. (2012) gives a detailed experimental study in laminar and transition regime on five wire coils of
different pitches insert. They concluded that as pitch decreases, efficiency increases. It is highest for conical
sets. At Reynolds number of 2200-3000, friction factor is maximum.
Elazm et al. (2012) compared the performance of helical cone coil heat exchanger to ordinary helical coil and
introduced the concept of helical cone coils. They found the Nusselt number, heat transfer coefficient and coil
exit temperature are directly proportional to the taper angle. The increase in the coil taper angle leads to a lower
space requirement for the setup.
Marko et al. (2012) studied heat transfer coefficient of 3 heat exchangers with helical coils. Prime focus was on
shell-side heat transfer coefficient that is highly affected by geometric/construction parameters e.g. as winding
angle, radial pitch, axial pitch, etc. It was reported that the shell-side heat transfer coefficients should be based
on shell side hydraulic diameter as it includes the number of shell side construction parameters.
Shinde and Danger (2013) performed experiments on cone shaped helical coil H.E. at various Reynolds number.
Comparison between cone and simple helical coil is the main focus taking pitch, height and length of both coils
constant. For cone shaped coil heat transfer rate are up to 1.38 times higher than simple helical coil. Also overall
heat transfer coefficient, convective heat transfer and Nusselt number increases when fluid flow rate increases.
Farhadi et al. (2013) carried outthe experimentalanalysis to increase the heat transfer rate in shell and coiled
tube heat exchanger. Shell and tube side heat transfer coefficients are calculated by Wilson plots. From
experimental analysis they found that by increasing the flow rate of shell side, Nu increases. As Dean number
increases, overall heat transfer coefficient and Nusselt number increases.
Ray et al. (2014) performed paper reviews on experimental works using passive heat transfer technique, on this
technique wire coil insert in tubes to augment heat exchanger efficiency. It also useful for designers in
implement of passive enhancement techniques. For strengthen heat transfer efficiency here various developed
wire coil insert are researched.
Purandare et al. (2015) gives thermal analysis of conical coil H.E. through experimental investigation. The
analysis indicates that Nu and f are function of curvature ratio, cone angle, tube diameter and flow rates. They
found effectiveness of H.E. is a function of Re. As Re increases effectiveness decreases. The Nu increases as Re
increases inside tube taking constant cold water flow. As Re increases friction factor f reduces also f increases
for increasing cone angle for same Re.
III. OBJECTIVES
1174 | P a g e
i.
average heat transfer rate
ii.
overall heat transfer coefficient
iii.
effectiveness
For various pitches and to analyze the effect of pitch variation and to establish mathematical relation
for LMTD by taking coil tube diameter and coil pitch as input parameters.
IV.
EXPERIMENTAL DETAILS AND SETUP
This chapter provides schematic diagram (Figure 3.1) and actual diagram (Figure 3.2) of experimental setup, list
of equipment with specification, formation of a conical coil for experimental setup and experimental procedure
of proposed system.
Figure 4.1 Schematic diagram of experimental set up
Figure 3.2 Actual diagram of experimental set up
LIST OF EQUIPMENTS OF EXP SET UP WITH SPECIFICATION
• Water storage tank-2, (100 Its.) • Water heater-1, (1500 W)
1175 | P a g e
• Flow control valve• Rotameter-2, (0-5 LPM) • Micro manometer
• Shell-dia-300 mm, height-250 mm • Thermocouple-4 (j type)
EQUIPMENT
Water discharge pump or centrifugal pump
Water tank
Water heater
Rotameter
Pressure gauge (Manometers & Mechanical gauges)
Thermocouple (j-type)
V. EXPERIMENTAL PROCEDURE OF THE PROPOSED SYSTEM
i. Initially water is filled in both the tanks and then heater was switched as to heat water in hot water tank.
ii. Centrifugal pump of hot water side was started after desired temperature of water was achieved to
circulate hot water through coil. The flow rate is measured by rotameter and controlled by flow control
valve (FCV).
iii. At same instant, centrifugal pump of cold water side was started. Cold water flow rate is controlled by
FCV and measure by rotameter in a manner similar to previous one.
iv. The above test was carried out in counter flow configuration.
v. Once steady state is achieved, inlet and outlet temperature of shell side and coil side are measured by
thermocouple.
vi. Keeping shell side flow rate constant, the temperature was recorded for different hot water mass flow
rate.
vii. Repeat the procedure for other coil.
VI. FORMULA USED IN CALCULATIONS
LMTD =
Where LMTD=Logarithmic mean temperature difference
= At inlet temperature difference
= At outlet temperature difference
Overall heat transfer coefficient
= q / (A*∆ ) W/ K
• Hot water heat transfer rate
= * *(Tin-Tout)
1176 | P a g e
= * * (Tout-Tin)• Avg. heat transfer rate
q = ( + )/2 W
• Effectiveness of Heat Exchanger (ᵋ ) • If * < *
ᵋ = ( - ) / ( - ) • If * < *
ᵋ = ( - ) /( - )
VII. OBSERVATION TABLE
Table-7.1 Observation table for tube diameter 10mm*12mm and pitch 20 mm
S.N
(°c) (°c) (°c) (°c) ∆
(°c)
q
In KW KW/ K
ᵋ
Mh=1
Mc=4
1 39 27 14 17 17.11 0.71 0.61 0.54
2 34 25 17 19 11.14 0.75 0.57 0.50
Avg 14.13 0.73 0.59 0.52
Mh=1.5
Mc=4
1 48 33 11 17 26.24 0.86 0.63 0.43
2 34 28 18 20 11.89 0.90 0.59 0.39
Avg. 19.07 0.88 0.61 0.41
Mh=2
Mc=4
1 47 35 15 21 22.87 0.90 0.66 0.42
2 35 29 19 22 11.43 0.94 0.62 0.38
Avg. 17.15 0.92 0.64 0.40
Mh=2.5
Mc=4
1 45 34 12 19 23.94 0.96 0.78 0.37
2 30 26 19 21 7.96 1.00 0.74 0.33
Avg. 15.95 0.98 0.76 0.35
Mh=3
Mc=4
1 44 35 16 23 19.98 1.02 0.92 0.36
2 34 30 21 24 9.49 1.06 0.88 0.32
Avg. 14.74 1.04 0.90 0.34
Mh=3.5
Mc=4
1 46 38 15 22 23.50 1.16 1.00 0.32
2 32 29 21 23 8.50 1.20 0.96 0.28
Avg. 16 1.18 0.98 0.30
Mh=4
Mc=4
1 41 31 9 19 22 1.55 1.20 0.30
2 33 27 14 20 13 1.59 1.16 0.26
1177 | P a g e
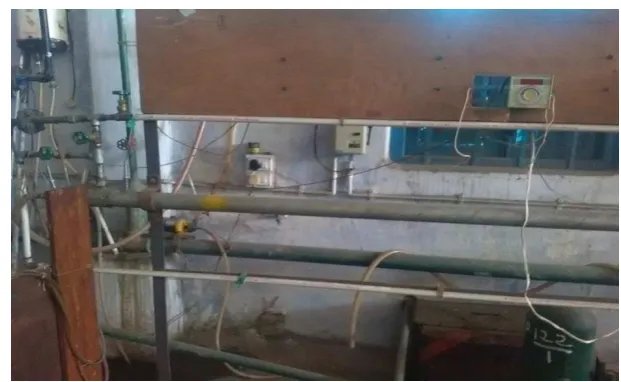
Table 7.2 Observation table for tube diameter 7mm*9mm and pitch 20 mmS.N
(°c) (°c) (°c) (°c) ∆
(°c)
q
In KW KW/ K
ᵋ
Mh=1
Mc=4
1 41 34 24 26 12.33 0.53 0.47 0.45
2 37 32 26 27 7.83 0.49 0.43 0.41
Avg. 10.08 0.51 0.45 0.43
Mh=1.5
Mc=4
1 41 35 23 25 13.90 0.55 0.53 0.37
2 36 32 25 26 8.41 0.51 0.49 0.33
Avg. 11.16 0.53 0.51 0.35
Mh=2
Mc=4
1 44 37 22 25 16.92 0.71 0.60 0.33
2 38 34 24 26 10.97 0.67 0.56 0.29
Avg. 13.95 0.69 0.58 0.31
Mh=2.5
Mc=4
1 42 36 20 24 17 0.82 0.74 0.29
2 35 32 24 26 8.5 0.78 0.70 0.25
Avg. 12.75 0.80 0.72 0.27
Mh=3
Mc=4
1 41 36 20 24 16.5 0.86 0.83 0.28
2 35 32 24 26 8.5 0.82 0.79 0.24
Avg. 12.5 0.84 0.81 0.26
Mh=3.5
Mc=4
1 42 37 17 21 20.5 0.91 0.94 0.22
2 31 29 21 22 8.5 0.87 0.90 0.18
Avg. 14.5 0.89 0.92 0.20
Mh=4
Mc=4
1 43 38 19 24 19 1.20 1.18 0.20
2 37 34 22 25 12 1.16 1.14 0.16
Avg. 15.5 1.18 1.16 0.18
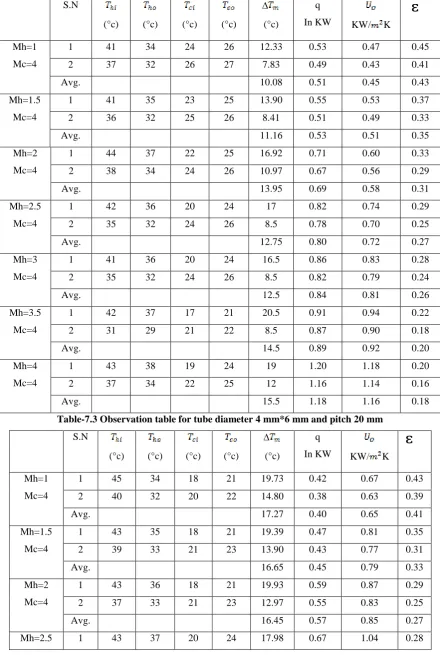
Table-7.3 Observation table for tube diameter 4 mm*6 mm and pitch 20 mm
S.N
(°c) (°c) (°c) (°c) ∆
(°c)
q
In KW KW/ K
ᵋ
Mh=1
Mc=4
1 45 34 18 21 19.73 0.42 0.67 0.43
2 40 32 20 22 14.80 0.38 0.63 0.39
Avg. 17.27 0.40 0.65 0.41
Mh=1.5
Mc=4
1 43 35 18 21 19.39 0.47 0.81 0.35
2 39 33 21 23 13.90 0.43 0.77 0.31
Avg. 16.65 0.45 0.79 0.33
Mh=2
Mc=4
1 43 36 18 21 19.93 0.59 0.87 0.29
2 37 33 21 23 12.97 0.55 0.83 0.25
Avg. 16.45 0.57 0.85 0.27
1178 | P a g e
Mc=4 2 36 33 24 26 9.49 0.63 1.00 0.24
Avg. 13.74 0.65 1.02 0.26
Mh=3
Mc=4
1 41 37 22 25 15.49 0.69 1.10 0.24
2 34 32 25 26 7.49 0.69 1.06 0.20
Avg. 11.49 0.67 1.08 0.22
Mh=3.5
Mc=4
1 41 37 22 25 15.49 0.78 1.19 0.20
2 35 33 26 27 7.49 0.74 1.15 0.16
Avg. 11.49 0.76 1.17 0.18
Mh=4
Mc=4
1 40 35 16 21 19 1.05 1.37 0.18
2 34 32 22 24 10 1.01 1.33 0.14
Avg. 14.5 1.03 1.35 0.16
Table-7.4 Observation table for tube diameter 10 mm*12mm and pitch 15mm
S.N
(°c) (°c) (°c) (°c) ∆
(°c)
q
In KW KW/ K
ᵋ
Mh=1
Mc=4
1 45 38 26 28 14.36 0.53 0.44 0.51
2 38 32 28 30 5.77 0.49 0.40 0.47
Avg. 10.07 0.51 0.42 0.49
Mh=1.5
Mc=4
1 44 37 25 28 13.90 0.55 0.50 0.40
2 36 33 28 29 5.94 0.51 0.46 0.36
Avg. 9.92 0.53 0.48 0.38
Mh=2
Mc=4
1 42 36 24 27 13.44 0.69 0.58 0.38
2 37 35 29 30 6.49 0.65 0.54 0.34
Avg. 9.97 0.67 0.56 0.36
Mh=2.5
Mc=4
1 46 37 20 26 18.5 0.82 0.62 0.33
2 35 31 25 27 6.95 0.78 0.58 0.29
Avg. 12.73 0.80 0.60 0.31
Mh=3
Mc=4
1 43 36 18 23 18.98 0.98 0.69 0.30
2 35 32 24 26 8.49 0.94 0.65 0.26
Avg. 13.74 0.96 0.67 0.28
Mh=3.5
Mc=4
1 46 38 16 23 22.49 1.20 0.89 0.27
2 36 32 23 26 9.49 1.16 0.85 0.23
Avg. 15.99 1.18 0.87 0.25
Mh=4
Mc=4
1 45 35 9 19 26 1.97 1.20 0.24
2 36 31 19 24 12 1.93 1.16 0.20
1179 | P a g e
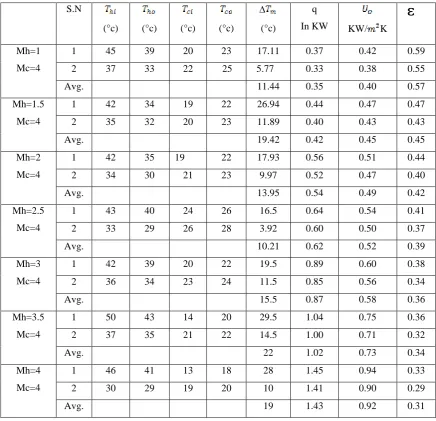
Table-7.5 Observation table for tube diameter 10 mm*12mm and pitches 25 mmS.N
(°c) (°c) (°c) (°c) ∆
(°c)
q
In KW KW/ K
ᵋ
Mh=1
Mc=4
1 45 39 20 23 17.11 0.37 0.42 0.59
2 37 33 22 25 5.77 0.33 0.38 0.55
Avg. 11.44 0.35 0.40 0.57
Mh=1.5
Mc=4
1 42 34 19 22 26.94 0.44 0.47 0.47
2 35 32 20 23 11.89 0.40 0.43 0.43
Avg. 19.42 0.42 0.45 0.45
Mh=2
Mc=4
1 42 35 19 22 17.93 0.56 0.51 0.44
2 34 30 21 23 9.97 0.52 0.47 0.40
Avg. 13.95 0.54 0.49 0.42
Mh=2.5
Mc=4
1 43 40 24 26 16.5 0.64 0.54 0.41
2 33 29 26 28 3.92 0.60 0.50 0.37
Avg. 10.21 0.62 0.52 0.39
Mh=3
Mc=4
1 42 39 20 22 19.5 0.89 0.60 0.38
2 36 34 23 24 11.5 0.85 0.56 0.34
Avg. 15.5 0.87 0.58 0.36
Mh=3.5
Mc=4
1 50 43 14 20 29.5 1.04 0.75 0.36
2 37 35 21 22 14.5 1.00 0.71 0.32
Avg. 22 1.02 0.73 0.34
Mh=4
Mc=4
1 46 41 13 18 28 1.45 0.94 0.33
2 30 29 19 20 10 1.41 0.90 0.29
Avg. 19 1.43 0.92 0.31
VIII.
RESULTS AND DISCUSSION
The results obtained from the experimental analysis of conical coil heat exchanger operated at different
conditions are studied in detail and are presented below
8.1 Thermal analysis
The thermal performance of conical coil heat exchanger is determined on the basis of heat transfer rate, overall
heat transfer coefficient and effectiveness. The coil side flow- rate was varied between 60 LPH to 240 LPH and
during this flow rate through shell side was kept constant. The experiments are carried out only for counter flow
arrangement.
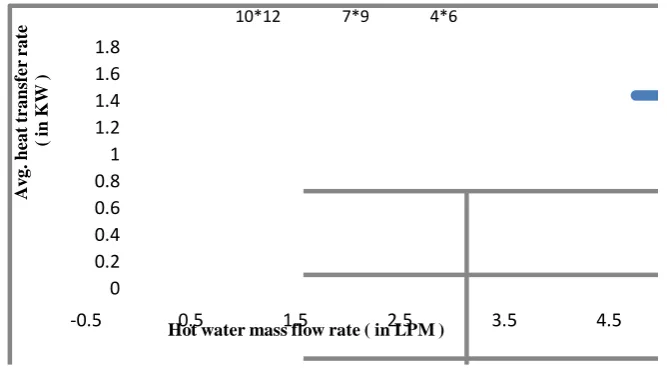
Figure 8.1 shows the variation of average heat transfer rate with hot water mass flow rate for three different tube
1180 | P a g e
rate increases with fluid flow rate. It also indicated that the heat transfer rate was maximum for tube diameter10 mm*12 mm due to more surface area.
0 0.2 0.4 0.6 0.8 1 1.2 1.4 1.6 1.8
-0.5 0.5 1.5 2.5 3.5 4.5
A v g. heat t ra nsf er ra te ( in K W )
Hot water mass flow rate ( in LPM )
10*12 7*9 4*6
Figure 8.1. Variation of avg. heat transfer rate with hot water mass flow rate for coil pitch 20 mm
Figure 8.2 indicate the variation of overall heat transfer coefficient with hot water mass flow rate for three
different tube diameter 10mm*12mm, 7mm*9mm, and 4mm*6mm taking constant pitch of 20 mm. The overall
heat transfer rate increases with fluid flow rate. The U value was found maximum for 4 mm*6 mm tube
diameter, due to least surface area. Increase in tube and coil diameter decreases the secondary which reduces the
heat transfer coefficient [6].
0 0.2 0.4 0.6 0.8 1 1.2 1.4 1.6
0 1 2 3 4 5
O ve ral l h eat tr an sfe r c oe ffi ci en t, in k w /m2k
Hot water mass flow rate ( in LPM)
10*12 7*9 4*6
Figure 8.2 Variation of overall heat transfer coefficient with hot water mass flow rate for coil pitch 20 mm
Figure 8.3 indicate the variation of effectiveness of heat exchanger with hot water mass flow rate for three
different tube diameter 10mm*12mm, 7mm*9mm, and 4mm*6mm taking constant pitch of 20 mm. The heat
exchanger effectiveness decreases as fluid flow rate increases. As fluid flow rate increases the contact time
1181 | P a g e
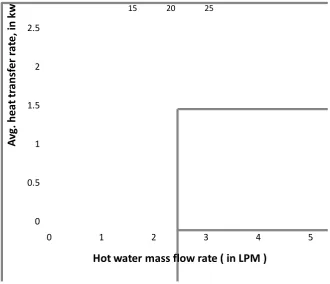
Figure 8.3 Variation of effectiveness of heat exchanger vs. hot water mass flow rate for coil pitch 20 mmFigure 8.4 indicate the variation of average heat transfer rate with hot water mass flow rate for three different
coil pitches 15 mm, 20 mm and 25 mm taking tube diameter 10 mm*12 mm constant. The Q value increases
with fluid flow rate. From experimental observation it was concluded that heat transfer rate is maximum for 25
mm pitch coil than other two coils.
0 0.5 1 1.5 2 2.5
0 1 2 3 4 5
A
vg
. h
ea
t
tr
an
sf
er
r
at
e,
in
kw
Hot water mass flow rate ( in LPM )
15 20 25
Figure 8.4 Variation of avg. heat transfer rate vs. hot water mass flow rate for tube diameter 10 mm*12 mm
Figure 8.5 indicates variation of overall heat transfer coefficient with hot water mass flow rate for three different
coil pitches 15 mm, 20 mm and 25 mm taking tube diameter 10 mm*12 mm constant. Elazm et al. [7] also
1182 | P a g e
Figure 8.5 Variation of overall heat transfer coefficient vs. hot water mass flow ratefor tube diameter 10 mm*12 mm
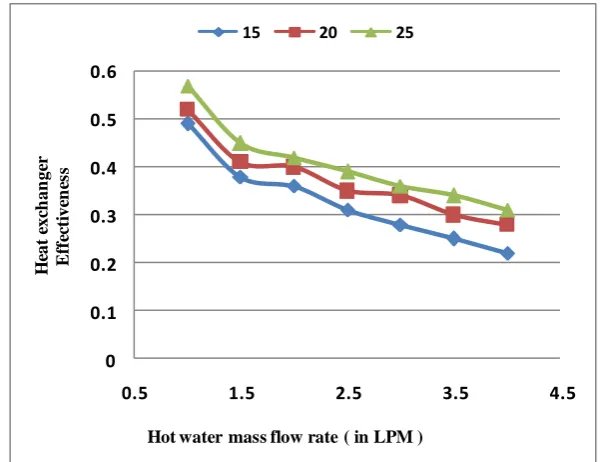
Figure 8.6 indicate variation of effectiveness of heat exchanger with hot water mass flow rate for three different
pitches 15 mm, 20 mm and 25 mm taking tube diameter 10 mm*12 mm constant. Earlier we have known that
effectiveness of heat exchanger decreases with increasing fluid flow rate. From observations it was found that
coil pitch of 25 mm has more effectiveness than other two pitches.
0 0.1 0.2 0.3 0.4 0.5 0.6
0.5 1.5 2.5 3.5 4.5
H
eat e
xc
h
an
ge
r
Eff
ec
ti
ve
n
es
s
Hot water mass flow rate ( in LPM )
15 20 25
Figure 8.6 Variation of effectiveness of heat exchanger vs. hot water mass
flow rate for tube diameter 10 mm*12 mm
Above results indicates that average heat transfer rate, overall heat transfer coefficient and effectiveness of
1183 | P a g e
Also after doing linear regression we obtained two mathematical relation as a result. They are:1. ∆ = -0.63+1.21* +1.49*
2. ∆ = 4.78+1.95*P-9.62*
Where, ∆ =LMTD
=Outer tube diameter
P=Pitch of coil
= Hot water mass flow rate
IX. CONCLUSION
The heat transfer characteristics of the conical coil heat exchanger with different pitches, tube diameters and
mass flow rates were determined. The investigation leads to following conclusions for the present study:
1. Among three tube diameter 10mm*12mm, 7mm*9mm and 4mm*6mm, the tube diameter of 10*12mm is
more effective.
2. For three different pitches of 15mm, 20mm and 25 mm, 25 mm pitch is more effective.
3. As mass flow rate increases avg. heat transfer rate and overall coefficient increases while effectiveness
decreases.
4. Regression models were developed to predict LMTD.
REFERENCES
[1]. Pramod S. Purandare, Mandar M. Lele and Raj Kumar Gupta (2015) Investigation on the thermal analysis
of conical coil heat exchanger, International Journal of Heat mass transfer, 90, 1188-119.
[2]. N. Acharya, M. Sen and H.C. Chang (2001) Analysis of heat transfer enhancement in coiled-tube heat
exchangers, International Journal of Heat Mass Transfer 44, 3189–3199.
[3]. Pei-qi (2011)Numerical simulation on heat transfer characteristic of conical spiral tube bundle, Applied
Thermal Engineering31, 284-292.
[4]. M. R. Salimpour (2009) Heat transfer coefficients of shell and coiled tube heat exchangers, Experimental
Thermal and Fluid Science33 , 203–207.
[5]. Shinde and Dange (2013) Heat transfer analysis of a cone shaped helical coil heat exchanger, International
Journals of innovations in engineering and technology, vol. 3.
[6]. S. S. Pawar(2011) A critical review of heat transfer through helical coils of circular cross section, Journal of
Scientific & Industrial Research, vol. 70, pp. 835-843
[7]. Y. Cengiz, B. Yasar and P. Dursun (1997) Heat transfer and pressure drops in a heat exchanger with a