DOI: 10.15662/ijareeie.2014.0307055
Low Power LFM Pulse Compression RADAR
with Sidelobe suppression
M. Archana1, M. Gnana priya2
PG Student [DECS], Dept. of ECE, Gokula Krishna College of Engineering, Sullurpeta, Andhra Pradesh, India
Associate Professor & Head, Dept of ECE, Gokula Krishna College Of Engineering, Sullurpeta, Andhra Pradesh, India
ABSTRACT: One of the parameters of the pulsed RADAR that contributes range capability is the average power of the transmitter. The average power can be increased by increasing the peak power or transmitted pulse width or both. The complexity in the design of transmitter components to withstand high peak power is the most challenging task. On the other hand larger transmitted pulse width affects the RADAR capability to detect and track lower range targets. Maximum detection range of RADAR is increased by larger pulse width which in turn results in poor range resolution and poor range measurement accuracy. So narrow pulse width is preferred and therefore only the peak power of the transmitter should be increased. Pulse compression is a technique to enhance the average power of the RADAR without compromising range resolution and maximum detectable range. It is a process of transmitting a longer pulse and on receiving compressing it to a shorter pulse. The emphasis of LFM (Linear Frequency Modulation) pulse compression method combines both the benefits of long duration and short duration pulses to enhance range and range resolution of RADAR without increasing the peak transmit power. But the pulse compression of LFM signal with matched filter introduces sidelobes which is objectionable in a way that they may mask smaller targets in vicinity. The solution to this problem is to introduce windowing technique to suppress the side lobes. A simulation was run to compare various windowing techniques (Hamming, Hanning, Blackman, Flattop, Bartlett) in LFM Signal for effective side lobe suppression in low power RADAR.
KEYWORDS: RADAR, Pulse compression, Range resolution, Peak Sidelobe level.
I. INTRODUCTION
Early fixed frequency pulsed RADAR compromised range and range resolution because of their need to meet both peak power level and pulse width respectively. To overcome this limitation pulse compression method is used. Pulse compression makes use of longer pulse width signal in the transmitter side and compressed pulse width signal in the receiver side to enhance range and range resolution of RADAR [3]. Shorter pulse width signal results in good range resolution but compromise range measurements in demanding more peak power to pack enough energy in the pulse. On the other hand longer pulse width signal requires low peak power output stage to maintain the energy of the pulse for good range measurement but it compromises resolution. Since the peak power transmitter design is complex and difficult the longer pulse width signal which requires low peak power output stage is preferred in the transmitting side than shorter pulse width signal but it has poor bandwidth so the longer pulse is linear frequency modulated for wider pulse interval. The transmitted wider pulse signal is compressed in the receiver side using matched filter. The matched filter implements a form of correlation in frequency domain to compress the pulse only when the echo signal matches the chirp pattern of the transmitted pulse. Pulse width compressed by this method is approximately equivalent to the reciprocal of the main spectrum width where the spectrum energy of the transmitting pulse is concentrated.
DOI: 10.15662/ijareeie.2014.0307055
Frequency Modulation) waveform on other side introduce no sidelobes but attained little acceptance because of its system complexity, limited development of NLFM generation devices and the necessity for a separate FM modulation design for each amplitude spectrum to achieve required sidelobe level[3]. The sidelobes introduced by LFM waveform can be reduced either by time domain or frequency domain weighting with the broadening of mainlobe. Time domain weighting is preferred than frequency domain weighting, because it produce lower sidelobe compression output.[6 7]. Windows are smoothing function that peak in the middle frequencies and decrease to zero at the edges. The choice of windowing function can play an important role in determining the quality of result.
Since FFT and IFFT play an important role in pulse compression spectral leakage is an integral part of it. Applying FFT to finite duration sequence results in spectral leakage due to the periodic extension assumption. In FFT analysis windows are applied to time domain data to reduce the spectral leakage associated with finite duration time signals. This article compares the behaviour of various windows to reduce sidelobes from LFM matched filtering output.
II. LITERATURE SURVEY
This section includes some of the discussions of journal papers on RADAR pulse compression techniques. Shinriki, et al., [8] have proposed a new pulse compression method for simple pulse. This method has a filter whose impulse response in frequency domain is the ratio between the desired waveform and input signal in frequency domain. The frequency characteristics of the desired waveform is chosen in such a way that it does not make the frequency characteristics of the impulse response to diverge and this method has the advantage of compressing to arbitrary pulse width given by the desired waveform and this method yields low peak sidelobe level.
Mudukutore, et al., [5] have proposed phase coded pulse compression technique to describe the signal returns accurately from the distributed weather targets and the procedure involves the improvement of previous works by considering the effect of target reshuffling during the propagation time of the pulse, which is important for long duration pulses. This paper compares the performance of various sidelobe suppression filters and inverse filters based on integrated sidelobe level and Doppler sensitivity and retains the accuracy of parameters in pulse Doppler radar and suppress the sidelobes to an acceptable level through suppression filters.
Varshney, et al., [2] studied various sidelobe suppression method introduced by LFM waveform. Sidelobe suppression methods discussed in this paper includes dual apodization, spatially variant apodization and leakage energy minimisation. This paper also investigates the comparative behaviour of LFM and NLFM waveform with low pulse compression ratio. Sahoo, et al., [4] discussed LFM sidelobe suppression using convolutional window in time domain to produce lower sidelobe compression output.
III. LINEAR FREQUENCY MODULATION MATCHED FILTERING
Most of the practical RADAR systems use LFM signals to track the target. The linear frequency chirp is easier to generate and its compressed pulse shape and SNR are fairly insensitive to Doppler shifts.
DOI: 10.15662/ijareeie.2014.0307055
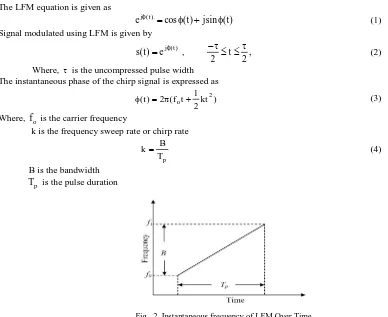
The LFM equation is given as
) t ( sin j ) t ( cos
ej(t) (1)
Signal modulated using LFM is given by
s(t)ej(t) , , 2 t 2 (2)
Where, is the uncompressed pulse width The instantaneous phase of the chirp signal is expressed as
) kt 2 1 t f ( 2 ) t
( o 2
(3)
Where, f is the carrier frequency o
k is the frequency sweep rate or chirp rate
p T
B
k (4)
B is the bandwidth T is the pulse durationp
Fig. 2 Instantaneous frequency of LFM Over Time
Resolution is a parameter to identify the closely spaced targets at larger distance. It depends upon the bandwidth of the signal and is given by
2B C 2 C.T
R p (5)
Where, C is speed of light R is the range resolution
In frequency domain the matched filter involves the multiplication of two frequency domain vectors with an application of complex conjugate to one of the vector. The impulse response of matched filter is given by
H()KS()ejt (6) Where K is the constant
tis the delay through the filter
S() is the complex conjugate of the spectrum of the input signal s(t).
The matched filter output for pulse compression in frequency domain is given by
DOI: 10.15662/ijareeie.2014.0307055
G()KS()ejtS() (8)
Assuming S(ω) is equal to the reference pulse spectrum.
Fig.3 Frequency domain matched filtering
III. WINDOWING
The basic building block of pulse compression matched filtering is FFT. The FFT computation assumes that the signal is periodic or repeats itself for each block of data. Whereas this is not the case for all type of signals. If the assumed signal is non-periodic, then the frequency spectrum of the signal results in leakage. Leakage causes the spectrum of the signal to smear out over a wide frequency range and is difficult to identify the exact frequency content of the measured signal. So window function is employed to correct for leakage. When a window function is multiplied to the non periodic signal it makes the signal to be periodic and suppress the sidelobes to a certain extent. The windowing could be applied either in time domain or frequency domain. The window functions compared in this paper are listed below.
(1) Hamming window
) / 2 cos( 46 . 0 54 . 0 )
(n n N
W , 0 nN/2 (9) 0 elsewhere
(2) Hanning window
W(n)0.50.5cos(2n/N), 0 n N/2 (10)
0 elsewhere
(3) Blackman window
W(n)0.420.5cos(2n/N)0.08cos(4n/N), 0n N/2 (11)
0 elsewhere
(4) Flattop window
W(n)a0a1cos(2n/N)a2cos(4n/N)a3cos(6n/N)a4cos(8n/N) (12)
DOI: 10.15662/ijareeie.2014.0307055
(5) Bartlett window
1 2 , Nn n
W (13)
Where
2 N n 0
IV. SIMULATION RESULTS & DISCUSSIONS
For a compression ratio of 40 with 4 MHZ bandwidth the LFM matched filter output produces sinc like behaviour with the side lobes irregularly spaced. The side lobes with large amplitude next to the main lobe are known as peak sidelobe. The efficiency of the waveform can be proved by lower peak sidelobe level (PSL). The Peak sidelobe level is given by
amplitude Mainlobe
amplitude Sidelobe
Peak log * 20
PSL(dB) 10 (1)
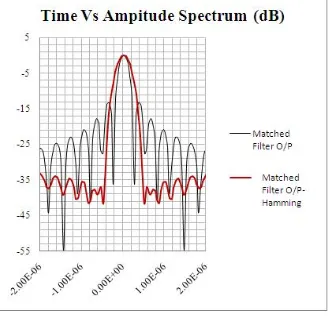
The PSL of the linear frequency matched filtering is -13.5 dB which is a high value. The window function is multiplied with the transmitted time domain signal and the result is compared with the transmitted signal output without window. The below figure illustrates the result with and without windowing. It’s evident from the figure that the windowed signal output yields lower PSL value.
Fig. 4 Matched filter output of LFM signal with hamming and without window
DOI: 10.15662/ijareeie.2014.0307055
Fig. 5 Matched filter output of LFM signal with hanning and without window
Fig. 6 Matched filter output of LFM signal with Blackman and without window
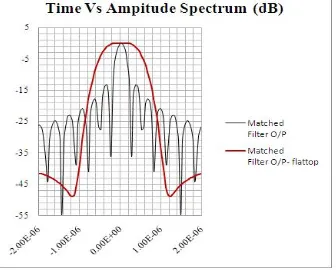
Fig 6 and Fig 7 illustrates the blackman and flattop window. The peak sidelobe level of blackman window and the flattop window from the figure is -50db and -42.5 db respectively. The mainlobe width of blackman window is approximately twice the width of rectangular window and the mainlobe width of flattop window is approximately five times the width of rectangular window.
The advantage and disadvantage of flattop window is its wider main lobe width. Because of its wider mainlobe width the accuracy of amplitude is good in flattop window which indeed results in poor resolution. The blackman window has wider mainlobe width next to flattop window than hanning, hamming and Bartlett window.
DOI: 10.15662/ijareeie.2014.0307055
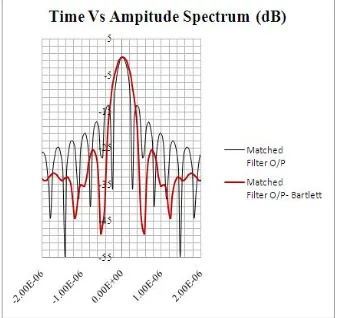
The PSL value of Bartlett window is -25.5 db and has the lower peak sidelobe level than any other window compared in this paper. The width of the Bartlett window is approximately 1.5 times the width of the rectangular window. The mainlobe width of the Bartlett window is less than that of hamming and hanning window and has good resolving capability. The loss occurred during processing the signal is less in Bartlett window. The Bartlett window is illustrated in below figure.
Fig. 8 Matched filter output of LFM signal with (Bartlett) and without window
The compressed pulse width of different windows and their pulse compression ratio is estimated in Table 1
Table 1 Different windows and their pulse compression ratio
Types Of Window
Compressed pulse width
(µS)
Pulse Compression
Ratio (dB)
Hamming 0.3231 14.91
Hanning 0.3518 14.54
Blackman 0.40929 13.88
flattop 0.92815 10.32
Bartlett 0.3162 15.00
The estimated parameters of windows from the above figure such as mainlobe width, processing loss, peak sidelobe level, compressed pulse width and resolution are produced in table 2.
Table 2 Different window parameters of LFM signal
Types Of Window
Mainlobe width (%)
Processing loss (dB)
Peak Side lobe Level
(dB)
Compressed pulse width
(µS)
Resolution (m)
Hamming 44.62 1.59 -39 0.3231 48.5
Hanning 57.40 1.96 -31.5 0.3518 52.8
Blackman 83.20 2.6 -50 0.40929 61.4
flattop 315.00 6.1 -42.5 0.92815 139.2
DOI: 10.15662/ijareeie.2014.0307055
Different applications require windows with different characteristics. Windows with low maximum sidelobe level is chosen for applications with strong interfering signals near the frequency of interest. If two signal components are near to each other then the window with high resolution (narrow mainlobe width) is chosen to identify the signal components. For good accuracy of amplitude measurement windows with wider main lobe is chosen. From the above parameter estimation of different windows, it’s evident that flattop window has good amplitude accuracy, so has poor resolution and the poor amplitude accuracy is observed in Bartlett window. Because of Flattop window’s poor resolution it’s harder for the window function to determine the frequency content of the signal exactly. Bartlett window has better resolution since it has narrow mainlobe width and has the ability to detect the signals with frequency content closely spaced. The hamming window has lower PSL than that of Hanning window but the distant sidelobes in hanning window is lower than that of hamming window. The Blackman window has wider mainlobe width next to Flattop window and has more sidelobe attenuation than hamming window and hanning window.
VI. CONCLUSION
This paper discuss about the LFM pulse compression method in frequency domain. The higher sidelobe level introduced by LFM Matched filtering (13.5db) is suppressed using different windows and the parameters such as peak sidelobe level, mainlobe width, compressed pulse width etc., of (Hamming, Hanning, Blackman, Flattop, Bartlett) those windows are calculated and the windows according to different applications are chosen to suppress the sidelobes effectively.
REFERENCES
[1] Vizitiu, Iulian-Constantin., Some Aspects of Sidelobe Reduction in Pulse Compression Radars Using NLFM Signal Processing. s.l. : Progress In Electromagnetics Research, 2014. pp. 119-129.
[2] Varshney, Lav R. and Thomas, Daniel., "Side lobe reduction for matched filter range processing." s.l. : IEEE Radar Conference, 2003. pp. 446- 451.
[3] Skolnik, Merill. I., Radar Handbook. New Delhi : Tata McGraw - Hill, 2008.
[4] Sahoo, Ajith Kumar and Panda, Ganapati., "Sidelobe reduction Of LFM signal using convolutional windows." [Online] Jan - 2011. [Cited: July 07, 2014.] http://dspace.nitrkl.ac.in/dspace/handle/2080/1351.
[5] Mudukutore, Ashok S., Chandrasekar, V. and Keeler, R. Jeffrey., "Pulse compression for weather radars." IEEE Transactions On Geoscience And Remot Sensing, 1998, Issue 1, Vol. 36, pp. 125-142.
[6] Kowatsch, M. and Stocker, H. R., "Effect Of Fresnl ripples on side lobe suppression in low time-bandwidth product linear FM pulse compression." 1982. IEEE Proc. Vol. 129, pp. 41-44.
[7] Griffiths, H. D., "Design Of low-sidelobe pulse comression waveforms." 1994. Electronics Letters. Vol. 30, pp. 1004-1005.
[8] Shinriki, M and Susaki, Hironori., "Pulse Compression for a simple pulse." s.l. : IEEE Transactions on Aerospace and Electronic Systems, 2008, Issue 4, Vol. 44.
BIOGRAPHY
M. Archana received her B.E degree in the field of Electronics and Communication Engineering from Anna University and currently pursuing her M.Tech in the field of Digital Electronics and Communication Systems at Gokula Krishna College of Engineering, JNTU Ananthapur, Andhrapradesh. Her areas of interest are Digital Signal Processing, Optical communication and Antennas and RADAR systems.