Overeducation and Overskilling:
Second Generation Australians
GEORGE MESSINIS
2008
George Messinis
Abstract
This study utilises HILDA data to evaluate the performance of second generation Australians in full-time employment over the period 2001-2005. Attention is paid to the effects and key drivers of overeducation and overskilling. Quantile regression is employed to account for non-random sample selection. The evidence provides several new insights: (a) Greek-Australians are overeducated; (b) Asian languages and Chinese or Vietnamese ancestry associate with a wage premium; (c) the returns to tertiary education, overeducation and overskilling very with ability; (d) parental occupational status is a key determinant of overeducation; and (e) lack of employer provision for new skills and personality traits are important drivers of overskilling.
* I have benefited from valuable comments provided by the editor, two anonymous referees, participants at the 2nd International Conference on Educational Economics, in Athens,
1. Introduction
Labour market integration of new immigrants in the new country of residence has been a key measure of success of immigration policy in OECD countries (Coppel et
al., 2001; House of Representatives, 2006). Recently, the economics literature has paid much attention to the second generation of immigrants (i.e., persons who have at least one parent born in another country). The question is whether second generations overcome the earnings disadvantage associated with their parents1 and
whether their socio-economic position converges to that of third generation of immigrants (i.e., persons with both parents born in the country of settlement).
It has now emerged that the second generation often achieves higher levels of education than the first generation in North America (Borjas, 1994). However, USA and Canadian evidence in Aydemir and Sweetman (2007) casts doubt about the prospects of a catch up with respect to the third generation. Furthermore, it appears that some groups of second-generation migrants may be more vulnerable to the intergenerational transmission of disadvantage. Borjas (2006), for example, is very pessimistic about the position of the second generation of Latinos in the USA while Hammarstedt and Palme (2006) show that pockets of second generation immigrants in Sweden have not been able to improve their status. Blackaby et al. (2005) are also pessimistic of the potential of British-born non-white ethnic minorities to escape the disadvantage faced by their parents. OECD (2007) raises similar concerns with respect to second generation immigrants in Denmark and Germany. In the latter country, women of the second generation seem particularly disadvantaged.
Amongst OECD countries, Australia rates favourably as a success story, according to OECD (2007).2 Second generation Australians have improved their socio-economic status when compared to their overseas-born parents (Khoo et al. 2002) but it is not clear whether the rewards gained through education match those of older-generation Australians.
1. Immigrants from non-English-speaking countries earn less than native-born workers with similar observable characteristics in the USA (Friedberg, 2000) and in Australia (Voon and Miller 2005).
Over the last decade, the economics profession has made significant progress in the evaluation of the impact of education in the labour market. Advances in economic theory and empirical measurement have allowed economists to make a direct link between education and wages. This link is then exploited to provide an estimate of the dollar value of one extra year of education.3 Since Duncan and Hoffman (1981),
however, economists have paid attention to two important facts. First, different jobs or occupations require different levels of education. Second, there is the phenomenon of job-skill mismatch whereby some people hold fewer qualifications than are required for a particular job while others may have acquired skills and knowledge that are in excess of what is necessary for the job. The former is known as ‘undereducation’ and the latter as ‘overeducation’ or ‘overqualification’. First generation migrants tend to be over-represented amongst the overeducated in Australia and Denmark (OECD 2007; Green et al. 2007; Nielsen 2007). In terms of earnings, the international evidence overwhelmingly shows that overqualified workers receive markedly lower returns (i.e., wages per year of education) for additional years of education than workers who have attained the same level of education but work in a job that requires that extra education. Conversely, the undereducated are found to earn substantially higher yearly returns than workers with the same but just-the-right qualifications for the job.4 Thus, this new literature suggests that more education per
se does not guarantee a better job or better pay. In fact, a person who has completed secondary education may be better paid than someone with tertiary education if the former is undereducated and the latter is overeducated.
Previous studies have also highlighted the role of language as an important determinant of labour market performance. The main emphasis here has been on ‘language capital’ in the country of destination; i.e., official language proficiency is seen to be useful for employment and the application of general and technical knowledge (OECD, 2007; Borjas, 1994). The importance of language in Borjas (1994) has been confirmed by Berman et al. (2000) and Chriswick and Miller (2007). This result also stands in non-English-speaking countries such as France (Meng and Meurs 2006) or Israel (Berman et al. 2000). Voon and Miller (2005) also find an
3. Note, however, standard estimates of returns to education using labour earnings are likely to underestimate the benefits of education. A more comprehensive assessment of the value of education would also include non-monetary benefits such as mental health and enjoyment (Ehrenberg and Smith 2006).
earnings gap between native-born Australians and overseas-born immigrants from non-English-speaking background (NESOB).
However, when proficiency in the national language of the new place of residence is combined with a second language, second-generation immigrants may be able to outperform their native co-workers. This may be due to a foreign language effect that enables people to: (a) exploit trade advantages (Melitz 2002); (b) access new ideas that are important for business innovation or technological catch-up (Javorcik et al. 2006; Niebuhr 2006; Mokyr 1999); (c) access tacit knowledge or ‘social capital’ (Giorgas 2000); or (d) build complementary skills and human capital (Galasi 2003; Chriswick and Miller 2002).
However, a less optimistic view of the role of ‘ethnic capital’ emerges in the literature of ‘ethnic enclaves’.5 Here, research points to employment and poverty traps that
await new migrants who rely on ‘ethnic employment’ due to low language skills or a ‘taste for isolation’ or even ‘oppositional identities’ (Shippler 2005; Blackaby et al. 2005; Borjas 1999). Warman (2007) and Hayfron (2002) argue and show that women suffer most from ethnic enclaves. Australian evidence by Cobb-Clark and Connolly (2001) also indicates that immigrant women may work in jobs with a few promotion or training prospects. They attribute this to what they call the ‘family-investment’ model of decision making. According to this model, immigrant wives sacrifice their educational development in order to support their husbands’ investment in education and skills. An alternative interpretation of the disadvantage facing immigrant women relies on cultural factors or ideology that restricts women in housework and discourages labour market participation and skill development.6
This paper utilises the empirical methodology proposed by Hartog (2000) and applied by Voon and Miller (2005) in Australia. This allows us to estimate the dollar value of education for men and women as well as that of second generation Greek-Australians, Italian-Australians and Indigenous Australians. Further, we examine whether the use of another language other than English (LOTE) impacts on earnings of Australian workers. The paper is organised as follows. Section two outlines the empirical methodology adopted in this study. Section three presents the empirical results. Finally, section four concludes.
5. See Warman (2007) for a review.
2. Methodology
This empirical study has two key objectives. First, it examines whether the cultural and linguistic diversity (CALD) associated with second generation Australians plays an important role in the determination of wages. Ancestry and languages other than English (LOTE) are key ingredients of CALD. As in existing literature, the econometric methodology relies on an extended Mincer equation that also accounts for job-skill mismatch. One approach is that of Voon and Miller (2005) who partition actual years of education, SA, into required years of education, SR (i.e., the average
of years of actual education by occupation), years of overeducation, SO,beingequal
to (SA-SR) if SA > SR and zero otherwise, and years of undereducation, SU, being
equal to (SR-SA) if SA < SR and zero otherwise. In particular, Voon and Miller (2005)
estimate the following model:
2 j
, , , i
1
ln i R i U i O i jE X i
j
W
α
Sβ
Sγ
Sμ
ϕ η
=
= + + +
∑
+ + (1)where lnWi is the log of average weekly earnings for worker i, SR,i , SO,i , SU,i stand for
required education, overeducation and undereducation respectively, the fourth term is a quadratic term for work experience, Ej, n is usually set equal to two, Xi is a vector
of other covariates, α, β, γ, μ, φ are parameters and ηi is a random error term.
Australian and international evidence shows that α>0, β<0, γ>0, -β<α and γ<α. In other words, a worker with the same level of education as the average worker in
same occupation should received a positive return per year of education (i.e., α>0). An undereducated worker with one year less education than what is required for the job is likely to receive a higher return than a worker in the same who has exactly the right level of education. Thus, the undereducated escape from α less income per
In contrast, the worker who has undertaken sixteen years of education and works in a job that typically requires qualifications that can be obtained with fifteen years of
education is considered to be overeducated. This worker will receive a return of α for
her fifteen years of education and only a return equal to γ for her sixteenth year which
is much lower than α. Thus, the more one studies in excess of what is required on the job, the higher the wage penalty. Put differently, the more overeducated one is the lower the return received for extra education. Research, so far, has struggled to explain this phenomenon and has suggested a number of causes: (a) employers are slow to introduce new technology that can match the overqualified persons’ superior skills; (b) overeducated workers may lack skills or experience that are important at the workplace, and (c) they may choose to work in jobs that do not demand high skills or effort due to family reasons or lifestyle.7
An alternative approach is in Mavromaras et al. (2007) who take a more agnostic approach to the measurement of mismatch and concentrate on levels rather than years of education, for levels of education more precisely capture qualitative aspects of education. For instance, the skills acquired at tertiary education are likely to vary significantly from those associated with vocational education and training (VET). Also, the authors propose an alternative approach to the measurement of job-skill mismatch that emphasises the gap between skills acquired by the worker and skills required on the job. HILDA provides data on the degree of use of acquired skills at work that the above study has used to study the incidence of overskilling. They derive the HILDA measure of overskilling from self-recorded responses scored on a seven point scale to the statement ‘I use many of my skills and abilities in my current job’. A response of 1 translates into ‘strongly disagree’ and 7 to ‘strongly agree’. The authors classify workers who select 1, 2 or 3, whom they as ‘severely overskilled’, those who select 4 and 5 as ‘moderately overskilled’ and the rest as ‘well matched’. The above authors argue that this variable represents a more direct measure of mismatch. Noter, however, like ‘overeducation’, the measures of overskilling are also imperfect since they rely on subjective self-assessments of ‘skills and abilities’ and assume that these assessments are comparable across occupations and individuals.
In this study, we extend the approach of Mavromaras et al. (2007) to re-examine the labour market performance of full-time workers when we control for CALD effects. As per convention, we take the natural log of weekly earnings in the main job to be the explained variable. For explanatory variables, we also rely on existing literature and consider two continuous variables and twenty indicator variables where the latter take the value of one if the condition applies and zero if otherwise. Experience and experience squared and divided by 100 are the continuous variables. The binary indicator variables are the following: tertiary education; VET comprised of Certificates IV/V, diplomas and apprenticeships; year 12 completed; undereducation and overeducation using the threshold of 1.5 standard deviation from required education; severe and moderate overskilling as in Mavromaras et al. (2007); ten years or more tenure with the current employer; membership with a ‘trade union or employee association’; married or in a de facto relationship, public sector employment, being born overseas in an English-speaking country or a non-English-speaking country; speaking a European or an Asian language as a LOTE; and Greek, Italian, Chinese or Vietnamese ancestry.8 Note that the first seven indicator variables substitute for
the first three terms in (1); that is, the three levels of education replace ‘required education’ and the other four indicator variables capture various forms of job-skill mismatch. Thus, we examine the following model:
4 2
j i
1 1
ln i i i 12i jMk jE X i
k j
W
α
Tβ
VETγ
Yφ
μ
ϕ η
= =
= + + +
∑
+∑
+ + (2)where T stands for tertiary education, VET is vocational education and training, Y12 is completion of year 12, and M1,…,M4 are the four measures of mismatch described
above.
Econometric estimation of equation (2) is not trivial since it is feasible that certain groups of workers may self select to participate in full-time employment. This non-random selection introduces a misspecification bias in OLS estimation. The empirical literature has dealt with this potential problem using three alternative strategies. First is Heckman’s (1979) two-step or maximum likelihood approach that attempt to specify explicitly a selection equation that describes the decision to participate or not
in employment. There are two major issues in this approach. One is that it is difficult to identify a set of variables that purely relate to the selection decision and do not impact on the wage equation. Also, maximum likelihood relies on the questionable assumption of a bivariate normal distribution.9
An alternative approach builds on the fact that participation in employment and the value of education are both driven by the unobservable latent factor of ability. One way of controlling for this omitted variable is to exploit the distribution of wages and estimate quantile regressions. The idea is that by restricting the analysis to a particular quantile, the effect of the misspecification is minimised since ability is likely to be homogeneous within a quantile band10 Thus, instead of striving for an explicit
structural relation for the participation-ability-education nexus, this approach reduces the problem to one of a wage equation for each quantile. Following Buchinsky (1994), the quantile regression (QR) model can be expressed as follows:
(
)
ln
W
i=
Q
θln
W
i|
x
i+
u
θi=
x
i iβ
+
u
θi (3)where Qθ(•) is the conditional quantile of lnWi (i.e., conditional on a vector of
covariates, xi) for quantile θ where θ є (0, 1). Assuming integrability, the linear QR
vector solves the minimisation problem:
(
)
( ): arg min
ln
d i i i
R
EQ
θ θW
x
ββ θ
ρ
β
∈
⎡
⎤
=
⎣
−
⎦
(4)where ρθ =(θ – 1(ε≤0))ε and d is the dimension of the explanatory variable vector, xi.
A third but recent development is the copula approach that relaxes the assumption of normally distributed marginal distributions and offers a variety of possible non-Gaussian joint distributions. This approach has been used widely in finance and only very recently has been applied to sample selection problems.11 Yet, this approach
has its own limitations for it is not trivial to select the appropriate copula, given the
9. For a comprehensive survey, see Vella (1998).
10. See for example Buchinsky (1994) and Angrist, Chernozhukov and Fernandez-Val (2006). 11. Smith (2003) and Genius and Strazzera (2008) apply bivariate copulae while Zimmer and
vast amount of possible solutions and uncertainty about the marginal distributions (Michiels and De Schepper 2007; Trivedi and Zimmer 2005). Hence, we follow Angrist, Chernozhukov and Fernandez-Val (2006) and adopt the QR approach.
Data
We employ the new Household, Income and Labour Dynamics in Australia (HILDA) data which is a household-based panel conducted since 2001. We use Release 5.1 that combines waves 1-5 (i.e., first 5 years). HILDA is an exhaustive source of information of around twelve thousand individuals per year. Each year, the survey introduces new persons and households while some previous participants cease to participate due to a variety of ‘attrition’ factors. It is an Australia-wide survey with a large longitudinal component (i.e., it follows the same persons every year). Overall, the vast majority of participants remain in the survey for some time. For example, 70.2% of respondents in wave 1 also took part in wave 5. We analyse here the total unbalanced panel (i.e., all full-time workers observed in all five years)
3. Results
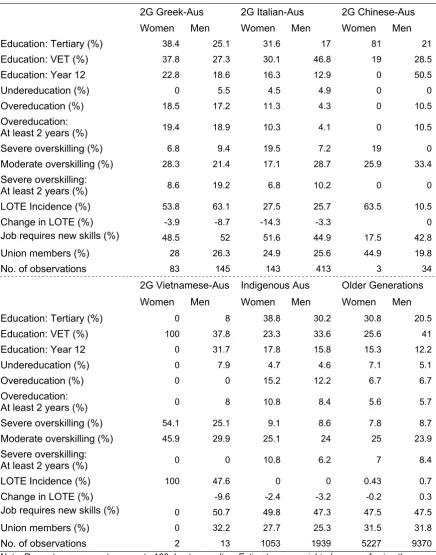
Table 1 summarises the profile of six groups of Australians in full-time employment: (1) second-generation Greek Australians; (2) second-generation Italian-Australians; (3) second-generation Chinese-Australians; (4) second-generation Vietnamese-Australians; (5) indigenous people; and (6) persons born in Australia with both parents born in Australia (i.e., third-generation Australians). We focus on indicators that relate to education and skills.12
Table 1 shows that indigenous and Greek-Australian women have the highest levels of tertiary education attainment.1314 A similar pattern is observed amongst males. Not
surprisingly, 46.8% of Italian-Australian males have completed a VET course. Note, however, that the high incidence of tertiary education for Greek-Australians becomes
12. These are weighted means using the re-scaled cross-section weights (enumerated). 13. The latter is consistent with the evidence in Khoo et al. (2002). Note, hereafter, the terms
‘Greek-Australians’ or ‘Italian-Australians’ refer to the second-generation.
problematic given that the same group also exhibits a very high incidence of overeducation; 18.5% of women and 17.2% of males. These figures compare with the 6.7% estimate for both women and men of third generation. To a lesser degree, there is a similar pattern for indigenous persons. More concerning, however, is the strong persistence in overeducation amongst Greek-Australian men and women. Excluding waves 4-5, we find that about 19% of all Greek-Australian full-time workers who were present in wave 1 remained overeducated for at least two years. In contrast, the corresponding figure for the third generation is about 5.5%. Indigenous workers and Chinese-Australian males also exhibit strong persistence in the incidence of overeducation.
When we examine the incidence of overskilling, it is Italian-Australian women that are overrepresented amongst the severely overskilled with an incidence rate of 19.5% that is more than double that observed in other groups. Note, however, that only 6.8% of Italian-Australian women remain severely overskilled for more than a year but a substantial proportion of Greek-Australian men (19.2%) do so.
Next, we consider HILDA data regarding other skills that may be relevant at work. First, we utilise information on the opportunity to learn new skills on the job. HILDA records responses to the statement ‘My job often requires me to learn new skills’. Responses are scored on a seven point scale ranging from 1 being ‘strongly disagree’ and 7 being ‘strongly agree’. This original variable is used latter in probit analysis but here we construct an indicator variable taking the value of one if the respondent selected answers 6 or 7 and zero if otherwise. This is the ‘Job requires new skills’ variable in Table 1. It shows that almost 50% of full-time workers have the opportunity to learn new skills in their current job. This tends to be the case in all the groups examined in Table 1.
Table 1. Second and older generations of full-time Australian workers: 2001-2005
2G Greek-Aus 2G Italian-Aus 2G Chinese-Aus
Women Men Women Men Women Men
Education: Tertiary (%) 38.4 25.1 31.6 17 81 21
Education: VET (%) 37.8 27.3 30.1 46.8 19 28.5
Education: Year 12 22.8 18.6 16.3 12.9 0 50.5
Undereducation (%) 0 5.5 4.5 4.9 0 0
Overeducation (%) 18.5 17.2 11.3 4.3 0 10.5
Overeducation:
At least 2 years (%) 19.4 18.9 10.3 4.1 0 10.5
Severe overskilling (%) 6.8 9.4 19.5 7.2 19 0
Moderate overskilling (%) 28.3 21.4 17.1 28.7 25.9 33.4
Severe overskilling:
At least 2 years (%) 8.6 19.2 6.8 10.2 0 0
LOTE Incidence (%) 53.8 63.1 27.5 25.7 63.5 10.5
Change in LOTE (%) -3.9 -8.7 -14.3 -3.3 0
Job requires new skills (%) 48.5 52 51.6 44.9 17.5 42.8
Union members (%) 28 26.3 24.9 25.6 44.9 19.8
No. of observations 83 145 143 413 3 34
2G Vietnamese-Aus Indigenous Aus Older Generations
Women Men Women Men Women Men
Education: Tertiary (%) 0 8 38.8 30.2 30.8 20.5
Education: VET (%) 100 37.8 23.3 33.6 25.6 41
Education: Year 12 0 31.7 17.8 15.8 15.3 12.2
Undereducation (%) 0 7.9 4.7 4.6 7.1 5.1
Overeducation (%) 0 0 15.2 12.2 6.7 6.7
Overeducation:
At least 2 years (%) 0 8 10.8 8.4 5.6 5.7
Severe overskilling (%) 54.1 25.1 9.1 8.6 7.8 8.7
Moderate overskilling (%) 45.9 29.9 25.1 24 25 23.9
Severe overskilling:
At least 2 years (%) 0 0 10.8 6.2 7 8.4
LOTE Incidence (%) 100 47.6 0 0 0.43 0.7
Change in LOTE (%) -9.6 -2.4 -3.2 -0.2 0.3
Job requires new skills (%) 0 50.7 49.8 47.3 47.5 47.5
Union members (%) 0 32.2 27.7 25.3 31.5 31.8
No. of observations 2 13 1053 1939 5227 9370
Note: Percentages may not sum up to 100 due to rounding. Estimates are weighted means of using the HILDA cross-section weights. Changes are calculated over the whole time period (2001-2005).
Undereducation and overeducation are defined on the basis of a 1.5 standard deviations threshold respectively. ‘Learning New skills’ is an indicator variable for answers 6 or 7 to the question: ‘Job requires learning new skills’.
It is possible that second generation Australians may undertake education in order to specialise on certain skills that give them an advantage at the labour market. Languages other than English (LOTE)15 may be one such set of skills that interest
second generation Australians. This conjecture seems true when we examine the incidence of LOTE amongst the six groups. Table 1 makes it clear that a very high proportion of Greek-Australian workers have invested in LOTE skills. Similar patterns are observed for Italian and Vietnamese-Australians. Yet again, the incidence of LOTE utilisation has declined over the period 2001-2005 for most groups.
Table 1 includes a summary on the incidence of LOTE. About half of the sample of persons of Greek background report using LOTE at home, particularly Greek-Australian men. The corresponding figure for 2G Italian-Greek-Australians is about half of that observed amongst 2G Greek-Australians. When, however, we look at changes in LOTE use from 2001 to 2005, we find that the proportion of employed Greek-Australians using LOTE declined by 9%, 19.5% and 13.4% for employed men, women not in employment and men not in employment respectively. Employed women stand out with an improvement of almost 10% increase. Although much lower, there are also substantial rates of language loss observed amongst Italian-Australians.
We also summarise two indicators of personality that are available in wave 5. The first derives from HILDA data on ‘Personality scale: Agreeableness’ while the second uses the HILDA variable ‘Personality scale: Emotional stability’. Both are composite indices derived by HILDA using specific personality indicators and take values from 1 to 7 where the higher the value the better the index describes the person. The first denotes the capacity to work in teams and be constructive on the job. It consists of reversed answers to questions pertaining to one’s ability to be sympathetic, kind, cooperative and warm. The second summarises emotional state of being and the capacity to be rational. It is consists of information relating to envy, mood, jealousy, temperament, and fretfulness. In this study, we reverse these two composite indices to obtain the following two variables: ‘Disagreeable’ and ‘Emotionally unstable’.
In Table 1, we use two binary constructions of the two personality indices to measure severe disagreement and severe emotional instability, both defined on the basis of answers 1 or 2 in the original HILDA variables. Table 1 shows that 21.6% of women and 27.8% of men in the third generation have a dissenting or quarrelling personality. Note also that Greek-Australians stand out as the most disagreeable. A similar effect is observed with the second indicator: 49.2% of Greek women and 37.5% of Greek men self-report as being emotionally unstable, as compared to 27.9% of women, 31.8% of men in the third generation, 33.9% of Italian-Australian men and 42,8% of Vietnamese-Australian men.16
The above results suggest that Greek-Australian women are affected most by the wage penalty associated with overeducation. However, Italian-Australian females in full-time employment also have experienced a wage penalty if ‘severe overskilling’ also associates with a wage penalty. The empirical results on overeducation and overskilling are important and contrast with the view that education is always advantageous as far as labour earnings are concerned. Perhaps, parental aspirations for high education achievements may have been a motivating factor behind this strong emphasis on formal education by the second generation of Greek-Australians (Holeva 2004). Alternatively, the high incidence of overeducation amongst Greek-Australians may be due to a skills deficit driven by a lack of interest or knowledge of applied sciences and technology often associated with developing countries (Tsoukalas 1976).
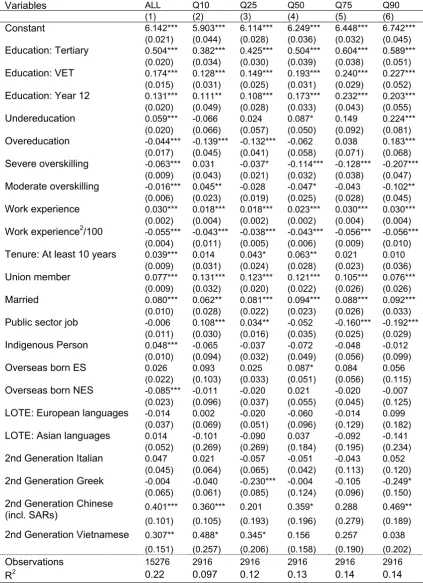
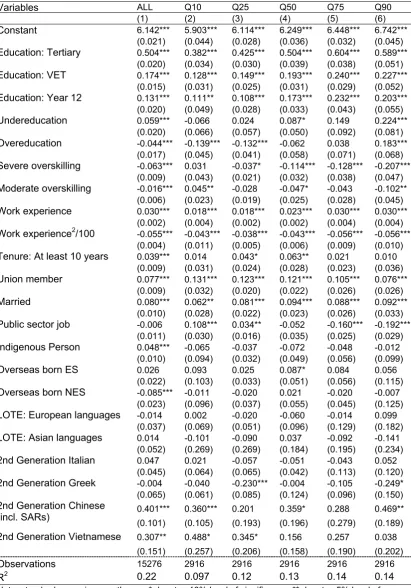
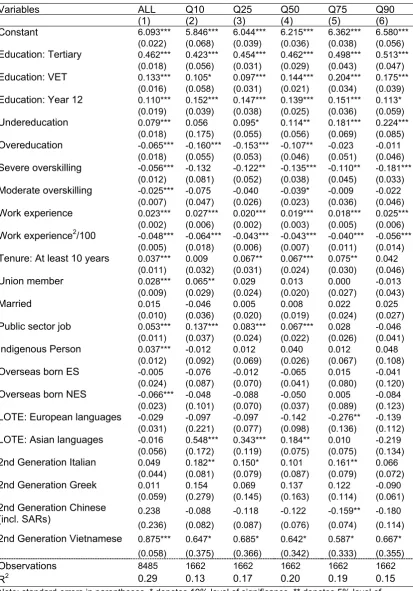
We proceed to estimate model (2). First, we apply panel data estimation techniques that control for random effects. The estimation results appear in column 1 of Table 2 for males and column 1 of Table 3 for females. In both cases, tertiary education seems to be the level of education with the highest return followed by VET and then Year 12. The returns to tertiary education between men and women seem similar but those of VET are higher for men than for women. Also, Tables 2 and 3 confirm previous evidence of a wage premium for undereducation and a wage penalty for overeducation and overskilling, especially for severe overskilling.
Table 2. Returns to Education, LOTE and Second-Generation Migrants: Full-time Workers, HILDA 2001-2005, Males
Variables ALL Q10 Q25 Q50 Q75 Q90
(1) (2) (3) (4) (5) (6) 6.142*** 5.903*** 6.114*** 6.249*** 6.448*** 6.742***
Constant
(0.021) (0.044) (0.028) (0.036) (0.032) (0.045) 0.504*** 0.382*** 0.425*** 0.504*** 0.604*** 0.589***
Education: Tertiary
(0.020) (0.034) (0.030) (0.039) (0.038) (0.051) 0.174*** 0.128*** 0.149*** 0.193*** 0.240*** 0.227***
Education: VET
(0.015) (0.031) (0.025) (0.031) (0.029) (0.052) 0.131*** 0.111** 0.108*** 0.173*** 0.232*** 0.203***
Education: Year 12
(0.020) (0.049) (0.028) (0.033) (0.043) (0.055)
0.059*** -0.066 0.024 0.087* 0.149 0.224***
Undereducation
(0.020) (0.066) (0.057) (0.050) (0.092) (0.081)
-0.044*** -0.139*** -0.132*** -0.062 0.038 0.183***
Overeducation
(0.017) (0.045) (0.041) (0.058) (0.071) (0.068)
-0.063*** 0.031 -0.037* -0.114*** -0.128*** -0.207***
Severe overskilling
(0.009) (0.043) (0.021) (0.032) (0.038) (0.047)
-0.016*** 0.045** -0.028 -0.047* -0.043 -0.102**
Moderate overskilling
(0.006) (0.023) (0.019) (0.025) (0.028) (0.045) 0.030*** 0.018*** 0.018*** 0.023*** 0.030*** 0.030***
Work experience
(0.002) (0.004) (0.002) (0.002) (0.004) (0.004) -0.055*** -0.043*** -0.038*** -0.043*** -0.056*** -0.056***
Work experience2/100
(0.004) (0.011) (0.005) (0.006) (0.009) (0.010)
0.039*** 0.014 0.043* 0.063** 0.021 0.010
Tenure: At least 10 years
(0.009) (0.031) (0.024) (0.028) (0.023) (0.036) 0.077*** 0.131*** 0.123*** 0.121*** 0.105*** 0.076***
Union member
(0.009) (0.032) (0.020) (0.022) (0.026) (0.026) 0.080*** 0.062** 0.081*** 0.094*** 0.088*** 0.092***
Married
(0.010) (0.028) (0.022) (0.023) (0.026) (0.033)
-0.006 0.108*** 0.034** -0.052 -0.160*** -0.192***
Public sector job
(0.011) (0.030) (0.016) (0.035) (0.025) (0.029) 0.048*** -0.065 -0.037 -0.072 -0.048 -0.012
Indigenous Person
(0.010) (0.094) (0.032) (0.049) (0.056) (0.099) 0.026 0.093 0.025 0.087* 0.084 0.056
Overseas born ES
(0.022) (0.103) (0.033) (0.051) (0.056) (0.115)
-0.085*** -0.011 -0.020 0.021 -0.020 -0.007
Overseas born NES
(0.023) (0.096) (0.037) (0.055) (0.045) (0.125) -0.014 0.002 -0.020 -0.060 -0.014 0.099
LOTE: European languages
(0.037) (0.069) (0.051) (0.096) (0.129) (0.182) 0.014 -0.101 -0.090 0.037 -0.092 -0.141
LOTE: Asian languages
(0.052) (0.269) (0.269) (0.184) (0.195) (0.234) 0.047 0.021 -0.057 -0.051 -0.043 0.052
2nd Generation Italian
(0.045) (0.064) (0.065) (0.042) (0.113) (0.120)
-0.004 -0.040 -0.230*** -0.004 -0.105 -0.249*
2nd Generation Greek
(0.065) (0.061) (0.085) (0.124) (0.096) (0.150)
0.401*** 0.360*** 0.201 0.359* 0.288 0.469**
2nd Generation Chinese
(incl. SARs) (0.101) (0.105) (0.193) (0.196) (0.279) (0.189)
0.307** 0.488* 0.345* 0.156 0.257 0.038
2nd Generation Vietnamese
(0.151) (0.257) (0.206) (0.158) (0.190) (0.202)
Observations 15276 2916 2916 2916 2916 2916
R2 0.22 0.097 0.12 0.13 0.14 0.14
Further, work experience and job tenure associate with statistically significant and positive returns of similar magnitude for both men and women. There is a marriage premium of 8% for men as in Voon and Miller (2005) but there is no effect in women. Further, the results confirm a union wage premium reported by Mavromaras at al. (2007). However, the public sector premium observed by Voon and Miller (2005) seems to be important only amongst women. In addition, indigenous men and women in full-time employment appear to earn a wage premium of 4.8% and 3.7% respectively. This seems surprising but summary statistics in Messinis (2009) indicate that indigenous persons have unusually low rates of labour market participation which suggests that the results so far may be biased as a result of sample selection. We investigate this possibility further below.
Tables 2 and 3 also confirm previous evidence of a wage penalty associated with first generation of Australians born overseas in a non-English-speaking country (NESOB). Also, in contrast to Voon and Miller (2005), we do not find any English-speaking effect for first generation Australians.
Table 3. Returns to Education, LOTE and Second-Generation Migrants: Full-time Workers, HILDA 2001-2005, Males
Variables ALL Q10 Q25 Q50 Q75 Q90
(1) (2) (3) (4) (5) (6) 6.142*** 5.903*** 6.114*** 6.249*** 6.448*** 6.742***
Constant
(0.021) (0.044) (0.028) (0.036) (0.032) (0.045) 0.504*** 0.382*** 0.425*** 0.504*** 0.604*** 0.589***
Education: Tertiary
(0.020) (0.034) (0.030) (0.039) (0.038) (0.051) 0.174*** 0.128*** 0.149*** 0.193*** 0.240*** 0.227***
Education: VET
(0.015) (0.031) (0.025) (0.031) (0.029) (0.052) 0.131*** 0.111** 0.108*** 0.173*** 0.232*** 0.203***
Education: Year 12
(0.020) (0.049) (0.028) (0.033) (0.043) (0.055)
0.059*** -0.066 0.024 0.087* 0.149 0.224***
Undereducation
(0.020) (0.066) (0.057) (0.050) (0.092) (0.081)
-0.044*** -0.139*** -0.132*** -0.062 0.038 0.183***
Overeducation
(0.017) (0.045) (0.041) (0.058) (0.071) (0.068)
-0.063*** 0.031 -0.037* -0.114*** -0.128*** -0.207***
Severe overskilling
(0.009) (0.043) (0.021) (0.032) (0.038) (0.047)
-0.016*** 0.045** -0.028 -0.047* -0.043 -0.102**
Moderate overskilling
(0.006) (0.023) (0.019) (0.025) (0.028) (0.045) 0.030*** 0.018*** 0.018*** 0.023*** 0.030*** 0.030***
Work experience
(0.002) (0.004) (0.002) (0.002) (0.004) (0.004) -0.055*** -0.043*** -0.038*** -0.043*** -0.056*** -0.056***
Work experience2/100
(0.004) (0.011) (0.005) (0.006) (0.009) (0.010)
0.039*** 0.014 0.043* 0.063** 0.021 0.010
Tenure: At least 10 years
(0.009) (0.031) (0.024) (0.028) (0.023) (0.036) 0.077*** 0.131*** 0.123*** 0.121*** 0.105*** 0.076***
Union member
(0.009) (0.032) (0.020) (0.022) (0.026) (0.026) 0.080*** 0.062** 0.081*** 0.094*** 0.088*** 0.092***
Married
(0.010) (0.028) (0.022) (0.023) (0.026) (0.033)
-0.006 0.108*** 0.034** -0.052 -0.160*** -0.192***
Public sector job
(0.011) (0.030) (0.016) (0.035) (0.025) (0.029) 0.048*** -0.065 -0.037 -0.072 -0.048 -0.012
Indigenous Person
(0.010) (0.094) (0.032) (0.049) (0.056) (0.099) 0.026 0.093 0.025 0.087* 0.084 0.056
Overseas born ES
(0.022) (0.103) (0.033) (0.051) (0.056) (0.115)
-0.085*** -0.011 -0.020 0.021 -0.020 -0.007
Overseas born NES
(0.023) (0.096) (0.037) (0.055) (0.045) (0.125) -0.014 0.002 -0.020 -0.060 -0.014 0.099
LOTE: European languages
(0.037) (0.069) (0.051) (0.096) (0.129) (0.182) 0.014 -0.101 -0.090 0.037 -0.092 -0.141
LOTE: Asian languages
(0.052) (0.269) (0.269) (0.184) (0.195) (0.234) 0.047 0.021 -0.057 -0.051 -0.043 0.052
2nd Generation Italian
(0.045) (0.064) (0.065) (0.042) (0.113) (0.120)
-0.004 -0.040 -0.230*** -0.004 -0.105 -0.249*
2nd Generation Greek
(0.065) (0.061) (0.085) (0.124) (0.096) (0.150)
0.401*** 0.360*** 0.201 0.359* 0.288 0.469**
2nd Generation Chinese
(incl. SARs) (0.101) (0.105) (0.193) (0.196) (0.279) (0.189)
0.307** 0.488* 0.345* 0.156 0.257 0.038
2nd Generation Vietnamese
(0.151) (0.257) (0.206) (0.158) (0.190) (0.202)
Observations 15276 2916 2916 2916 2916 2916
R2 0.22 0.097 0.12 0.13 0.14 0.14
Table 4. Returns to Education and Second-Generation Migrants: Full-time Workers, HILDA 2001-2005, Females
Variables ALL Q10 Q25 Q50 Q75 Q90
(1) (2) (3) (4) (5) (6)
6.093*** 5.846*** 6.044*** 6.215*** 6.362*** 6.580***
Constant
(0.022) (0.068) (0.039) (0.036) (0.038) (0.056) 0.462*** 0.423*** 0.454*** 0.462*** 0.498*** 0.513***
Education: Tertiary
(0.018) (0.056) (0.031) (0.029) (0.043) (0.047) 0.133*** 0.105* 0.097*** 0.144*** 0.204*** 0.175***
Education: VET
(0.016) (0.058) (0.031) (0.021) (0.034) (0.039) 0.110*** 0.152*** 0.147*** 0.139*** 0.151*** 0.113*
Education: Year 12
(0.019) (0.039) (0.038) (0.025) (0.036) (0.059)
0.079*** 0.056 0.095* 0.114** 0.181*** 0.224***
Undereducation
(0.018) (0.175) (0.055) (0.056) (0.069) (0.085)
-0.065*** -0.160*** -0.153*** -0.107** -0.023 -0.011
Overeducation
(0.018) (0.055) (0.053) (0.046) (0.051) (0.046)
-0.056*** -0.132 -0.122** -0.135*** -0.110** -0.181***
Severe overskilling
(0.012) (0.081) (0.052) (0.038) (0.045) (0.033)
-0.025*** -0.075 -0.040 -0.039* -0.009 -0.022
Moderate overskilling
(0.007) (0.047) (0.026) (0.023) (0.036) (0.046) 0.023*** 0.027*** 0.020*** 0.019*** 0.018*** 0.025***
Work experience
(0.002) (0.006) (0.002) (0.003) (0.005) (0.006) -0.048*** -0.064*** -0.043*** -0.043*** -0.040*** -0.056***
Work experience2/100
(0.005) (0.018) (0.006) (0.007) (0.011) (0.014)
0.037*** 0.009 0.067** 0.067*** 0.075** 0.042
Tenure: At least 10 years
(0.011) (0.032) (0.031) (0.024) (0.030) (0.046)
0.028*** 0.065** 0.029 0.013 0.000 -0.013
Union member
(0.009) (0.029) (0.024) (0.020) (0.027) (0.043) 0.015 -0.046 0.005 0.008 0.022 0.025
Married
(0.010) (0.036) (0.020) (0.019) (0.024) (0.027)
0.053*** 0.137*** 0.083*** 0.067*** 0.028 -0.046
Public sector job
(0.011) (0.037) (0.024) (0.022) (0.026) (0.041) 0.037*** -0.012 0.012 0.040 0.012 0.048
Indigenous Person
(0.012) (0.092) (0.069) (0.026) (0.067) (0.108) -0.005 -0.076 -0.012 -0.065 0.015 -0.041
Overseas born ES
(0.024) (0.087) (0.070) (0.041) (0.080) (0.120)
-0.066*** -0.048 -0.088 -0.050 0.005 -0.084
Overseas born NES
(0.023) (0.101) (0.070) (0.037) (0.089) (0.123)
-0.029 -0.097 -0.097 -0.142 -0.276** -0.139
LOTE: European languages
(0.031) (0.221) (0.077) (0.098) (0.136) (0.112)
-0.016 0.548*** 0.343*** 0.184** 0.010 -0.219
LOTE: Asian languages
(0.056) (0.172) (0.119) (0.075) (0.075) (0.134)
0.049 0.182** 0.150* 0.101 0.161** 0.066
2nd Generation Italian
(0.044) (0.081) (0.079) (0.087) (0.079) (0.072) 0.011 0.154 0.069 0.137 0.122 -0.090
2nd Generation Greek
(0.059) (0.279) (0.145) (0.163) (0.114) (0.061)
0.238 -0.088 -0.118 -0.122 -0.159** -0.180
2nd Generation Chinese
(incl. SARs) (0.236) (0.082) (0.087) (0.076) (0.074) (0.114)
0.875*** 0.647* 0.685* 0.642* 0.587* 0.667*
2nd Generation Vietnamese
(0.058) (0.375) (0.366) (0.342) (0.333) (0.355)
Observations 8485 1662 1662 1662 1662 1662
R2 0.29 0.13 0.17 0.20 0.19 0.15
Note: standard-errors in parentheses, * denotes 10% level of significance, ** denotes 5% level of significance and *** denotes 1% level of significance. Overall R2in (1) and pseudo R2 ins (2)-(6).
background. The evidence here also suggests that cultural and linguistic diversity yields positive private benefits to full-time workers. It seems, however, that the realisation of such benefits depends on other factors. We conjecture that the Asian languages and Asian ancestry effects relate to the increasing importance of Asia as a trading partner to Australia or to the rapid economic development witnessed in Asia in recent times.
In an attempt to minimise the potential bias of non-random sample selection, we proceed with quantile regressions, as in Angrist, Chernozhukov and Fernandez-Val (2006). Columns 2-6 in Tables 2 and 3 report the quantile regressions results for
θ=0.1, 0.25, 0.5, 0.75, and 0.9. These results are somewhat differences to those observed above. First, the returns to all three levels of education increase as we move up on the wage distribution. A similar pattern is observed for undereducation, experience and tenure. Importantly, the wage effects of NESOB and indigenous Australians effect reported earlier has now disappeared for both men and women. This latter finding suggests that the significant coefficient estimates for these two variables we observed above are the results of biased estimations due to sample selection. On the other hand, the quantile regression coefficient estimates now reveal that there is indeed a statistically significant LOTE effect for Asian languages amongst women. In addition, the positive wage effects of Chinese and Vietnamese ancestry are again confirmed.
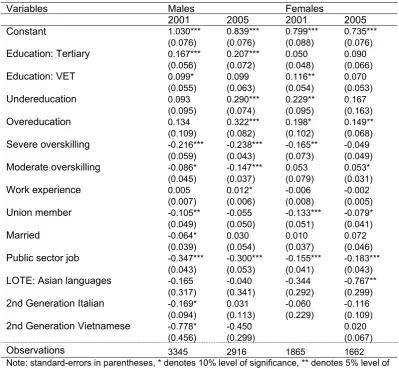
Table 4 takes quantile regression further to examine inter-quantile effects for 2001 and 2005. It presents results on the 0.9 – 0.1 inter-quantile differences but estimates of 0.75 – 0.25 inter-quantile differences are available upon request that show similar results as those in Table 4. The results here show that the returns to tertiary education for men were 16.7% higher in 2001 for the top 10th quantile than that of the
lowest 10th quantile. Moreover, this gap increased to 20.7% in 2005. In contrast,
there is no significant inter-quantile effect amongst women. With respect to the wage penalty associated with mismatch, we observe that the penalty is significantly higher for the top end of the distribution than the lower 10th quantile (i.e., the coefficient
estimates for both overeducation and severe overskilling are negative and significant at 5% and often 1% levels). As expected, the public sector premium is relatively less important for the top 10th quantile. Also intuitive is the finding that the premiums
Table 5. Labour Income Distribution: Interquantile Differences (90%-10%)
Variables Males Females
2001 2005 2001 2005
1.030*** 0.839*** 0.799*** 0.735***
Constant
(0.076) (0.076) (0.088) (0.076)
0.167*** 0.207*** 0.050 0.090
Education: Tertiary
(0.056) (0.072) (0.048) (0.066) 0.099* 0.099 0.116** 0.070
Education: VET
(0.055) (0.063) (0.054) (0.053)
0.093 0.290*** 0.229** 0.167
Undereducation
(0.095) (0.074) (0.095) (0.163)
0.134 0.322*** 0.198* 0.149**
Overeducation
(0.109) (0.082) (0.102) (0.068) -0.216*** -0.238*** -0.165** -0.049
Severe overskilling
(0.059) (0.043) (0.073) (0.049)
-0.086* -0.147*** 0.053 0.053*
Moderate overskilling
(0.045) (0.037) (0.079) (0.031) 0.005 0.012* -0.006 -0.002
Work experience
(0.007) (0.006) (0.008) (0.005) -0.105** -0.055 -0.133*** -0.079*
Union member
(0.049) (0.050) (0.051) (0.041) -0.064* 0.030 0.010 0.072
Married
(0.039) (0.054) (0.037) (0.046) -0.347*** -0.300*** -0.155*** -0.183***
Public sector job
(0.043) (0.053) (0.041) (0.043) -0.165 -0.040 -0.344 -0.767**
LOTE: Asian languages
(0.317) (0.341) (0.292) (0.299) -0.169* 0.031 -0.060 -0.116
2nd Generation Italian
(0.094) (0.113) (0.229) (0.109)
-0.778* -0.450 0.020
2nd Generation Vietnamese
(0.456) (0.299) (0.067)
Observations 3345 2916 1865 1662
Note: standard-errors in parentheses, * denotes 10% level of significance, ** denotes 5% level of significance and *** denotes 1% level of significance.
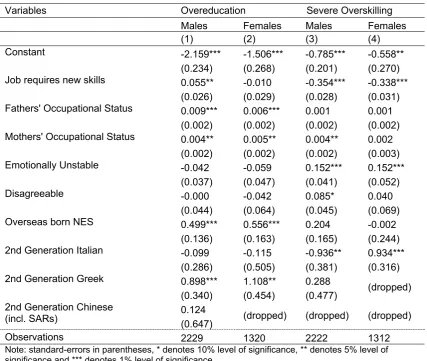
Next, we seek to expand our intuition on the key determinants of overeducation and overskilling. As explained variables, we again utilise the binary, indicator variables of overeducation (again defined on the basis of a 1.5 standard deviations above required education) and severe overskilling as defined above. We consider the following explanatory variables: (a) the original HILDA measure of ‘Job requires new skills’ ranging from 1 to 7; (b) father’s ANU4 occupational status scale; (c) mother’s ANU4 occupational status scale; (d) the two personality indices: ‘Emotionally Unstable’, and ‘Disagreeable’ (both ranging from 1 to 7); (e) non-English-speaking (NES) overseas born status; and (f) the indicator variables for Greek, Italian, Chinese and Vietnamese ancestry.
an overeducated full-time worker. Note that father’s occupational status is much more important for both males and females. Also, the overeducated tend to work in jobs that do require learning of new skills. This may be due to a unwillingness by the overeducated to learn new skills on the job. Surprisingly, being a NESOB worker increases the probability of being overeducated. Consistent with earlier indicators, the results confirm that second-generation workers of Greek background are more likely to be overeducated. There is no evidence of such an effect amongst other second generation groups.
Table 6. Overeducation and Overskilling: Full-time Workers, HILDA 2005, Probit
Variables Overeducation Severe Overskilling
Males Females Males Females
(1) (2) (3) (4)
-2.159*** -1.506*** -0.785*** -0.558** Constant
(0.234) (0.268) (0.201) (0.270)
0.055** -0.010 -0.354*** -0.338***
Job requires new skills
(0.026) (0.029) (0.028) (0.031)
0.009*** 0.006*** 0.001 0.001
Fathers' Occupational Status
(0.002) (0.002) (0.002) (0.002) 0.004** 0.005** 0.004** 0.002 Mothers' Occupational Status
(0.002) (0.002) (0.002) (0.003)
-0.042 -0.059 0.152*** 0.152***
Emotionally Unstable
(0.037) (0.047) (0.041) (0.052) -0.000 -0.042 0.085* 0.040 Disagreeable
(0.044) (0.064) (0.045) (0.069)
0.499*** 0.556*** 0.204 -0.002
Overseas born NES
(0.136) (0.163) (0.165) (0.244)
-0.099 -0.115 -0.936** 0.934***
2nd Generation Italian
(0.286) (0.505) (0.381) (0.316) 0.898*** 1.108** 0.288
2nd Generation Greek
(0.340) (0.454) (0.477) (dropped) 0.124
2nd Generation Chinese
(incl. SARs) (0.647) (dropped) (dropped) (dropped)
Observations 2229 1320 2222 1312
Note: standard-errors in parentheses, * denotes 10% level of significance, ** denotes 5% level of significance and *** denotes 1% level of significance.
ancestry are more likely to be severely overskilled. In contrast, males of Italian ancestry are less likely to be overskilled; this seems consistent with the fact that Italian males invest heavily in VET (see Table 1). More importantly, we find that personality plays an important role in the incidence of self-reporting of severe overskilling. In particular, both men and women who describe their personality to be ‘emotionally unstable’ are highly likely to be the same persons who report severe overskilling.
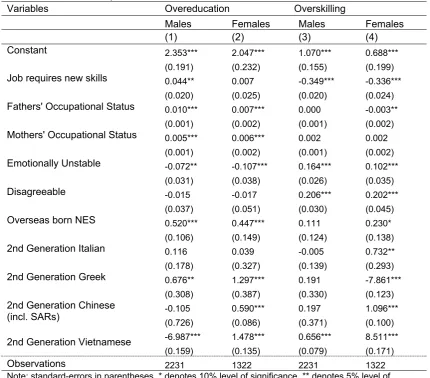
Next, we examine whether these findings are robust to using more information regarding overeducation and overskilling in HILDA. Thus, we extend the analysis to construct two new indicator variables for overeducation and overskilling. This time we set overeducation equal to one, two and three when observed years of acquired education is one, one and a half and two standard deviations greater than required education respectively, and equals zero otherwise. Likewise, we define overskilling to be equal to one when the person reports moderate overskilling, equal to two when severe overskilling is observed and equal to zero if otherwise.
These new variables are then treated as dependent variables in ordered Probit regressions. Table 6 presents the estimation results for 2005 but we can show that similar results can be obtained for other years. The results in Table 6 are similar to those in Table 5 and again confirm the importance of parental occupational status, NESOB background and Greek ancestry for overeducation. The results also confirm those in Table 5 with respect to overskilling. Lack of employer provision (as reported by the worker), females of Italian origin, and males of Vietnamese are more likely to be overskilled. Moreover, emotional instability and disagreeable personality are again associated with a higher probability of being overskilled.17
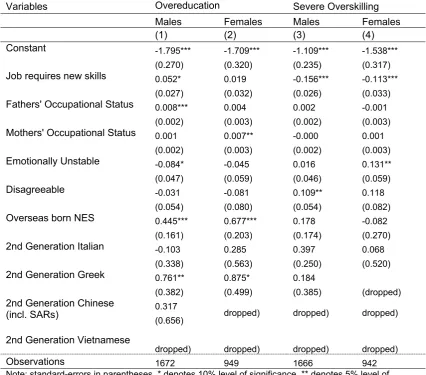
Finally, we extend the analysis further to consider persistence in overeducation and overskilling. In order to achieve this, we restrict the sample to full-time workers that were reporting in all of the first three waves in HILDA and define persistence in overeducation and overskilling as indicator variables that are assigned the value of one if the worker is observed to be overeducated (as defined in Tables 2-5) or severely overskilled for at least two years. Table 7 has the empirical results from robust Probit regressions for 2003. The evidence suggests that (females) males are
more likely to be overeducated for more than a year if their (mother’s) father’s occupational status is higher. Also, males who work in workplaces that require learning of new skills, first generation workers of NESOB background, and second generation Greek-Australians also are more likely to experience persistence in overeducation. These latter findings are puzzling and call for further future research.
Table 6. Overeducation and Overskilling: Full-time Workers, HILDA 2005, Ordered Probit
Variables Overeducation Overskilling
Males Females Males Females
(1) (2) (3) (4)
2.353*** 2.047*** 1.070*** 0.688***
Constant
(0.191) (0.232) (0.155) (0.199)
0.044** 0.007 -0.349*** -0.336***
Job requires new skills
(0.020) (0.025) (0.020) (0.024)
0.010*** 0.007*** 0.000 -0.003**
Fathers' Occupational Status
(0.001) (0.002) (0.001) (0.002)
0.005*** 0.006*** 0.002 0.002
Mothers' Occupational Status
(0.001) (0.002) (0.001) (0.002) -0.072** -0.107*** 0.164*** 0.102***
Emotionally Unstable
(0.031) (0.038) (0.026) (0.035)
-0.015 -0.017 0.206*** 0.202***
Disagreeable
(0.037) (0.051) (0.030) (0.045)
0.520*** 0.447*** 0.111 0.230*
Overseas born NES
(0.106) (0.149) (0.124) (0.138) 0.116 0.039 -0.005 0.732**
2nd Generation Italian
(0.178) (0.327) (0.139) (0.293) 0.676** 1.297*** 0.191 -7.861***
2nd Generation Greek
(0.308) (0.387) (0.330) (0.123)
-0.105 0.590*** 0.197 1.096***
2nd Generation Chinese
(incl. SARs) (0.726) (0.086) (0.371) (0.100)
-6.987*** 1.478*** 0.656*** 8.511***
2nd Generation Vietnamese
(0.159) (0.135) (0.079) (0.171)
Observations 2231 1322 2231 1322
Table 7. Persistence in Overeducation and Severe Overskilling: Full-time Workers, HILDA 2003, Probit
Variables Overeducation
O d i Severe Overskilling
Males Females Males Females
(1) (2) (3) (4)
-1.795*** -1.709*** -1.109*** -1.538***
Constant
(0.270) (0.320) (0.235) (0.317)
0.052* 0.019 -0.156*** -0.113***
Job requires new skills
(0.027) (0.032) (0.026) (0.033)
0.008*** 0.004 0.002 -0.001
Fathers' Occupational Status
(0.002) (0.003) (0.002) (0.003)
0.001 0.007** -0.000 0.001
Mothers' Occupational Status
(0.002) (0.003) (0.002) (0.003) -0.084* -0.045 0.016 0.131**
Emotionally Unstable
(0.047) (0.059) (0.046) (0.059) -0.031 -0.081 0.109** 0.118
Disagreeable
(0.054) (0.080) (0.054) (0.082)
0.445*** 0.677*** 0.178 -0.082
Overseas born NES
(0.161) (0.203) (0.174) (0.270) -0.103 0.285 0.397 0.068
2nd Generation Italian
(0.338) (0.563) (0.250) (0.520) 0.761** 0.875* 0.184
2nd Generation Greek
(0.382) (0.499) (0.385) (dropped) 0.317
2nd Generation Chinese
(incl. SARs) (0.656) dropped) dropped) dropped)
2nd Generation Vietnamese
dropped) dropped) dropped) dropped)
Observations 1672 949 1666 942
Note: standard-errors in parentheses, * denotes 10% level of significance, ** denotes 5% level of significance and *** denotes 1% level of significance. Overeducation is defined as in Tables 2-5.
Columns 3-4 in Table 7 also suggest that lack of opportunities for new skills at work, emotional instability for females and a disagreeable personality for males are key drivers of persistence in severe overskilling.
4. Conclusion
This paper utilised HILDA data to revisit the debate on overeducation, overskilling in order to examine the effect of cultural and linguistic diversity (CALD) on labour market performance of second-generation Australians. This paper also examines the incidence of overeducation and overskilling amongst second generation Australians in full-time employment. The question of immigrant settlement and the role linguistic diversity plays in the labour market are of strategic importance in public policy in Australia and the developed world confronted with waves of immigration. Previous research has praised the Australian experience as a highly successful experiment and noted that many of the disadvantages faced by first-generation immigrants of diverse linguistic and cultural background have been overcome by the second generation.
The empirical evidence here suggests that overeducated and overskilled workers are penalised in the labour market. Second generation Australians from a non-English background have overcome the disadvantage associated with the first generation NESOB. More importantly, LOTE skills and ancestry appear to have been beneficial to second generation workers of Asian background. On the other hand, second generation full-time workers of Greek-Australian background are overrepresented amongst the overeducated and are more likely to experience persistence in overeducation. Overeducation is also associated with parental occupation status.
References
Angrist, J., Chernozhukov, V. and Fernandez-Val, I. (2006), ‘Quantile regression under misspecification, with an application to the U.S. wage structure’, Econometrica, 74 (2),
539-563.
Aydemir A. and Sweetman A. (2007) ‘First and second generation immigrant educational attainment and labor market outcomes: A comparison of the United States and Canada’, IZA Discussion Paper 2298.
Berman, E., Lang, K. and Siniver, E. (2000) ‘Language-skill complementarity: returns to immigrant language acquisition’, National Bureau of Economic Research, NBER Working Paper 7737.
Blackaby, D.H., Leslie, D.G., Murphy, P.D. and O’Leary, N.C. (2005) ‘Born in Britain: how are native ethnic minorities faring in the British labour market?’, Economics Letters, 88, (3),
370-375.
Borjas, G.I. (2006) ‘Making it in America: social mobility in the immigration population’, NBER Working Paper 12088.
Borjas, G.I. (1999) Heaven’s door: immigration policy and the American economy, Princeton:
Princeton University Press.
Borjas, G.I. (1994) ‘The economics of immigration’, Journal of Economic Literature, 32, (4),
1667-1717.
Breton, A. (1998) ‘An economic analysis of language’, In Economic approaches to language and bilingualism, ed. Breton, A., Department of Canadian Heritage.
Buchinsky, M. (1994) ‘Changes in the US wage structure 1963-1987: an application of quantile regression’, Econometrica,62 (2): 405-458.
Callan, V.J. and Gallois, C. (1982) ‘Language attitudes of Italo-Australian and Greek-Australian bilinguals’, International Journal of Psychology, 17, (1-4), 345-358.
Chorney, H. (1998) ‘Bilingualism in employee recruitment and the role of symbolic analysts in leading export-oriented firms’, In Economic approaches to language and bilingualism, ed.
Breton, A., Department of Canadian Heritage.
Chriswick B.R. and Miller, P. (2007) ‘Occupational language requirements and the value of English in the U.S. labor market’, Institute for the Study of Labor (IZA) Discussion Paper 2664.
Chriswick B.R. and Miller, P. (2002) ‘The complementarity of language and other human capital: immigrant earnings in Canada’, IZA Discussion Paper 451.
Cobb-Clark D.A. and Connolly M.D. (2001) ‘Wives and mothers: the labour-market experiences of immigrant women’, in Earnings inequality in Australia, ed. Borland, J.
Coppel, J., Dumont, J. and Visco, I. (2001) ‘Trends in immigration and economic consequences’, Economics Department, Organisation for Economic Co-operation and Development (OECD), Working Paper 284.
Duncan, G.J. and Hoffman, S.D. (1981) ‘The incidence and wage effects of overeducation’,
Economics of Education Review 1, (1), 75-86.
Ehrenberg, R.G. and R.S. Smith, R.S. (2006) Modern labor economics: theory and public policy, 9th edition, Boston: Pearson.
Folbre, N. and J.A. Nelson, J.A. (2000) ‘For love or money - or both?’, Journal of Economic Perspectives, 14, (4), 123-140.
Friedberg, R.M. (2000) ‘You can’t take it with you? immigrant assimilation and the portability of human capital’, Journal of Labor Economics, 18, (2), 221-251.
Galasi, P. (2003) ‘Estimating wage equations for Hungarian higher-education graduates’, Budapest Working Papers on the Labour Market, Institute of Economics, Hungarian Academy of Sciences, Working Paper 2003/4, Budapest.
Genius, M. and Strazzera, E. (2008) ‘Applying the copula approach to sample selection modelling’, Applied Economics, 40, 1443-1455.
Giorgas, D. (2000) ‘Social capital within ethnic communities’, Sociological Sites/Sights, TASA Conference, Flinders University, Adelaide.
Green, C., Kler, P. and Leeves, G. (2007) ‘Immigrant overeducation: evidence from recent arrivals to Australia’, Economics of Education Review, 26, (4), 420-432.
Hartog, J. (2000) ‘Overeducation and earnings: where are we, where should we go?’,
Economics of Education Review, 19, (2), 131-147.
Hammarstedt, M. and Palme, M. (2006) ‘Intergenerational mobility, human capital transmission and the earnings of second-generation immigrants in Sweden’, IZA Discussion Paper 1943.
Hayfron, J.E. (2002) ‘Panel estimates of the earnings gap in Norway: do female immigrants experience a double earnings penalty?’, Applied Economics, 34, (11), 1441-1152.
Heckman, J. (1979) ’Sample selection bias as a specification error’, Econometrica, 47,
153-61.
Holeva, P. (2004) ‘Current trends of the linguistic and cultural values of the Greek Australian community in South Australia’, International Education Journal, 4, (4), 212-225.
House of Representatives, (2006) Balancing work and family, Standing Committee on Family
and Human Services, Commonwealth of Australia, Canberra.
Javorcik, B.S., Ozden, C., Spatareanu, M. and Neagu, C. (2006) ‘Migrant networks and foreign direct investment’, World Bank Policy Research Working Paper 4046.
Le, A.T. and Miller, P. (2002) ‘Educational attainment in Australia: a cohort analysis. Longitudinal survey of Australian youth research report no. 25’, Australian Council of Educational Research, Camberwell.
Mavromaras, K., McGuinness, S., O’Leary, N., Sloane, P. and Fok, Y.K. (2007) ‘The problem of overskilling in Australia and Britain’, IZA Discussion Paper No. 3136.
McDonald, P. (2000) ‘Gender equity, social institutions and the future of fertility’, Journal of Population Research, 17, (1), 1-16.
Melitz, J. (2002) ‘Language and foreign trade’, Centre for Economic Policy Research, CEPR, Discussion Paper 3590.
Meng, X. and Meurs, D. (2006) ‘Intermarriage, language, and economic assimilation process: a case study of France’, IZA Discussion Paper 2461.
Messinis, G. (2009), ‘Overeducation and overskilling in Australia: second generation Greek-Australians and Italian-Greek-Australians’, 7th International Conference on Greek Research, Conference Proceedings, forthcoming.
Messinis, G. and Olekalns, N. (2008), ‘Returns to training and skill mismatch: evidence from Australia’, Centre for Strategic Economic Studies, Victoria University, Working Paper 40. Michiels, F. and De Schepper, A. (2007), ‘A copula test space model: How to avoid the wrong
copula choice’, Faculty of Applied Economics, University of Antwerp, research paper 027. Miller, P. (2007) ‘Overeducation and undereducation in Australia’, Australian Economic
Review,.40, (3), 292-299.
Mokyr, J. (1999) ‘Invention and rebellion: why do innovations occur at all? an evolutionary approach’. In Elites, minorities and economic growth, ed. Brezis, E.S. and Temin, P., Amsterdam: North-Holland.
Niebuhr, A. (2006) ‘Migration and innovation: does cultural diversity matter for regional R&D activity?’, Institute for Employment Research, Research Paper 14/2006, Nuremberg, Germany.
Nielsen, C.P. (2007) ‘Immigrant overeducation: evidence from Denmark’, World Bank Policy, Research Paper 4234.
OECD (2007) Jobs for immigrants volume 1: labour market integration in Australia, Denmark, Germany and Sweden, Organisation for Economic Co-operation and Development, Paris: OECD..
Papademetre, L. and Routoulas, S. (2001) ‘Social, political, educational, linguistic and cultural (dis-)incentives for languages education in Australia’, Journal of Multilingual and Multicultural Development, 22, (2), 134-151.
Peri, G. (2007) ‘Immigrants’ complementarities and native wages: evidence from California’, NBER Working Paper 12956.
Shippler, D.K. (2005) The working poor: invisible in America, Vintage Books.
The Nuffield Languages Inquiry (2000) Languages: the next generation. London: The Nuffield
Foundation.
Trivedi, P. K. and Zimmer, D. M. (2005) 'Copula modeling: an introduction for practitioners’.
Foundations and Trends in Econometrics, 1, (1), 1-111.
Tsoukalas, C. (1976) ‘Some aspects of over-education in modern Greece’, In Regional variation in modern Greece and Cyprus: toward a perspective on the ethnography of Greece, ed. Dimen, M. and Friedl, E. 419-428, New York: Academy of Sciences.
Vella, F. (1998), ‘Estimating models with sample selection bias: a survey’, The Journal of Human Resources, 33, 127-169.
Voon, D, and Miller, P. W. (2005) ‘Undereducation and overeducation in the Australian labour market’, Economic Record, 81, (S1), S22-33.
Warman, W C. (2007) ‘Ethnic enclaves and immigrant earnings’, Canadian Journal of Economics, 40, (2), 401-422.