R E V I E W
Open Access
Genes to predict VO
2max
trainability: a
systematic review
Camilla J. Williams
1, Mark G. Williams
2, Nir Eynon
3*, Kevin J. Ashton
4, Jonathan P. Little
5, Ulrik Wisloff
1,6and Jeff S. Coombes
1From34th FIMS World Sports Medicine Congress
Ljubljana, Slovenia. 29thSeptember–2ndOctober 2016
Abstract
Background:Cardiorespiratory fitness (VO2max) is an excellent predictor of chronic disease morbidity and mortality
risk. Guidelines recommend individuals undertake exercise training to improve VO2maxfor chronic disease reduction.
However, there are large inter-individual differences between exercise training responses. This systematic review is
aimed at identifying genetic variants that are associated with VO2maxtrainability.
Methods:Peer-reviewed research papers published up until October 2016 from four databases were examined. Articles were included if they examined genetic variants, incorporated a supervised aerobic exercise intervention;
and measured VO2max/VO2peakpre and post-intervention.
Results:Thirty-five articles describing 15 cohorts met the criteria for inclusion. The majority of studies used a cross-sectional retrospective design. Thirty-two studies researched candidate genes, two used Genome-Wide Association Studies (GWAS), and one examined mRNA gene expression data, in addition to a GWAS. Across these studies, 97
genes to predict VO2maxtrainability were identified. Studies found phenotype to be dependent on several of these
genotypes/variants, with higher responders to exercise training having more positive response alleles than lower responders (greater gene predictor score). Only 13 genetic variants were reproduced by more than two authors. Several other limitations were noted throughout these studies, including the robustness of significance for identified variants, small sample sizes, limited cohorts focused primarily on Caucasian populations, and minimal baseline data. These factors, along with differences in exercise training programs, diet and other environmental
gene expression mediators, likely influence the ideal traits for VO2maxtrainability.
Conclusion:Ninety-seven genes have been identified as possible predictors of VO2maxtrainability. To verify the strength of these findings and to identify if there are more genetic variants and/or mediators, further tightly-controlled studies that measure a range of biomarkers across ethnicities are required.
Keywords:Cardiorespiratory fitness, VO2max, Predictor genes, Training
Background
The worldwide prevalence of chronic diseases, such as cardiovascular disease, cancers, stroke and diabetes is rising [1]. Low cardiorespiratory fitness is strongly asso-ciated with chronic diseases and premature mortality [2–7]. To alleviate the health and economic burden as-sociated with low cardiorespiratory fitness, health
guidelines across the world recommend individuals undertake regular exercise [1].
Exercise training can increase cardiorespiratory fitness and decrease chronic disease via a number of mecha-nisms [7]. Adaptations include improvements to cardiac size, stroke volume (increase in volume of blood pumped from the left ventricle), cardiac output (volume of blood pumped from the heart per minute), pulmonary blood flow and respiratory function, supply of oxygen-rich blood to working muscles (increased number of
* Correspondence:[email protected]
3Institute of Sport, Exercise and Active Living (ISEAL), Victoria University,
Melbourne 8001, Australia
Full list of author information is available at the end of the article
capillaries and blood volume), muscle mitochondrial function and content, oxidative enzyme capacity, vascu-lar wall health and function, and biomechanical effi-ciency [2, 7]. It has been suggested that improvements in cardiorespiratory fitness in response to exercise train-ing varies greatly between individuals, with some people responding well or very well (‘responders’ or ‘ high-re-sponders’) to exercise training, whereas others only have mild increases in their cardiorespiratory fitness following similar exercise training (‘low-responders’) [4, 5, 8–11]. Importantly, these responses need to be compared to within-subject random variation to ascertain true inter-individual differences [12]. The ability to change cardio-respiratory fitness is a multifactorial trait influenced by environmental factors (such as exercise training) and genetic factors [4, 5, 11]. Considering cardiorespiratory fitness is one of the best integrative predictors of mor-bidity and mortality risk, it may be important to under-stand how genetics predict the variability in response to exercise training. This knowledge could lead to targeted personalised exercise therapy to decrease the burden of chronic disease.
The gold standard measure for cardiorespiratory fit-ness is maximal oxygen uptake (VO2max), which is
quan-tified as the maximal amount of oxygen the body can use in 1 min, during dynamic work with large muscle mass [13]. Research into human variation of VO2maxwas
first undertaken over forty years ago, with several au-thors identifying a strong genetic influence on VO2max
in twins [14, 15]. Subsequent studies have identified sig-nificant familial aggregation for VO2max trainability. For
example, authors have found greater variance between pairs of monozygotic (MZ; identical) twins than within pairs of twins for VO2max training response after
stan-dardized aerobic training interventions [16, 17]. The strongest evidence to date on this topic was found in the HEalth, Risk factors, exercise training And GEnetics (HERITAGE) family study [18]. Four hundred seventy-three Caucasian adults from 99 nuclear families com-pleted 20 weeks of Moderate Intensity Continuous Training (MICT). The average increase in VO2max was
400 mL O2/min, with a range from−114 to + 1097 mL/
min. This difference was two and half times greater be-tween families than within families, with a 47% heritabil-ity estimate for VO2max training response [18]. A major
limitation from these findings, however, is there was no comparator control group.
Since this familial longitudinal research, the Human Genome Project completed sequencing of the human genome resulting in significant advancements in genetic analysis capabilities. This led to a better understanding of genetic variations of large populations. Analyzing gen-etic variants on a population level using techniques such as candidate gene analysis, GWAS, whole genome and
exome sequencing and RNA expression analysis (RNA-seq, or microarrays) has resulted in the possibility of developing ‘personalized genomics’. This aims for bio-logical profiling to provide more effective health man-agement and treatment [5]. However, research in the field of exercise genomics it still in its infancy and much work is needed before genomic tools could be utilized to personalize exercise training programs [19].
The aim of this study was to systematically review the literature and identify genetic variants that have been associated with VO2max trainability following an aerobic
exercise training intervention. Given the infancy of this research field, results should only be used to provide the basis for future research. This research should aim to confirm previous findings and investigate mediators that can influence gene expression. Importantly, future gen-etic studies in this area should attempt to investigate the physiological functions that contribute to improving VO2max training response and overall health outcomes.
Findings from ongoing research may assist clinical pro-fessionals to provide personalized evidenced-based medicine centered on phenotype, contributing to the fight against chronic disease.
Methods
A comprehensive search of four databases (PubMed, Embase, Cinahl, Cochrane) was completed from their inception until October 2016. Studies focusing on genes and their VO2max/VO2peak response to supervised
aer-obic training were sought with the following search terms: genetic profiling, polymorphism, single nucleo-tide polymorphisms, SNPs, genetic variants, predictor genes, trainability, endurance training, cardiovascular fitness, cardiorespiratory fitness, VO2max, VO2peak, aerobic
power, aerobic fitness, aerobic capacity. A full list of search terms can be found at the end of this review.
Two authors (CW and JC) agreed on the criteria for inclusion. Articles were incorporated if they were: ori-ginal, peer-reviewed research; included an aerobic inter-vention, with minimum 75% supervision; included genetic variant testing; included a maximal VO2max/peak using
direct gas analysis from an incremental test (pre and post intervention); conducted on humans; and written in English.
investigated on VO2max change. Further articles were
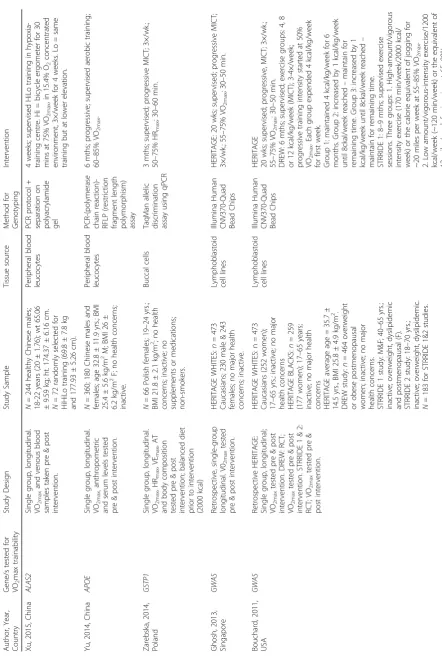
retrieved from snowballing included articles from their reference lists. Articles included in the review are in Table 1.
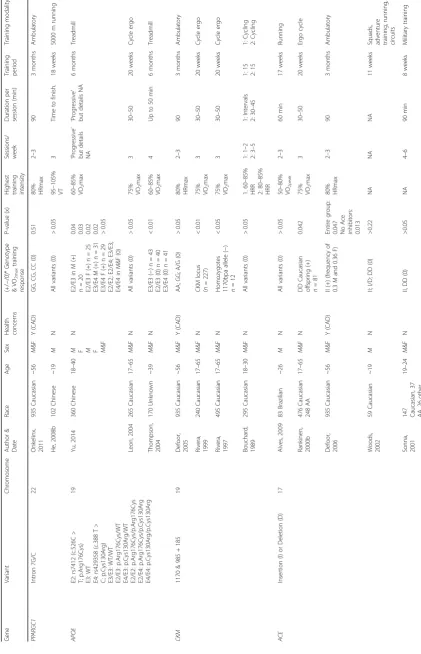
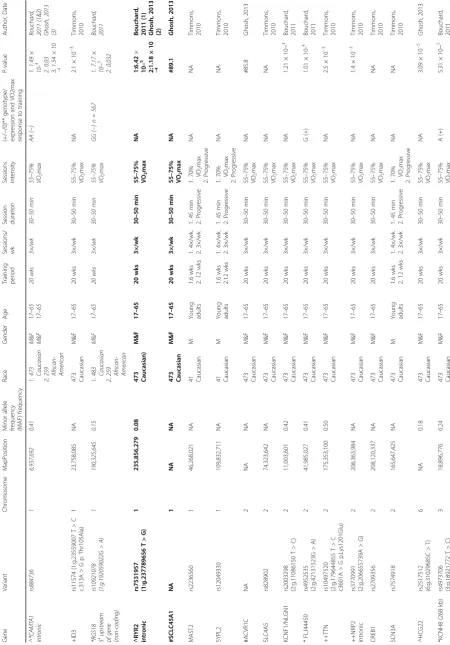
A summary of key findings from the included articles is provided in Tables 2 and 3. Limitations were assessed by two authors (CW and JC) based on the intervention, genotyping method used, study design and sample used. Table 4 was developed to highlight which predictor genes for VO2max trainability merited further
explo-ration. A third author (MW) examined Tables 1, 2, 3 and 4 to ensure all genetic variants, genomic coordi-nates and genotypes, were described with a consistent annotation.
Results
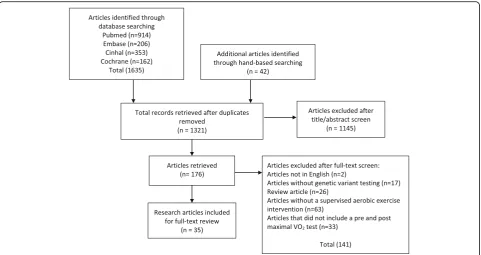
Of the 1635 articles identified, 35 met the inclusion cri-teria (see Fig. 1). A summary of these articles is provided in Tables 1, 2 and 3. From the 35 articles, 97 genetic var-iants were identified as being significantly associated with VO2maxtrainability (Table 4).
Study characteristics
Across the studies DNA samples from 4212 individuals were used. Tissue sources were predominantly blood leucocytes, lymphoblastoid cell lines and buccal cells. Genotype was primarily identified through PCR-RFLP (polymerase chain reaction restriction fragment length polymorphism based analysis) for candidate genes and Illumina Human CV370-Quad Bead Chips for GWAS analysis (which can capture over 370,000 SNPs per participant).
Overall, 68% of participants in the reviewed studies were men, and ages ranged from 17 to 75 years. The average BMI of participants was 25.3 kg/m2 (SD 2.36).
Where detailed, DNA samples were taken from a variety of ethnicities, including Caucasian (74.5%), Asian (13.5%), African-American (7.5%), Hispanic (4.3%) and Native American (0.2%).
The 35 included articles described 15 cohorts, with three cohorts providing subject data for 19 articles (see Table 1 for details). Nine articles [20–28] used data from the HERITAGE study and five [29–33] reviewed Caucasian participant data from the Cardiac Rehabilita-tion and Genetics of Exercise Performance and Train-ing Effect (CARAGENE) study. Five studies examined clinical data from 102 young male and apparently healthy police recruits in China [34–38]. The remaining samples came from independent clinical studies focusing on appar-ently healthy but sedentary adults from a variety of ethnic-ities including Caucasians, Asians, African-Americans, Native American and Hispanics [13, 39–53].
Most reviewed studies (n= 32) used a single-group longitudinal design. However, one study compared three
groups using a longitudinal design [28]. One study used retrospective data from two Randomized Controlled Tri-als (RCT) [20]; and one was a double-blind study [39].
Twenty-eight studies examined a MICT intervention. Two studies examined protocols using High Intensity Interval Training (HIIT) [28, 40]. The 5 remaining stud-ies trained participants by running at Ventilatory Threshold (VT) [34–38]. Training intensity was mea-sured using a percentage of VO2max, Heart Rate Reserve
(HRR), VT, Maximal Power (Pmax) or Maximum Heart
Rate (HRmax). Intensities varied between 50 and 85%
VO2max, 95% -105% VT, 50–85% Pmax, 80–85% HRR
and 50–80% HRmax. Training volume varied between 20
to 90 min per session (2-4×/week). The period of inter-ventions ranged from 4 weeks to 9 months. Training modalities consisted primarily of cycle ergometers and treadmills.
Only six studies incorporated a standardized diet prior to and during the intervention period [23, 41–45]. Three articles included strength training [20, 39, 47] and two studies included military training [39, 47] as the intervention.
Genotyping findings
1. Candidate gene studies
The candidate gene association approach requires a prior hypothesis that the genetic polymorphisms of interest are causal variants or in strong linkage disequi-librium (LD) with a causal variant, and would be associ-ated with a particular exercise-relassoci-ated phenotype at a significantly different rate than predicted by chance alone (may be higher or lower). This approach is effect-ive in detecting genetic variants that are either directly causative, or belong to a shared haplotype that is causa-tive [54]. Thirty-two candidate gene studies were based on the gene’s molecular function and possible associ-ation with VO2maxtrainability (Table 2).
Genes associated with muscular subsystems
VO2peak can be influenced by muscle efficiency and it
has been hypothesized that genes encoding muscular subsystems may contribute to the genetic variability in
VO2peak training response [33]. Twelve genes and 21
genetic variants related to muscular phenotypes were in-vestigated in 935 (76 female) cardiac patients from the CARAGENE study [33]. Three out of the 21 genetic var-iants were significantly associated (p< 0.05) with an in-crease in VO2peak following 3 months of MICT (2–3 ×
90-min sessions per week at 80% HRmax;p< 0.05). These
Table
1
Summary
of
included
articles
(Continued)
Autho
r,
Year,
Count
ry
Ge
ne/s
te
sted
for
VO
2
max
trainabi
lity
Stud
y
Des
ign
Stud
y
Sampl
e
Tissue
source
Met
hod
for
Geno
typing
Inte
rvention
3.
Lo
w
amou
nt,
mod
erate
intens
ity
exerc
ise
(120
0
kcal/week
(170
mi
n/wee
k)
or
the
eq
uivale
nt
of
12
mi
les/week
at
40
–
55
%
VO
2max
.
ST
RRIDE
2:
8
–
9
mth
s;
super
vised;
four
groups:
1:
Aer
obic
training
–
1300
cal
–
65-8
0%;
2:
Re
sistance
trai
ning
only
with
3
sets
of
12
–
15
rep
s
3
x
/wee
k.
3:
Comb
ination
of
the
fi
rst
2
proto
cols;
4:
High
anaer
obic
training
–
2200
cal
–
3
x
week
–
65
-80%.
Fi
rst
2
–
3
mon
ths
‘
ram
p
up
period
’
.
Followi
ng
6
mths
usi
ng
app
ropri
ate
pro
tocol.
McKe
nzie,
2011,
USA
AK
T
Si
ngle
group,
longitudinal.
VO
2max
tested
pre
&
post
inte
rvention;
diet
ary
st
abilisation.
N
=
51
M
and
58
F
Cau
casians;
50
–
75
yrs.;
no
majo
r
heal
th
conc
erns;
non-sm
oking;
BM
I
<37
;
haem
atocrit
>35
;
BP
betw
een
120/
80
but
le
ss
than
16
0/100
mm
Hg;
at
least
one
lipid
abno
rmality;
not
any
medi
cation
for
blood
press
ure,
chol
estero
l
or
gluc
ose
;
F
post-m
enopa
usal
for
at
le
ast
2
years
(sta
ble
HRT
or
non
HRT);
inactive.
Perip
heral
blood
leuco
cytes
TaqMan
allelic
disc
rimination
assay
usi
ng
qPC
R
24
wk
s;
supervised;
progr
es
sive
MI
CT;
3×/w
k.;
50
–
70
%
HRR;
20
–
40
min
.
Thom
aes,
2011
,
Belg
ium
AMPD
1;
GR;
CNTF
Re
trospe
ctive,
sing
le
gro
up,
lon
gitudinal
.
VO
2peak
tested
pre
&
po
st
inte
rvention.
N
=
935
coronary
arte
ry
disease
pat
ients
(CAD)
;
76
female
s;
Cau
casian;
age
56
±
0.3
yrs.;
BMI
25.8
±
0.
1
kg/m
2;
5
%
smokers;
85%
cardiac
medications;
5%
dia
betes;
27%
hyp
erte
nsion.
Perip
heral
blood
leuco
cytes
Invad
er
TM
assay
(th
ird
wave technol
ogies)
3
mths;
super
vised
;
2-3×
/wk.;
80
%
HR
max
;
90
mi
ns/sessi
on.
Onkeli
nx,
2011
,
Belg
ium
NOS3
;
Catal
ase;
VEG
F;
Ec
o-SOD
;
GP
X;
P22
Phox;
PP
ARGC
1;
PP
AR
α
Re
trospe
ctive,
sing
le
gro
up,
lon
gitudinal
.
VO
2peak
tested
pre
&
po
st
inte
rvention.
N
=
935
coronary
artery
disea
se
pat
ients
(CAD)
;
76
female
s;
Cau
casian;
age
56
±
0.3
yrs.;
BMI
25.8
±
0.
1
kg/m
2 ;
5
%
smokers;
85%
cardiac
medications;
5%
dia
betes;
27%
hyp
erte
nsion.
Perip
heral
blood
leuco
cytes
Invad
er
TM
Assay
(th
ird
wave technol
ogies)
CAR
AGEN
E:
3
mths;
super
vised
;
3×/w
eek;
90
mi
ns;
~
intens
ity
=
80%
(HR/
peakHRx100)
Silva,
2011,
Brazi
l
NOS3
Si
ngle
group,
longitudinal.
VO
2peak
tested
pre
&
post
inte
rvention.
N
=
80
Portug
uese
poli
ce
recru
its;
20
–
35
years
;
BMI
23
.3
±
3.6
kg/m
2 ;
no
heal
th
conce
rns;
inac
tive.
Perip
heral
blood
leuco
cytes
PCR-R
FLP
18
we
eks;
super
vised;
3×/week
/
80
min
s;
inte
nsity
graded
to
VT
Table 1 Summary of included articles (Continued) Autho r, Year, Count ry Ge ne/s te sted for VO 2 max trainabi lity Stud y Des ign Stud y Sampl e Tissue source Met hod for Geno typing Inte rvention Prio r, 2003, USA HIF1A Si ngle group, longitudinal. VO 2max tested pre & post inte rvention. N = 101 Caucasian and 22 African-Ameri cans in good health; age
57.7 ±0.
Table
1
Summary
of
included
articles
(Continued)
Autho
r,
Year,
Count
ry
Ge
ne/s
te
sted
for
VO
2
max
trainabi
lity
Stud
y
Des
ign
Stud
y
Sampl
e
Tissue
source
Met
hod
for
Geno
typing
Inte
rvention
Rivera,
1997,
Canad
a
CK
MM
Re
trospe
ctive,
sing
le
gro
up,
lon
gitudinal
.
VO
2max
tested
pre
&
po
st
inte
rvention.
HER
ITAGE
WHI
TES
:
160
Cau
casian
pare
nts
and
80
offsp
ring;
17
–
65
years
;
inac
tive;
no
majo
r
heal
th
conc
erns.
Lympohblas
toid
cell
lines
PCR-R
FLP
assay
H
ERTIAGE:
20
wks;
sup
ervised;
progr
essiv
e
MICT
;
3×
/wk.;
55
–
75%
VO
2max
;3
0
–
50
mi
n
Dionn
e,
19
91,
Canad
a
mtD
NA
Si
ngle
group,
longitudinal.
VO
2max
tested
pre
&
post
inte
rvention.
N
=
46
M
from
Quebe
c
(17
–
27
yrs)
&
27
M
from
Temp
e
(24
–
29
yrs
);
inac
tive
Perip
heral
blood
leuco
cytes
PCR-R
FLP
assay
Q
uebec:
20
weeks;
sup
ervised;
progr
essiv
e
trai
ning;
Max
85%
HRR
;
max
45
mi
n/session;
3×
/wk.
Te
mpe:
12
weeks;
sup
ervised;
progr
essiv
e
trai
ning;
max
70
–
77%
VO
2max
;
max
40
min/
se
ssion;
3×/wk
Bou
chard,
1989
,
Canad
a
AK
1M
CK
M
RCT
.
VO2ma
x,
total
power
out
put
tested
pre
&
post
inte
rvention.
N
=
295
M
7
F
(18
–
30
years
);
heal
thy
Caucasians
Muscle
biop
sy
and
peripheral
blood leuco
cytes
Formaz
an
techni
que?
Grou
p
1:
15
we
eks;
supervised;
pro
gressive
MI
CT;
30
–
45
mi
n/session
;
3-5×/wk.;
60
–
85%
HRR
Grou
p
2:
15
we
eks;
supervised;
pro
gressive
inte
rval
training;
1-2×
/wee
k;
80
–
85%
H
RR
se
parated
by
5
mi
n
recove
ry.
M
male,
F
female,
wks
weeks,
mths
months,
wt
weight,
ht.
height,
yrs.
years,
BMI
body
mas
index,
BF
%
body
fat
percentage,
VO2max
maximal
oxygen
uptake/cardior
espiratory
fitness,
PCR
polymerase
chain
reaction
protocol,
RFLP
restriction
fragment
length
polymorphism,
qPCR
Quantatitive
Polymerase
Chain
Reaction,
RCT
randomised
controlled
trial,
GWAS
genome
wide
association
study,
HRT
hormone
replacement
therapy,
SNP
single
nucleotide
polymorphism,
AT
anaerobic
threshold,
MICT
moderate
intensity
interval
training,
HR
heart
rate,
HRR
heart
rate
reserve,
HRmax
heart
rate
maximum,
Pmax
maximal
aerobic
power,
Submax
submaximal,
Cal/kcal
calories,
mtDNA
mitochondrial
DNA,
BP
blood
Table
2
Summary
of
findings
from
candidate
gene
studies
Gene
Variant
Chromosome
Author
&
Date
Race
Age
Sex
Health concerns
(+/
−
/0)*
Genotype
&V
O2max
training
response
P-value
(x)
Highes
t
train
ing
inten
sity
Sessions/ week
Duration
pe
r
session
(min)
Training period
Training
modality
PP
ARGC1
Intron
7G/C
22
Onkelinx, 2011
935
Cauca
sian
~56
M&F
Y
(CAD)
GG,
CG,
CC
(0)
0.51
80% HRm
ax
2
–
3
90
3
mo
nths
Ambulatory
He,
2008b
102
Chinese
~19
M
N
All
variants
(0)
>
0.05
95
–
105%
VT
3
Time
to
finish.
18
weeks
5000
m
running
APOE
E2:
rs7412
(c.526C
>
T;
p.Arg176Cys)
E3:
WT
E4:
rs429358
(c.38
8
T
>
C;
p.Cys130Arg)
E3/E3:
WT/WT
E2/E3:
p.Arg176Cy
s/WT
E4/E3:
p.Cys130A
rg/WT
E2/E2:
p.Arg176Cy
s/p.Arg176Cys
E2/E4:
p.Arg176Cy
s/p.Cys130Arg
E4/E4:
p.Cys130A
rg/p.Cys130Arg
19
Yu,
2014
360
Chinese
18
–
40
M F M F M&F
N
E2/E3
in
M
(+)
n=
2
0
E2/E3
F
(+)
n
=
25
E3/E4
M
(+)
n
=
31
E3/E4
F
(+)
n
=
29
E2/E2;
E2/E4;
E3/E3;
E4/E4
in
M&F
(0)
0.04 0.03 0.02 0.02 >0.05
60
–
85%
VO
2
max
‘
Progressive
’
but
details
NA
‘
Progressive
’
but
de
tails
NA
6
mo
nths
Treadmill
Leon,
2004
265
Cauca
sian
17
–
65
M&F
N
All
variants
(0)
>
0.05
75% VO
2
max
33
0
–
50
20
weeks
Cycle
ergo
Thompson, 2004
170
Unkno
wn
~39
M&F
N
E3/E3
(
−
)n=4
3
E2/E3
(0)
n
=
40
E3/E4
(0)
n
=
41
<
0.01
60
–
85%
VO
2
max
4
Up
to
50
min
6
mo
nths
Treadmill
CKM
1170
&
985
+
185
19
Defoor, 2005
935
Cauca
sian
~56
M&F
Y
(CAD)
AA;
GG;
A/G
(0)
>
0.05
80% HRm
ax
2
–
3
90
3
mo
nths
Ambulatory
Rivera, 1999
240
Cauca
sian
17
–
65
M&F
N
CKM
locus
(
n
=
227)
<
0.01
75% VO
2
max
33
0
–
50
20
weeks
Cycle
ergo
Rivera, 1997
495
Cauca
sian
17
–
65
M&F
N
Homozygotes 1170bpa
alle
le
(
−
)
n
=1
2
<
0.05
75% VO
2
max
33
0
–
50
20
weeks
Cycle
ergo
Bouchard, 1989
295
Cauca
sian
18
–
30
M&F
N
All
variants
(0)
>
0.05
1.
60
–
85%
HRR 2:80
–
85%
HRR
1:
1
–
2
2:
3
–
5
1:
Intervals
2:
30
–
45
1:
15
2:
15
1:
Cycling
2:
Cycling
ACE
Insertion
(I)
or
Deletion
(D)
17
Alves,
2009
83
Brazilian
~26
M
N
All
variants
(0)
>
0.05
50
–
80%
VO
2peak
2
–
3
60
min
17
weeks
Running
Rankinen, 2000b
476
Cauca
sian
248
AA
17
–
65
M&F
N
DD
Cauca
sian
offspring
(+)
n
=8
1
0.042
75% VO
2
max
33
0
–
50
20
weeks
Ergo
cycle
Defoor, 2006
935
Cauca
sian
~56
M&F
Y
(CAD)
II
(+)
(fre
quency
of
0.3
M
and
0.36
F)
Entire
group:
0.047 No
Ace
inhibitors: 0.013 80% HRm
ax
2
–
3
90
3
mo
nths
Ambulatory
Woods, 2002
59
Caucasian
~19
M
N
II;
I/D;
DD
(0)
>0.22
NA
NA
NA
11
weeks
Squads, adventure training,
running,
circuits
Sonna, 2001 147 Caucasian,
37
AA,
26
other
19
–
24
M&F
N
II,
DD
(0)
>0.05
NA
4
–
6
90
min
8
week
s
Military
traini
Table
2
Summary
of
findings
from
candidate
gene
studies
(Continued)
Gene
Variant
Chromosome
Author
&
Date
Race
Age
Sex
Health concerns
(+/
−
/0)*
Genotype
&V
O2max
training
response
P-value
(x)
Highes
t
train
ing
inten
sity
Sessions/ week
Duration
pe
r
session
(min)
Training period
Training
modality
CYBA;
P22Phox
A24G
–
640A
>
G
16
Onkelinx, 2011
935
Cauca
sian
~56
M&F
Y
(CAD)
AA,
AG,
GG
(0)
CC,
CT,
TT
(0)
0.78 0.94 80% HRm
ax
2
–
3
90
3
mo
nths
Ambulatory
PLIN
PLIN1
(6209
T
>
C)
–
rs228
9487
15:g.90217096C
>
T
PLIN4
(11482G
>
A)
–
rs894160
15:g.90211823C
>
T
PLIN5
(13041A
>
G
–
rs23
04795
15:g.90210263A
>
G
PLIN6
(149954A
>
T
–
rs1052700 15:g.90208310A
>
T
15
Jenkins, 2010
101
Cauca
sian
NA
M&F
N
Genotypes
and
haplotypes
(0)
p
>
0.05
Up
to
70%
VO
2
max
32
0
–
40
min
24
weeks
Multi-modal
AKT
rs1130214
(4:g.1
05259734C
>
A)
14
McKenzie, 2011
109
Cauca
sian
50
–
75
M F
Elevated
BP,
cholesterol, menopause
All
genotypes
sig.
Increased,
but
GT/
TT
men
(+)
n
=2
2
0.037
50
–
70%H
RR
32
0
–
40
min
24
weeks
Multi-modal
HIF1A
T
+
140C
(rs11549465)
A-2500
T
Ch
14
Prior,
2003
101
Cauca
sian
22
AA
>60 <60
M&F
N
CT
&
TT
in
Caucasian
over
60
(
−
)
n
=3
7
All
other
ages,
race
and
genotypes
(0)
0.03 >0.05 >0.05
50
–
70%
VO
2
max
32
0
–
40
min
24
weeks
‘
Aerobic
training
’
Na
+
−
K+
−
A
TP
ase
α
2
Alpha2
exon
1
Alpha2
exon
21
–
22
13
Rankinen, 2000a
472
Cauca
sian
17
–
65
M&F
N
3.3/3.3
(
−
)
n
=5
10.5/10.5
offspring
(+)
n
=1
4
0.018 0.017
55
–
75%
VO
2
max
33
0
–
50
20
weeks
Cycle
ergo
HBB
-551C/T
–
no
rs
ID
11:g.5248801
T
>
C
+16,
intron
2
-rs10768683
11:g.5247791C
>
G
+340
–
no
rs
ID
11:g.5246488
T
>
A
11
He,
2006
102
Chinese
~19
M
N
CC,
CT,
TT
(0)
CC,
CG,
GG
(0)
AA,
AT,
TT
(0)
>0.05
95
–
105%
VT
3
Time
to
finish.
18
weeks
5000
m
running
CNTF
rs1800169 (11:g.58391501G
>
A)
11
Thomaes, 2011
935
Cauca
sian
~56
M&F
N
AA
(+)
n
=
21
0.002
80%
HR
max
2
–
3
90
3
mo
nths
Ambulatory
CA
T
-262C
>
T
11
Onkelinx, 2011
935
Cauca
sian
~56
M&F
Y
(CAD)
TT
(
−
)
n
=
342
0.02
80%
HR
max
2
–
3
90
3
mo
nths
Ambulatory
GSTP1
rs1695
(11:g67352689A
>
G
c.313A
>
G
p.Ile105Val)
11
Zabreska, 2014
66
Polish
19
–
24
F
N
GG
&
AG
(+)
n
=3
0
Absolute: 0.029 Relative: 0.025
50
–
75%
HR
max
3
60
3
mo
nths
‘
Aerobic
routine
’
ADRB1
Pos.
145
Pos.
1165
10
Defoor, 2006
935
Cauca
sian
~56
M&F
Y(CAD)
Ser49Gly49, Ser49Ser49,
80%
HR
max
2
–
3
90
3
mo
nths
Ambulatory
Gly49Gly49
(0)
GLy389Gly389,
0.18
Gly389Arg389, Arg389Arg389
(0)
0.75
TFAM
rs1937
(10:g.60145342G
>
C
c.35G
>
C
p.Ser12Thr)
rs2306604 (10:g.60148692A
>
G)
rs1049432
(10:g.
60155120G
>
T)
10
He,
2007b
102
Chinese
~19
M
N
GG,
CG,
CC
(0)
AA,
AG,
GG
(0)
GG,
GT
,
TT
(0)
>0.05
95
–
105%
VT
3
Time
to
finish.
18
weeks
5000
m
Table
2
Summary
of
findings
from
candidate
gene
studies
(Continued)
Gene
Variant
Chromosome
Author
&
Date
Race
Age
Sex
Health concerns
(+/
−
/0)*
Genotype
&V
O2max
training
response
P-value
(x)
Highes
t
train
ing
inten
sity
Sessions/ week
Duration
pe
r
session
(min)
Training period
Training
modality
NOS3
T-1495A
–
No
rs
ID
7:g.150689397A
>
T
A-949G
–
rs1800779
7:g.150689943G
>
A
-786
T
>
C
–
rs41322052
7:g150690106C
>
T
G298A
–
rs1799983
7:g.150696111
T
>
G
c.894
T
>
G
(p.Asp298Glu))
7
Onkelinx, 2011
935
Cauca
sian
~56
M&F
Y
(CAD)
TT,
TA,
AA
(0)
AA,
AG,
GG
(0)
TT,
TC,
CC
(0)
TT,
CT,
C
(0)
CC,
CT,
TT
(0)
GG,
GA,
AA
(0)
0.54 0.76 0.69 0.69 1.88 1.04 80% HRm
ax
2
–
3
90
3
mo
nths
Ambulatory
-786
T
>
C
–
rs41322052
7:g150690106C
>
T
Intron
4
–
rs61722009
VNTR
(repeat)
7:g.150694276_ 150694302AGG
GGTG
894G
>
T
–
rs1799983
7:g.150696111
T
>
G
c.894
T
>
G
(p.Asp298Glu))
7
Silva,
2011
80 Portu
guese
20
–
35
M
N
TT,
CC,
TC
(0)
4b4b,
4ba4c,
4a4a
(0)
GG,
GT
,
TT
(0)
*All
genotypes
sig.
Increased.
fitness,
thus
no
difference
between
groups
0.001
Grade
d
to
VT
HR
3
80
min
18
weeks
Running
NRF-1
C&T
-rs24
02970
7:g.80647382G
>
T
A
&
G
-rs10
500120
7:g.129393341A
>
G
rs6949152 7:g129286436A
>
G
7
He,
2008a
102
Chinese
~19
M
N
CC,
CT,
TT
(0)
AA,
AG,
GG
(0)
AA,
AG,
GG
(0)
0.38 0.110 0.094
95
–
105%
VT
3
Time
to
finish.
18
weeks
5000
m
running
AK1M
common
and
rare
variants
7
Bouchard, 1989
295
Cauca
sian
18
–
30
M&F
N
(0)
>
0.05
1.
85%
HRR
2:
85%
HRR
1:
1
–
2
2:
3
–
5
1:
Intervals
2:
30
–
45
1:
15
2:
15
1:
Cycling
2:
Cycling
PP
ARD
Exon
4
+
15
Exon
7
+
65
Ch
6
Hautala, 2007
Caucasian
A
A
1
7
–
65
M&F
N
CC
ge
notype
in
AA
of
Exon
4
+
15
(
−
)
n
=1
9
0.005
75% VO
2
max
33
0
–
50
20
weeks
Cycle
ergo
VEGF
405 460
6
Onkelinx, 2011
935
Cauca
sian
~56
M&F
Y
(CAD)
GG,
GC,
CC
(0)
CC,
CT,
TT
(0)
0.52 0.52
80%
HR
max
2
–
3
90
3
mo
nths
Ambulatory
GR/NR3C1
rs6190
(5:g.142780337C
>
T
c.68G
>
A
p.Arg23Lys)
5
Thomaes, 2011
935
Cauca
sian
~56
M&F
Y
(CAD)
G/A
(+)
n
=
55
<0.01
80%
HR
max
2
–
3
90
3
mo
nths
Ambulatory
PP
AR
α
Gly482Ser
4
Onkelinx, 2011
935
Cauca
sian
~56
M&F
Y
(CAD)
GG,
G,
SS
(0)
0.59 0.8
80%
HR
max
2
–
3
90
3
mo
nths
Ambulatory
SOD3
C760G
4
Onkelinx, 2011
935
Cauca
sian
~56
M&F
Y
(CAD)
CC
(0)
G
carrier
(0)
0.12 0.18
80%
HR
max
2
–
3
90
3
mo
nths
Ambulatory
GP
X
197P
>
L
3
Onkelinx, 2011
935
Cauca
sian
~56
M&F
Y(CAD)
Pro197Pro
(0)
Leu-carrier
(0)
0.18 0.78
80%
HR
max
2
–
3
90
3
mo
nths
Ambulatory
NFE2L2
Rs125949 Rs8031031 Rs718186
2
He,
2007b
102
Chinese
~19
M
N
CC,
CA,
AA
(0)
CT,
TT,
AA
(0)
AG,
GG
(0)
>
0.05
95
–
105%
VT
3
Time
to
finish.
18
weeks
5000
m
running
AMPD1
AMPD1:c.133C
(rs17602729)
1
Thomaes, 2011
935
Cauca
sian
~56
M&F
N
CC
(+)
n
=
652
<
0.05
80%
HR
max
2
–
3
90
3
mo
nths
Ambulatory
Rico-Sanz, 2003
329
Cauca
sian
90
AA
17
–
65
M&F
N
TT
(
−
)i
n
Caucasians
(
n
=6
)
<
0.006
75%
VO
2
max
33
0
–
50
20
weeks
Table
2
Summary
of
findings
from
candidate
gene
studies
(Continued)
Gene
Variant
Chromosome
Author
&
Date
Race
Age
Sex
Health concerns
(+/
−
/0)*
Genotype
&V
O2max
training
response
P-value
(x)
Highes
t
train
ing
inten
sity
Sessions/ week
Duration
pe
r
session
(min)
Training period
Training
modality
mtDNA
MTND5 m.13470A
>
C
or
A
>
G
m.12406G
>
A
m.13365C
>
T
mtDNA
SNP
via
restriction
enzyme
Murakami, 2001
21
Japanese
20.6
M
N
All
variants
(0)
>
0.05
70%
VO
2
max
3
–
4
60
min
8
week
s
Ergo
Cycle
mtDNA
Within mitochondr
ia
Dionne, 1991
53
Quebec,
Tempe
17
–
27
M
N
mtDNA
subunit
5N
5
(
−
)
n
=3
0.05
Que
bec:
85%
HRR
Tempe:77% VO
2
max
Quebe
c:
3
Tempe:
3
–
5
Quebec:45
min
Tempe:40
min
Quebec: 20
wks
Tempe: 12
wks
Ergo
Cycle
ALAS2
≤
166
bp
Mitochondr
ia
Xu,
2015
72
Chinese
18
–
22
M
N
≤
166
bp
(+)
n
=
25
<
0.05
‘
High/L
ow
train
ing
’
3
30
min
4
week
s
Ergo
Cycle
where
possib
le,
gene
variants
were
annotated
using
the
references
seq
uence
(GRCh37
/hg19)
CAD
coronary
artery
disease,
wks
weeks,
mths
months,
VO
2max
max
imal
oxygen
uptak
e/cardiorespiratory
fitn
ess,
AT
anaerob
ic
threshold,
HRR
heart
rate
reser
ve,
HRma
x
heart
rate
max
imum,
Pmax
max
imal
aerobic
power,
Cauc
Caucasian,
AA
African-American,
M
male,
F
female
**(+)
=
high
training
respons
e,
(
−
)
=
low
trainin
g
respons
e,
(0)
=
neutral
training
response
(x)
=
p-va
lue
has
been
adjusted
for
covariates
except
for
article
by
Xu
et
al.
(2015)
where
it
wasn
’
t
clear
if
p-value
had
been
adjusted
(ALAS
2
Table 3 Summary of hypothesis-free studies Gene Vari ant Chromosome MapPosition Minor allele frequenc y (MAF) frequency Race Gender Age Training period Sessions/ wk Session duration Sess ions inten sity (+/ − /0)** genotype/ exp ression and VO2max respo nse to training P-valu e Autho r, Date ^*CAMT A1 intronic rs884736 1 6,937,692 0.41 1. 473 Cauc asian 2. 259 Afric an-Americ an M&F M&F 17 – 65 17 – 65 20 wks 3×/wk 30 – 50 min 55 – 75% VO 2 max AA ( − ) 1. 1.49 × 10⁻⁴ 2. 0.03 3. 1.54 × 10 − 4 Boucha rd , 2011 (1&2) Ghosh, 2013 (3) +ID3 rs115 74 (1:g.23559007 T > C c.313 A > G p. Thr105Ala) 1 23,758,085 NA 473 Cauca sian M&F 17 – 65 20 wks 3×/wk 30 – 50 min 55 – 75% VO 2 max NA 2.1 × 10 − 3 Timmons , 2010
*RGS18 5′upstream of
Table 3 Summary of hypothesis-free studies (Con tinued) Gene Vari ant Chromosome MapPosition Minor allele frequenc y (MAF) frequency Race Gender Age Training period Sessions/ wk Session duration Sess ions inten sity (+/ − /0)** genotype/ exp ression and VO2max respo nse to training P-valu e Autho r, Date HCG22 rs252 3840 6 31,138,404 0.17 473 Cauca sian M&F 17 – 65 20 wks 3×/wk 30 – 50 min 55 – 75% VO 2 max NA 7.53 × 10⁻⁵ Bouc hard, 2011 HCG22 rs251 7506 6 31,139,659 0.17 473 Cauca sian M&F 17 – 65 20 wks 3×/wk 30 – 50 min 55 – 75% VO 2 max NA 7.53 × 10~ 5 Bouc hard, 2011 *PRDM1 (287 kb) rs104 99043 6 106,353,830 0.13 473 Cauca sian M&F 17 – 65 20 wks 3×/wk 30 – 50 min 55 – 75% VO 2 max A (+) 3.93 × 10⁻⁶ Bouc hard, 2011 *ENPP3 (17 kb) rs104 52621 6 132,127,094 0.12 473 Cauca sian M&F 17 – 65 20 wks 3×/wk 30 – 50 min 55 – 75% VO 2 max A (+) 1.23 × 10~ 4 Bouc hard, 2011 +SLC22A3 rs245 7571 6 160,754,818 NA 473 Cauca sian M&F 17 – 65 20 wks 3×/wk 30 – 50 min 55 – 75% VO 2 max Down regulated in high responders 3.0 × 10 − 3 Timmons , 2010 ^TMEM181 NA 6 NA NA 473 Cauca sian M&F 17 – 65 20 wks 3×/wk 30 – 50 min 55 – 75% VO 2 max NA #84.5 Ghos h, 2013 ^PARK2 NA 6 NA NA 473 Cauca sian M&F 17 – 65 20 wks 3×/wk 30 – 50 min 55 – 75% VO 2 max NA #84.8 Ghos h, 2013 ^SNX14 NA 6 NA NA 473 Cauca sian M&F 17 – 65 20 wks 3×/wk 30 – 50 min 55 – 75% VO 2 max NA #86.7 Ghos h, 2013 ^BTBD9 NA 6 NA NA 473 Cauca sian M&F 17 – 65 20 wks 3×/wk 30 – 50 min 55 – 75% VO 2 max NA #86 Ghos h, 2013 ^KCNQ5 NA 6 NA NA 473 Cauca sian
1.M&F 2.M
Table 3 Summary of hypothesis-free studies (Con tinued) Gene Vari ant Chromosome MapPosition Minor allele frequenc y (MAF) frequency Race Gender Age Training period Sessions/ wk Session duration Sess ions inten sity (+/ − /0)** genotype/ exp ression and VO2max respo nse to training P-valu e Autho r, Date ^CD6 rs175 098 11 NA NA 473 Cauca sian M&F 17 – 65 20 wks 3×/wk 30 – 50 min 55 – 75% VO 2 max NA 1.11 × 10 − 4 Ghos h, 2013 ^SHANK 2 rs107 51308 11 NA NA 473 Cauc asian M&F 17 – 65 20 wks 3×/w k 30 – 50 min 55 – 75% VO 2 max NA 8.11 × 10 − 5 Ghos h, 2013 #GRIK4 N/A 11 NA NA 473 Cauc asian M&F 17 – 65 20 wks 3×/w k 30 – 50 min 55 – 75% VO 2 max NA 88.3 2 Ghos h, 2013 H19 rs225 1375 11 1,976,076 NA 41 Cauca sian M Young adults 1.6 wks 2. 12 wks 1. 4×/wk. 2. 3×/wk 1. 45 min 2. Progr essive 1. 70% VO 2 max 2. Progressive NA NA Timmons , 2010 FAM19A2 rs216 8452 12 NA NA 473 Cauca sian M&F 17 – 65 20 wks 3×/wk 30 – 50 min 55 – 75% VO 2 max NA 1.34 × 10 − 4 Ghos h, 2013 ^C12orf36 (14 kb) rs125 80476 12 13,435,330 0.14 473 Cauca sian M&F 17 – 65 20 wks 3×/wk 30 – 50 min 55 – 75% VO 2 max NA 1.08 × 10~ 4 2. 1.45 × 10 − 4 Bouc hard,
2011 (1) Ghos
h, 2013 (2) ^NALCN N/A 13 NA NA 473 Cauc asian M&F 17 – 65 20 wks 3×/w k 30 – 50 min 55 – 75% VO 2 max NA #85 Ghos h, 2013 +MIPEP rs732 4557 13 23,194,862 NA 473 Cauca sian M&F 17 – 65 20 wks 3×/wk 30 – 50 min 55 – 75% VO 2 max NA 5.1 × 10 − 3 Timmons , 2010 ^EEF1DP 3 rs277 3968 13 NA NA 473 Cauca sian M&F 17 – 65 20 wks 3×/wk 30 – 50 min 55 – 75% VO 2 max NA 3.67 × 10 − 6 Ghos h, 2013 ^CLYBL N/A 13 NA NA 473 Cauca sian M&F 17 – 65 20 wks 3×/wk 30 – 50 min 55 – 75% VO 2 max NA #85.4 Ghos h, 2013 *TTC6 rs128 96790 14 37,343,673 0.09 473 Cauca sian M&F 17 – 65 20 wks 3×/wk 30 – 50 min 55 – 75% VO 2 max NA 3.59 × 10⁻⁵ Bouc hard, 2011 METTL3 rs126 3809 14 21,058,740 NA 41 Cauca sian M Young adults 1.6 wks 2. 12 wks 1. 4×/wk. 2. 3×/wk 1. 45 min 2. Progr essive 1. 70% VO 2 max 2. Progressive NA NA Timmons , 2010 TTC6 rs801 8889 14 37,353,342 0.09 473 Cauca sian M& F 1 7 – 65 20 wks 3×/wk 30 – 50 min 55 – 75% VO 2 max NA 5.25 × 10~ 5 Bouc hard, 2011 *DAAM1 rs1956197 (14:g.5947 7414C > T ) 14 58,547,167 0.16 1. 473 Cauc asian 2. 464 Cauc asian
1.M 2.F
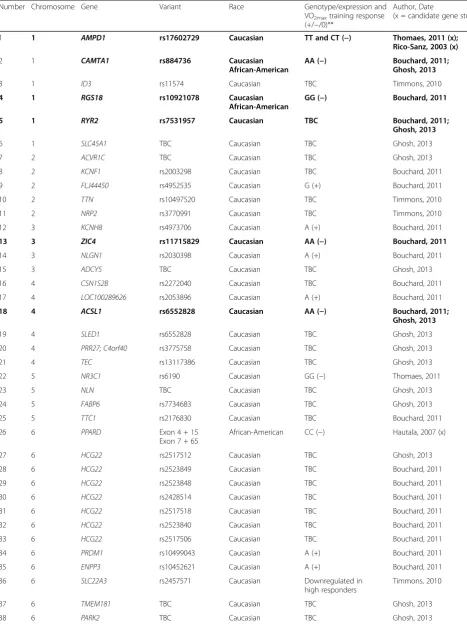
Table 4Predictor genes that may influence VO2maxtraining response
Number Chromosome Gene Variant Race Genotype/expression and
VO2maxtraining response (+/−/0)**
Author, Date
(x = candidate gene study)
1 1 AMPD1 rs17602729 Caucasian TT and CT (−) Thomaes, 2011 (x); Rico-Sanz, 2003 (x)
2 1 CAMTA1 rs884736 Caucasian African-American
AA (−) Bouchard, 2011; Ghosh, 2013
3 1 ID3 rs11574 Caucasian TBC Timmons, 2010
4 1 RGS18 rs10921078 Caucasian African-American
GG (−) Bouchard, 2011
5 1 RYR2 rs7531957 Caucasian TBC Bouchard, 2011;
Ghosh, 2013
6 1 SLC45A1 TBC Caucasian TBC Ghosh, 2013
7 2 ACVR1C TBC Caucasian TBC Ghosh, 2013
8 2 KCNF1 rs2003298 Caucasian TBC Bouchard, 2011
9 2 FLJ44450 rs4952535 Caucasian G (+) Bouchard, 2011
10 2 TTN rs10497520 Caucasian TBC Timmons, 2010
11 2 NRP2 rs3770991 Caucasian TBC Timmons, 2010
12 3 KCNH8 rs4973706 Caucasian A (+) Bouchard, 2011
13 3 ZIC4 rs11715829 Caucasian AA (−) Bouchard, 2011
14 3 NLGN1 rs2030398 Caucasian A (+) Bouchard, 2011
15 3 ADCY5 TBC Caucasian TBC Ghosh, 2013
16 4 CSN1S2B rs2272040 Caucasian TBC Bouchard, 2011
17 4 LOC100289626 rs2053896 Caucasian A (+) Bouchard, 2011
18 4 ACSL1 rs6552828 Caucasian AA (−) Bouchard, 2011; Ghosh, 2013
19 4 SLED1 rs6552828 Caucasian TBC Ghosh, 2013
20 4 PRR27; C4orf40 rs3775758 Caucasian TBC Ghosh, 2013
21 4 TEC rs13117386 Caucasian TBC Ghosh, 2013
22 5 NR3C1 rs6190 Caucasian GG (−) Thomaes, 2011
23 5 NLN TBC Caucasian TBC Ghosh, 2013
24 5 FABP6 rs7734683 Caucasian TBC Ghosh, 2013
25 5 TTC1 rs2176830 Caucasian TBC Bouchard, 2011
26 6 PPARD Exon 4 + 15
Exon 7 + 65
African-American CC (−) Hautala, 2007 (x)
27 6 HCG22 rs2517512 Caucasian TBC Ghosh, 2013
28 6 HCG22 rs2523849 Caucasian TBC Bouchard, 2011
29 6 HCG22 rs2523848 Caucasian TBC Bouchard, 2011
30 6 HCG22 rs2428514 Caucasian TBC Bouchard, 2011
31 6 HCG22 rs2517518 Caucasian TBC Bouchard, 2011
32 6 HCG22 rs2523840 Caucasian TBC Bouchard, 2011
33 6 HCG22 rs2517506 Caucasian TBC Bouchard, 2011
34 6 PRDM1 rs10499043 Caucasian A (+) Bouchard, 2011
35 6 ENPP3 rs10452621 Caucasian A (+) Bouchard, 2011
36 6 SLC22A3 rs2457571 Caucasian Downregulated in
high responders
Timmons, 2010
37 6 TMEM181 TBC Caucasian TBC Ghosh, 2013
Table 4Predictor genes that may influence VO2maxtraining response(Continued)
Number Chromosome Gene Variant Race Genotype/expression and
VO2maxtraining response (+/−/0)**
Author, Date
(x = candidate gene study)
39 6 SNX14 TBC Caucasian TBC Ghosh, 2013
40 6 BTBD9 TBC Caucasian TBC Ghosh, 2013
41 6 KCNQ5 TBC Caucasian TBC Ghosh, 2013
42 7 HDAC9 rs3814991 Caucasian TBC Bouchard, 2011
43 7 WBSCR17 rs12538806 Caucasian TBC Bouchard, 2011
44 7 WBSCR17 rs13235325 Caucasian TBC Bouchard, 2011
45 7 CPVL rs4257918 Caucasian TBC Timmons, 2010
46 7 ITGB8 rs10265149 Caucasian TBC Ghosh, 2013
47 7 LHFPL3 TBC Caucasian TBC Ghosh, 2013
48 8 DEPDC6 rs7386139 Caucasian TBC Timmons, 2010
49 8 PINX1 TBC Caucasian TBC Ghosh, 2013
50 9 GRIN3A rs1535628 Caucasian TBC Bouchard, 2011
51 9 GRIN3A rs959066 Caucasian TBC Bouchard, 2011
52 9 C9orf27 rs12115454 Caucasian G (+) Bouchard, 2011
53 9 TTLL11 rs7022103 Caucasian TBC Ghosh, 2013
54 9 KCNT1 TBC Caucasian TBC Ghosh, 2013
55 10 FAM238B; LOC731789 rs11015207 Caucasian TBC Ghosh, 2013
56 10 PRKG1 TBC Caucasian TBC Ghosh, 2013
57 10 SVIL rs6481619 Caucasian TBC Timmons, 2010
58 10 BTAF1 rs2792022 Caucasian TBC Timmons, 2010
59 10 CASC2 rs1413184 Caucasian TBC Ghosh, 2013
60 11 H19 rs22551375 Caucasian Upregulated in
high responders
Timmons, 2010
61 11 LOC100130460 rs2198009 Caucasian A (+) Bouchard, 2011
62 11 DBX1 rs10500872 Caucasian A (+) Bouchard, 2011
63 11 CD44 rs353625 Caucasian TBC Bouchard, 2011;
Ghosh, 2013
64 11 CXCR5 (36 kb) rs4938561 Caucasian TBC Bouchard, 2011
65 11 CXCR5 (24 kb)/BLR1 rs7933007 Caucasian TBC Bouchard, 2011
66 11 CD6 rs175098 Caucasian TBC Ghosh, 2013
67 11 SHANK2 rs10751308 Caucasian TBC Ghosh, 2013
68 11 GRIK4 TBC Caucasian TBC Ghosh, 2013
69 11 CNTF rs1800169 Caucasian AA (+) Thomaes, 2011 (x)
70 11 CAT -262C > T Caucasian TT (−) Onkelinx, 2011 (x)
71 11 GSTP1 c.313A > G (rs1695) Caucasian GG & AG (+) Zarebska, 2014 (x)
72 12 FAM19A2 rs2168452 Caucasian TBC Ghosh, 2013
73 12 C12orf36 rs12580476 Caucasian TBC Bouchard, 2011
Ghosh, 2013
74 13 NALCN TBC Caucasian TBC Ghosh, 2013
75 13 MIPEP rs7324557 Caucasian TBC Timmons, 2010
76 13 EEF1DP3 rs2773968 Caucasian TBC Ghosh, 2013
77 13 CLYBL NA Caucasian TBC Ghosh, 2013
78 13 Na +−K +−ATPaseα2 Alpha2 exon 1 Alpha2 exon 21–22
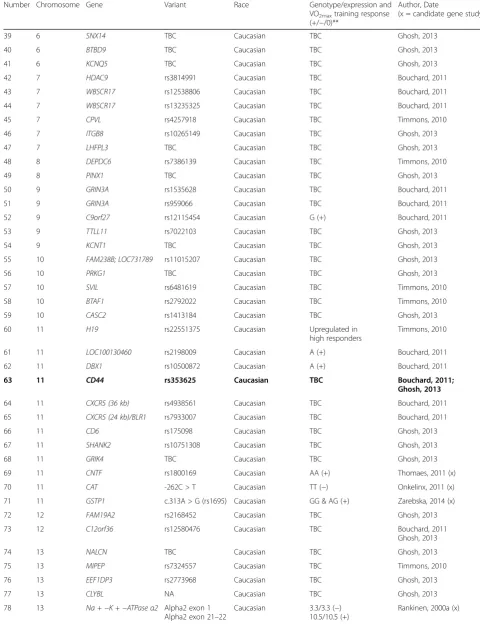
Caucasian 3.3/3.3 (−) 10.5/10.5 (+)
genotype, n= 21) in the ciliary neurotrophic factor gene (CNTF; rs1800169) and the AMPD1:c.133C wild type (CC genotype,n= 652) of the adenosine monophosphate deaminase gene (AMPD1; rs17602729). Furthermore, a larger change in relative VO2peak was reported in
pa-tients with a greater number of these variants described (Area Under the Curve (AUC): 0.63; 95% Confidence Interval (CI): 0.56–0.7; p< 0.01). More specifically, those with a gene predictor score (GPS) of one or less positive response alleles had an average increase in VO2peak of
16.7%. Those with four or more positive response alleles had an average increase of 25%, with each positive re-sponse allele contributing approximately 1% (13.5 mL/ min) to the increase in VO2peak.
Caucasians aged between 17 and 65 years from the HERITAGE study who were homozygous (TT genotype) for the AMPD1:c.133C > T (p.(Gln45*)) (rs17602729) variant (n= 6), had a lower VO2max training response
(<121 mL/min; p= 0.006), compared to the CT and CC
genotypes (n= 497) following 20 weeks of MICT (3 × 50 min per week at 55–75% HRmax) [46].
The serine/threonine protein kinase 1 (AKT1) gene has been linked to growth and skeletal muscle differenti-ation [44]. In a study of 109 Caucasians (50–75 years old), men (n= 22) with the AKT1:c.-350G > T (rs1130214) variant (TT/GT genotype) significantly in-creased their VO2maxcompared to men (n= 29) with the
GG genotype (fold increase of 1.2 ± 0.02 vs 1.1 ± 0.02,p = 0.037) following 24 weeks of MICT (3 × 20–40 min per week at 50–75% HRR) [44].
The glutathione S-transferase P1 (GSTP1) c.313A > G variant has been associated with an impaired ability to re-move excess reactive oxygen species. This is hypothesised to increase the exercise training response by better activa-tion of cell signalling pathways resulting in positive muscle adaptations [45]. While investigating 62 Polish females’ (19–24 years-old) response to 12 weeks of MICT (3 × 60 min per week at 50–75% HRmax), participants (n= 30)
Table 4Predictor genes that may influence VO2maxtraining response(Continued)
Number Chromosome Gene Variant Race Genotype/expression and
VO2maxtraining response (+/−/0)**
Author, Date
(x = candidate gene study)
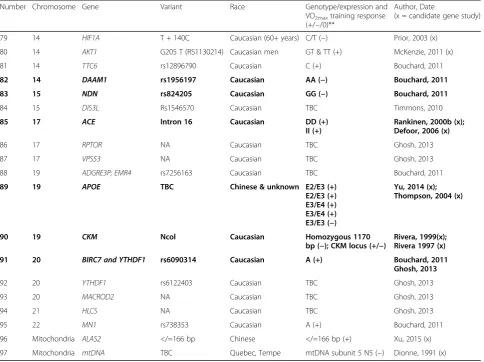
79 14 HIF1A T + 140C Caucasian (60+ years) C/T (−) Prior, 2003 (x)
80 14 AKT1 G205 T (RS1130214) Caucasian men GT & TT (+) McKenzie, 2011 (x)
81 14 TTC6 rs12896790 Caucasian C (+) Bouchard, 2011
82 14 DAAM1 rs1956197 Caucasian AA (−) Bouchard, 2011
83 15 NDN rs824205 Caucasian GG (−) Bouchard, 2011
84 15 DIS3L Rs1546570 Caucasian TBC Timmons, 2010
85 17 ACE Intron 16 Caucasian DD (+)
II (+)
Rankinen, 2000b (x); Defoor, 2006 (x)
86 17 RPTOR NA Caucasian TBC Ghosh, 2013
87 17 VPS53 NA Caucasian TBC Ghosh, 2013
88 19 ADGRE3P; EMR4 rs7256163 Caucasian TBC Bouchard, 2011
89 19 APOE TBC Chinese & unknown E2/E3 (+)
E2/E3 (+) E3/E4 (+) E3/E4 (+) E3/E3 (−)
Yu, 2014 (x); Thompson, 2004 (x)
90 19 CKM Ncol Caucasian Homozygous 1170
bp (−); CKM locus (+/−)
Rivera, 1999(x); Rivera 1997 (x)
91 20 BIRC7 and YTHDF1 rs6090314 Caucasian A (+) Bouchard, 2011 Ghosh, 2013
92 20 YTHDF1 rs6122403 Caucasian TBC Ghosh, 2013
93 20 MACROD2 NA Caucasian TBC Ghosh, 2013
94 21 HLCS NA Caucasian TBC Ghosh, 2013
95 22 MN1 rs738353 Caucasian A (+) Bouchard, 2011
96 Mitochondria ALAS2 </=166 bp Chinese </=166 bp (+) Xu, 2015 (x)
97 Mitochondria mtDNA TBC Quebec, Tempe mtDNA subunit 5 N5 (−) Dionne, 1991 (x)
Where possible, gene variants were annotated using the references sequence (GRCh37/hg19) Bolded = genes that have been replicated between or within studies
**(+) = high training response, (−) = low training response, (0) = neutral training response,TBCto be confirmed whether variant contributes to a high or low
with theGSTP1:c.313A > G (GG + GA genotype) demon-strated a 2 mL/kg/min greater improvement in VO2max
compared to AA genotypes (n= 5) following training (ab-solutep= 0.029, relativep= 0.026, effect size = 0.06) [45].
Genes associated with electrolyte balance
The electrogenic transmembrane ATPase (NA+/K + −ATPase) gene may contribute to VO2max trainability by
affecting the electrolyte balance and membrane excit-ability in working muscles [24]. Examining Caucasian data from the HERITAGE study, it was found that those homozygous for a recurrent 3.3-kb deletion in the exon 1 of the ATP1A2 gene (n= 5) had a 41% (45 mL/min) lower training response compared to heterozygotes (n= 87) [24]. This exon encodes on part (alpha-2-subunit) of
the Na+/K + ATPase protein. This genotype also had a
48% (197 mL/min) lower VO2maxtraining response than
homozygotes (n= 380) for a repeated 8.8-kb in the exon 1 of the ATP1A2 gene following 20 weeks of MICT (p= 0.018) [24]. VO2max gains were 29% (130 mL/min)
and 39% (160 mL/min) greater in offspring homozygous for a 10.5-kb deletion in exon 21–22 (n= 14) compared to heterozygotes (n= 93) and homozygotes (n= 187) re-spectively (p= 0.017) [24].
The angiotensin-converting enzyme (ACE) gene con-tributes to blood pressure, fluid and salt balance [55]. Elite endurance athletes are more likely to have the In-sertion (I) allele [56] which relates to lower ACEactivity and reduced blood pressure response during exercise,
whereas sprint/power athletes are more likely to have the Deletion (D) allele and the DD genotype [57] and subsequently higher ACE activity. Caucasians from the CARAGENE study with the homozygous II genotype (frequency of 0.23 and 0.18 for men and women respect-ively) had a 2.1% greater VO2max training response (p=
0.047) compared to the DD genotype (frequency of 0.3 and 0.36 for men and women respectively) [31]. When eliminating those on ACE inhibitors, the improvement increased by 3% (p= 0.013) [31]. On the other hand, VO2max trainability was 14–38% greater (p= 0.042) in
HERITAGE Caucasian offspring with the DD genotype (n= 81) [25]. Three studies found no association with ACE or angiotensinogen genetic variants and VO2max
training response in 53 Caucasians (average age 19 years) following 12 weeks of military training [47]; 147 multi-ethnic 19–24 year-old adults following 8 weeks of mili-tary training [39]; and 83 Brazilian policemen (average age 26 years) following 17 weeks of MICT (3 × 60 min per week at 50–85% VO2peak) [48].
Genes associated with lipid metabolism
Genotypes of the perilipin (PLIN1) gene may influence training response via intracellular lipolysis and energy production [43]. In 101 Caucasians (50–75 years old), there were no significant differences between carriers and non-carriers of the PLIN1:c.504 T > A variant (rs1052700) after 24 weeks of MICT (20–40 min, 3 × per week) [43].
The peroxisome proliferator activated receptor delta (PPARD) gene affects fatty acid oxidation and energy production [22]. African-Americans (n= 19) from the HERITAGE study with the PPARD exon 4 + 15 (CC genotype) had a significantly lower VO2max training
re-sponse (> 50 mL/min lower; p = 0.028) and power out-put (> 15 W lower; p= 0.005) compared to the C/T and TT genotypes (n= 230) [22].
Apolipoprotein E (APOE) variants affect the level of lipids in the blood, cell lipid uptake and endothelial vas-cular dilation [23].APOEhas 3 common alleles: E2 (TT/ TT), E3 (TT/CC), E4 (CC/CC) at two SNPs (rs429358, rs7412), which can create six possible genotypes (E2/E2, E3/E3, E4/E4, E2/E3, E2/E4, E3/E4) [58]. TheAPOE E4 allele has been associated with Alzheimer’s disease [59], higher levels of low density cholesterol (LDL-C) and a greater risk of coronary heart disease compared to E3 (wild-type) and E2 carriers [23]. Chinese men (18– 40 years) with the APOEE2/E3 (n= 20) and E3/E4 (n= 31) genotypes had a significantly higher VO2maxtraining
response (Odds Ratio (OR) = 0.68 (95% CI (0.04, 1.32);p = 0.04 and OR = 0.60 (95% CI (0.09, 1.11); p= 0.02 re-spectively) compared to otherAPOEgenotypes following 6 months of progressive MICT (3 x per week at 60–85% VO2max) [13]. Similarly, Chinese women (18–40 years)
with theAPOEE2/E3 (n= 25) and E3/E4 (n= 29) geno-types had significantly higher VO2maxtraining responses
compared to otherAPOEgenotypes (OR = 0.62 (95% CI = 0.05, 1.18);p= 0.03 and OR = 0.62(95% CI = 0.09,1.15); p= 0.02 respectively) [13]. Men and women (ethnicity unknown) with the E3/E3 APOE genotype (n= 43) had an 8% lower training response compared to the E2/E3 (n= 40) and E3/E4 genotypes (n= 37) (p< 0.01, Bonferroni-corrected) following 6 months of MICT (4 × 50 min per week at 60–85% VO2max) [42]. However,
there was no significant difference in the VO2max
train-ing response between APOE genotypes in men and women from the HERITAGE study (n= 766) [23]. Simi-larly, in 51 males (40–80 years old, ethnicity not con-firmed) there was no difference in VO2max training
response between genotypes [41].
Genes associated with oxidative phosphorylation and energy production
Mitochondrial DNA (mtDNA) encodes several enzyme subunits involved in oxidative phosphorylation, and may be a key factor in endurance and cardiorespiratory fit-ness [56]. Research of mtDNA variants in 41 inactive Japanese men (mean age 20.6) failed to find a significant difference in trainability after 8 weeks of MICT (3– 4 × 60 min per week at 70% VO2max) [49]. On the
con-trary, 3 men (17–25 years) with the mtDNA variant in subunit 5 of ND5 had a lower VO2maxtraining response
compared to other mtDNA variants (~ gain 0.22 L/min
less, p< 0.05) following 12-weeks of MICT (3–5 × 45 min per week at 85%HRRmax) [50].
The creatine kinase muscle (CKM) gene has been as-sociated with reduced fatigue from increased adenosine triphosphate (ADP) production [26, 27]. Using data from the HERITAGE study, parents and offspring homozygote for the 1170 bp allele (n= 12) had a lower VO2max
train-ing response (3 times and 1.5 times lower respectively;p < 0.05) compared to other CKM genotypes (n= 148). This explained 9 and 10% of the inter-individual vari-ation in VO2max change respectively [26]. A nominal
genetic linkage was identified in siblings (n= 277) who shared two alleles (1170 base pairs or 985 + 185 base pairs) at theCKMlocus identical by descent (IBD), with these siblings having similar changes in VO2max
com-pared to siblings with fewer alleles IBD (p= 0.04) [27]. In an earlier study focusing on muscle specific inherited variations, no association was found in 295 Caucasians (18–30 years old) between CKM or adenylate kinase (AK1) variants after a randomized control trial that in-cluded 15 weeks of endurance training versus maximal power contraction interval training [40]. Similarly, no as-sociation was found with the CKM gene and VO2max
trainability in 937 Caucasian patients with coronary ar-tery disease following 3 months of MICT (2–3 × 90 min aerobic sessions per week at 80% HRmax) [29].
Nuclear respiratory factor 1(NRF1) and nuclear factor (erythroid-derived 2)-like 2 (NFE2L2) [36, 37], contrib-ute to mitochondrial biogenesis and oxidative phosphor-ylation [60]. In a study involving 102 physically active Chinese male soldiers (average age 19 years), there was no association betweenNRF1and NFE2L2 genotypes or haplotypes and VO2maxtrainability after 18 weeks of 3 ×
5000 m runs per week at 95–105% VT [36, 37].
Genes associated with oxygen delivery
Nitric oxide causes coronary and arterial vasodilation, contributing to oxygen delivery regulation [32]. Data from the CARAGENE study was used to investigate genes associated with nitric oxide bioavailability [32]. These included nitric oxide synthase 3 (NOS3), cyto-chrome b-245 alpha chain (CYBA, also known as p22-PHOX), glutathione peroxidase (GPX1), catalase (CAT), superoxide dismutase 3 (SOD3), vascular endothelial growth factor A (VEGFA), peroxisome proliferator-activated receptor alpha (PPARα) and peroxisome proliferator-activated receptor gamma coactivator-related 1 (PPARC1) [32]. Participants carrying the C al-lele of the CAT:c.262 T > C variant (n= 342) had up to 3.1% greater improvements in VO2maxtraining response