Vu:.'-^'
r
RESERVETHESIS 612.044 BUR
X
^^: i'^^ifia
WITH MAXIMAL ROWING PERFORMANCE
A thesis submitted in fulfilment of the requhements for the degree of Master of Apphed Science
Department of Chemistry and Biology Faculty of Apphed Science
by
Caroline M. Burge
1990
THE EFFECT OF DEHYDRATION AND REHYDRATION
ON PHYSIOLOGICAL PARAMETERS ASSOCIATED
WITH MAXIMAL ROWING PERFORMANCE
CAROLINE M. BURGE, MASTER OF APPLIED SCIENCE, 1990. THESIS SUPERVISORS: M.F. Carey and W.R. Payne
This study examined:
a) the effects of 24 hours of dehydration on body weight, plasma volume and various urinary variables and compared the efficacy of drinking water and solutions of varying sodium chloride concentration in restoring plasma volume after dehydration; and
b) the metabolic processes during performance in a maximal rowing trial following partial rehydration with water after rapid weight loss.
chloride solution respectively to drink during the rehydration period. The eight rowers were allocated water. Venous blood samples were obtained without stasis before and after dehydration and after rehydration to determine changes in plasma volume. Urinary electrolytes were analysed on urine collected over the 24 hour dehydration period. This procedure, however, apphed to the saline groups only. A control sample was collected during a similar 24 hour period without dehydration.
Body weight decreased 5.16 ± 0.14% for the rowers and 3.72 ± 0.18 % for the saline groups (p<0.05) after 24 hours of dehydration. Likewise, relative plasma volume decreased 12.5 ± 1.4 and 13.3 ± 0.6% for the rowers and saline groups respectively. There was no significant difference between the groups for this parameter. The calculation of the percent contribution of plasma volume to the change in total body water after dehydration demonstrated that the rowers lost significantly less plasma volume per unit loss of total body water than the saline groups (p<0.05).
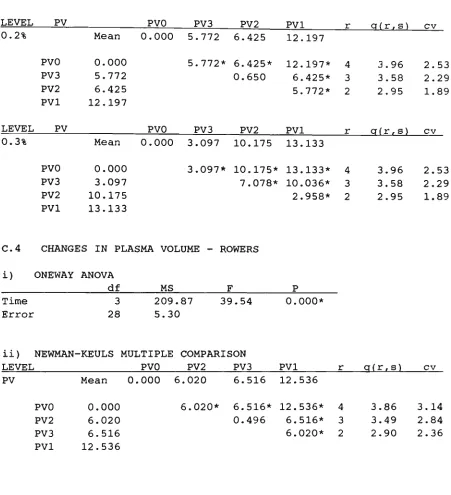
The ingestion of 1.5 litres of saline over a 90 minute period was associated with significant plasma volume increases of 4.80 ± 0.54%, 6.42 ± 0.65% and 10.17 ± 0.65% in the 0.1%, 0.2% and 0.3% sahne groups respectively (p<0.05). Each drink, however, left a significant plasma volume deficit after rehydration (p<0.05). The ingestion of water was associated with a plasma volume restoration of 6.02 ± 0.62% (p<0.05).
ACKNOWLEDGEMENTS
I wish to express my sincere gratitude to my co-supervisors, Michael
Carey and Warren Payne whose support, constructive criticism,
encouragement and assistance in their specialized areas have made the
completion of this thesis possible,
I also wish to express my gratitude to Bob Vinen (Head of the
Department of Chemistry and Biology) for the generous aUocation of
funds, staff and equipment. I also thank David Lawson (Head of the
Department of Physical Education and Recreation) for the use of the
Human Performance Laboratory and associated equipment without which this
research would not have been possible. A special thank you must be made
to the technical officers in the Physical Education Department, Ian
Fairweather and Peter Stephens. Their expertise is highly commended.
Thank you to Stephen Campbell and Vince Munroe of the Chemistry and
Biology Department, also for their exceUent technical expertise. I
also would like to thank Rod Snow and Iva Martin for their interest,
advice and encouragement.
To my subjects, who endured greatly "for the sake of science," I am
deeply indebted. Without your generous co-operation, this research
TABLE OF CONTENTS
Page
CHAPTER
1. GENERAL INTRODUCTION 1 2. REVIEW OF LITERATURE 7
2.1 Introduction 7
2.2 The effect of dehydration and rehydration
on haematological parameters 8
2.2.1 Dehydration and changes in plasma volume 8
2.2.2.1 Methods of rapid weight loss 10 2.2.1.2 Blood sampling technique and timmg .12
2.2.1.3 The measurement of plasma volume and
assumptions about vascular dynamics 14 2.2.1.4 Corrections and mathematical errors
in the calculation of relative plasma volume 17
2.2.2 The effect of rehydration on the restoration
of plasma volume 20 2.2.2.1 Rehydrating with water versus dilute
solutions of sodium chloride 21
2.3 The effect of dehydration on the urinary
excretion of sodium and potassium 25
2.4 The effect of dehydration and rehydration
on performance 25
2.4.1 Physical work capacity after dehydration 26 2.4.1.1 The effect of dehydration on endurance
CHAPTER Page
2.4.1.2 The effect of dehydration on anaerobic
performance 30 2.4.1.3 The effect of dehydration on strength
and muscular endurance 30
2.4.2 Physical work capacity after rehydration 32
2.5 The effect of dehydration on resphatory,
metabolic and cardiovascular variables 33
2.6 The effect of dehydration on muscle glycogen levels and utilization rate during
exercise 36
3. METHODS AND PROCEDURES
3.1 Introduction 42
3.2 The effect of 24 hours of dehydration on bodyweight, plasma volume and various
urinary variables 44 3.2.1 The Subjects 44 3.2.2 Pre-dehydration 45 3.2.3 Dehydration ...46
3.3 The efficacy of water and solutions of varying sodium chloride concentration in restoring
plasma volume after dehydration 47
3.4 Metabohc processes during performance in a maximal rowing trial following partial
CHAPTER Page
3.4.1 Post rehydration 48 3.4.2 The rowing trial .49
3.5 Analyses 50 3.5.1 Blood analyses ,50
3.5.2 Urine analyses 51 3.5.3 Muscle glycogen ,51 3.5.4 Metabolic measurements 52
3.6 Statistical analyses .53
4. THE EFFECT OF 24 HOURS OF DEHYDRATION ON BODYWEIGHT, PLASMA VOLUME AND URINE ELECTROLYTES ([K"*"! AND
[Na"""]) AND THE EFFECT OF REHYDRATION ON PLASMA VOLUME
4.1 Introduction 54
4.2 Results 59 4.2.1 The subjects ..59
4.2.2 The relationship between weight loss
and plasma volume decrease 60 4.2.3 Changes in urinary Volume, K"*" and Na"*"
following dehydration in the pooled
saline group 62 4.2.4 The efficacy of drinking water and
solutions of varying sodium chloride concentration in restoring plasma volume
after dehydration 63 4.2.5 Comparison of the efficacy of water
versus three saline solutions in restoring
CHAPTER Page
4.3 Discussion .69 4.3.1 Rapid weight loss and changes in plasma
volume 69 4.3.2 Training status and loss of plasma
volume after dehydration .73 4.3.3 The relationship between dehydration and
urine volume, K"*" and Na"*"
excretion 78 4.3.4 The restoration of plasma volume foUowing
rehydration 79
THE EFFECT OF 24 HOURS OF DEHYDRATION FOLLOWED BY PARTIAL REHYDRATION ON ROWING PERFORMANCE
5.1 Introduction .83
5.2 Results S5 5.2.1 Subjects 85 5.2.2 The trial times 85
5.2.3 The effect of dehydration on performance
during the trials 87 5.2.4 The effect of plasma volume changes on
performance 90
5.3 Discussion 93 5.3.1 Rowing performance and dehydration 53
6. THE EFFECT OF 24 HOURS OF DEHYDRATION FOLLOWED BY PARTIAL REHYDRATION ON METABOLIC AND
CARDIORESPIRATORY VARIABLES DURING A MAXIMAL ROWING TRIAL
6.1 Introduction 97
6.2 Results 58 6.2.1 Peak Cb^gen Consumption 99
6.2.2 Peak ventilation rate, maximum heart rate and average respiratory exchange ratio
during the trials 99 6.2.3 Blood Lactate Concentration .100
6.3 Discussion,..., 101 6.3.1 The effect of dehydration on the
cardiovascular system during exercise 101 6.3.2 Blood lactate accumulation, the respiratory
exchange ratio, and peak oxygen uptake
during the rowing trials 102
7. MUSCLE GLYCOGEN UTILIZATION IN A MAXIMAL ROWING TRIAL FOLLOWING DEHYDRATION
7.1 Introduction 107
7.2 Results 108 7.2.1 Muscle glycogen concentration 108
7.3 Discussion 109 7.3.1 Glycogen utilization rate during maximal
exercise in dehydrated subjects 109
CHAPTER Page
8. SUMMARY AND CONCLUSIONS 116
APPENDICES
A . INFORMED CONSENT STATEMENTS 119
Saline Groups
Standard consent form for subjects involved
in experiments 120 Cardiovascular and renal risk factor questionnaire 122
Procedures - Non-rowing group 123
Rowers
Standard consent form for subjects involved
in experiments 125 Cardiovascular and renal risk factor questionnaire 127
Muscle biopsy questionnaire 128 Procedures - Rowing group dehydration protocol 129
B. DETAILS OF ANALYTICAL CHEMICAL METHODS 131
B.l Blood lactate 132 B.2 Haemoglobin 134 B.3 Muscle glycogen 136 B.4 Urinary sodium and potassium concentration 137
D . DIARIES OF THE INDIVIDUAL SUBJECTS DURING THE
24 HOUR DEHYDRATION PERIOD 148
LIST OF FIGURES
FIGURE Page
4.1 Vector diagram showing the relationship
of APV3 to APVl and APV2 58
4.2 The relationship between %loss of bodyweight
and A P V l 61
4.3 The efficacy of drinking water in restoring
plasma volume after dehydration 65
4.4 The efficacy of increasing sodium chloride
concentration in restoring plasma volume 66
4.5 The efficacy of drmking water versus three sahne solutions in restoring plasma volume
after dehydration J68
5.1 The effect of dehydration on trial times 86
5.2 Cumulative flywheel revolutions 88
5.3 Non-cumulative flywheel revolutions 89
5.4 APVl versus increase in time to complete
the dehydrated trial 91
5.5 APV3 versus increase in time to complete
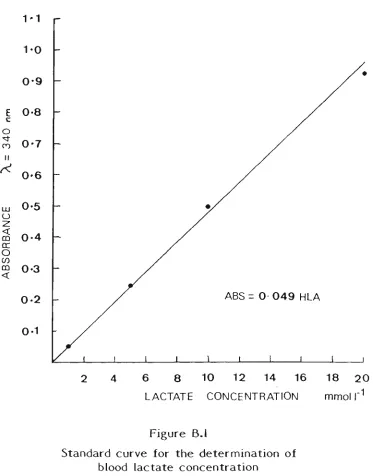
B.l Standard curve for the determination
of blood lactate concentration .133
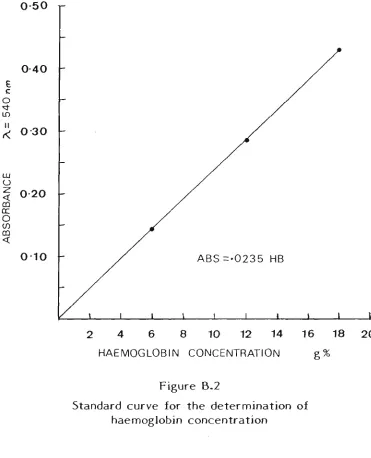
B.2 Standard curve for the determination
of haemoglobin concentration .135
B.3 Standard curve for the determination
of Na"*" concentration 138
B,4 Standard curve for the determination
LIST OF TABLES
TABLE Page
2.1 Methods of rapid weight loss 11
2.2 List of studies demonstrating the deleterious
effect of dehydration on physical work capacity 27
2.3 Estunated changes in muscle glycogen content (mmol kg"-^ D.W,) from graph presented in
CostiU and Saltin (1975) .40
3.1 Individual data for each drink group .44
4.1 Subject data 59
4.2 The effect of dehydration on various
urinary variables in the pooled saline group .62
4.3 Relative contribution of plasma volume decline to total body water loss for the rowers and
the pooled saline group 72
5.1 Individual data on plasma volume changes
TABLE Page
6.1 The effects of dehydration and subsequent rehydration on cardiorespiratory and metabolic
variables during a maximal rowing trial 98
7.1 Mean muscle glycogen concentration 108
C.l Number of cumulative flywheel revolutions versus time and hydration
i) Analysis of variance 141 ii) Simple main effects 141
C.2 Number of non-cumulative flywheel revolutions versus time and hydration
i) Analysis of variance 142 ii) Simple main effects 142
C.3 Changes in plasma volume - saline groups
i) Analysis of variance 143 ii) Simple main effects 143 iii) Newman-Keuls Post Hoc Analysis 143
C.4 Changes in plasma volume - rowers
i) Oneway analysis of variance 144 ii) Newman-keuls multiple comparison .144
C.5 Restoration of plasma volume - 0.1%, 0.2%, 0.3% saline and water
C.6 Sum of skinfolds - rowers and saline groups
Oneway analysis of variance 145
C.7 Height - rowers and sahne groups
Oneway analysis of variance 145
C,8 Age - rowers and saline groups
Oneway analysis of variance ,145
C.9 Pre-dehydration bodyweight - rowers and saline groups
Oneway analysis of variance ,145
CIO Post-dehdyration bodyweight - rowers and saline groups
Oneway analysis of variance .145
C.ll % loss of bodyweight - rowers and saline groups
i) Oneway analysis of variance 146 ii) Newman-keuls multiple comparison .146
C.12 Pre and Post trial lactate concentration versus hydration
i) Analysis of variance 146 ii) Simple main effects 146
C.13 Pre and Post trial glycogen concentration versus hydration
TABLE Page
C.14 Regression for APVl versus increase in trial time
Analysis of variance 147
C.15 Regression for A PV3 versus increase in trial time
GENERAL INTRODUCTION
"sweat runs" until the required weight is attained.
The F6d6ration Internationale des Soci6tes d'Aviron (F.I.S.A.) rules
of racing require that on the day of the race, the lightweight rower is
required to weigh-in not more than two hours and not less than one hour
before the advertised starting time of the event. If the rower
successfully weighs-in two hours before the event starting time, it
leaves approximately 90 minutes in which to attempt to rehydrate,
assuming 30 minutes or so are usually spent warming up on the water.
During this rehydration period, the rowers, having not eaten for quite
some time, usually elect to consume food and drink only to satiety,
rather than concentrating on drinking the quantity of fluid that is
required physiologically. It is likely, therefore, that lightweight
rowers are competing whilst in a significantly dehydrated state.
Anecdotal evidence exists that suggests that many coaches appear to
be adopting the pohcy of selecting crews with larger statures than
would normally have been selected for a lightweight crew. It is then
often necessary for the members to dehydrate before each race. It is
appropriate, therefore, to ask whether dehydration has a detrimental
effect on rowing performance. An examination of the available
literature demonstrated that the effect of dehydration on rowing
performance has not been reported previously. The major aim of the
present study, therefore, was to study the effect of rapid weight loss
a light sweat run the afternoon prior to the day of an "all-out" rowing
trial. Unhke the actual situation, however, subjects were rehydrated
using a structured fluid ingestion regimen for a 90 minute period, which
corresponds to the maximal time usually avaUable to the athlete to
rehydrate after the weigh-ui. During the rehydration period, 1.5 litres
of water were required to be consumed. The "dehydrated" rowing trial
was compared to a normal control trial conducted seven days apart using
a random crossover design. Physiological parameters associated with
metabohc function were measured during each trial,
A possible hmitation to the study is that performance may decrease
in the dehydrated trial due to psychological reasons. It is beheved,
however, that this was adequately controlled for by selecting subjects
who were training in a squad from which would be selected a crew to
represent Australia at the next World Championships, Dehydration
regimens, similar to the one used in the present study, also did not
present as a novel situation to any of the rowers.
Dehydration has been previously associated with a substantial
decrease in maximum physical work capacity (Saltin, 1964a, 1964b; Bosco
et al, 191 A), decreases in plasma and blood volume (CostiU and
Fink, 1974; CostUl and Sparks, 1974), stroke volume and cardiac output
(Saltin, 1964a, 1964b; Sproles et al, 1976). Anaerobic capacity
al, 1984).
The loss of water after dehydration is replaced most conveniently by
the oral consumption of fluids. The efficacy of a fluid for rehydration
and the subsequent restoration of plasma volume is affected by the
factors listed below:
a) Gastric emptying rate slows as the energy content of the
drink increases (Brener, 1983; Hunt and Stubbs, 1975; Shafer
e^fl/., 1985);
b) Hypotonic saline solutions (0.2-0.4% w/v) enhanced gastric
emptying rate compared to distilled water (Hunt and Pothak,
1960);
c) Thirst is not a rehable indicator of hydration status
(CostiU and Sparks, 1973; Nielsen et al, 1984a, Seckle
e^fl/., 1986); and
d) The fluid must be sufficiently palatable to encourage a
maximum volume of fluid to be consumed (White and Ford,
1983).
This study, therefore, also observed the effect of rehydrating with
three saline solutions, up to a maximum concentration of 0.3% w/v, on
particular note, position statements condemning the practice have been published by the American Medical Association (1956, 1967) and by the American College of Sports Medicine (1976). The following extracts have been obtained from the position statement issued by the latter organization in relation to wrestling practices:
...Under existing rules and practices, it is not uncommon for an individual to repeat this weight-losing process many times during the season because successful wrestlers compete in 15 to 30 matches per year...Even when one to five hours are allowed for purposes of rehydration after the weigh-in, this time is insufficient for fluid and electrolyte homoeostasis to be com-pletely re-established...Officials should realize that the singular effects of these practices are associated with 1) a reduction in muscular strength; 2) a decrease in work perform-ance times; 3) lower plasma and blood volumes; 4) a reduction in cardiac functioning...6) an impairment of thermoregulatory processes; 7) a decrease in renal blood flow.... Therefore, it is the position of the American College of Sports Medicine that the potential health hazards created by the procedure used to make weight...can be eliminated if state and national organiza-tions will...3) Discourage the practise of fluid deprivation and dehydration. This can be accomplished by: a) Educating the coaches and wrestlers on the physiological and medical complica-tions that can occur as a result of these practices; b) Prohib-iting the single or combined use of rubber suits, steam rooms, hot boxes, saunas, laxatives, and diuretics to "make weight"; c) Scheduling weigh-ins just prior to competition; d) Schedul-ing more official weigh-ins between...matches.
decrease performance and place a great deal of physiological stress on, in particular, the renal and thermoregulatory systems. The Austrahan Rowing CouncU, however, have issued guidelines early in 1988 on drugs in sport and advised that athletes testing positive for diuretic use would face a life ban from participation in competitive rowing. The ban
REVIEW OF LITERATURE
2.1. INTRODUCTION
The volume of literature published over the last eighty years,
related in one way or another to dehydration and athletic performance,
is very large. Unfortunately, most of the work involvmg dehydration
has been done in conjunction with a thermal stress and heat
acclimatization, which has largely comphcated the issue. Further, a
lack of consistency ui experimental design has made comparison between
relevant studies difficult.
This review focuses on the following areas:
a) The effect of dehydration and rehydration on haematological
parameters;
b) The effect of dehydration on the urinary excretion of potassium and
sodium
c) The effect of dehydration and rehydration on exercise performance;
d) The effect of dehydration on metabolic, cardiovascular and
respiratory parameters during exercise;
e) The effects of dehydration on muscle glycogen utUization during
2.2. THE EFFECT OF DEHYDRATION AND
REHYDRATION ON HAEMATOLOGICAL
PARAMETERS
It is most common to use haematological parameters as indices of
dehydration. Because the blood and its components are so dynamic,
results based upon blood tests are frequently subject to errors due to
the following factors:
a) postural effects on plasma volume;
b) the assumption that plasma protein remains in the vascular
space; and
c) the assumption that mean corpuscular volume remains constant
despite changes in plasma osmolality.
The effect of dehydration on plasma volume along with potential errors
in the measurement of plasma volume will be discussed in detaU
subsequently.
2.2.1. Dehydration and change in plasma volume
The most obvious effect of dehydration is a consequent decrease in
plasma volume (CostiU and Fink, 1974; CostiU and Sparks; 1973;
Mnatzakanian and Vaccaro, 1986), its measurement has been a basic
inclusion in many dehydration methodologies. The results have varied
enormously from one study to another. For example, in studies reporting
an approximate 5% loss of bodyweight, the decrease in plasma volume has
been reported to vary from 25% (Saltin, 1964c) to 6% (Sawka et al,
1984a). For a 4% loss of body weight, plasma volume has been reported
to decrease 16% (CostiU and Fink, 1974) to only 5% (Sawka et al.,
1984b; Candas et al, 1986), Even within the studies themselves,
large individual differences have been regularly reported (CostUl and
Fink, 1974; Saltin, 1964c; Sawka et al, 1984a). Four reasons become
apparent and can account for the range of results, viz:
a) the weight loss methodologies vary widely;
b) blood sampling techniques are mconsistent;
c) unjustified assumptions are being made about vascular
dynamics; and
2.2.1.1. Methods of rapid weight loss
Dehydration regimens to lose weight have varied widely. The amount
of weight loss reported has varied from 1-2 percent loss of body weight
(Armstrong et al, 1985a) up to a loss of 7-11 percent of bodyweight
(Tipton and Tcheng, 1970). The regimens have also varied widely in the
time frames in which the weight was lost. In the study by Torranin et
al (1979), the subjects were exposed to heat for two hours and
experienced a bodyweight loss of 4-5%. On the other hand, CaldweU et
al (1984) induced this level of weight loss in 48 hours using
exercise induced dehydration. Finally, the methods used to induce the
weight loss vary greatly. All weight loss regimens studied, included
one, some or all of the foUowing procedures: thermal exposure,
exercise, fluid restriction, starvation and the administration of a
diuretic. Even within a single mode of weight loss, variation in the
methodologies has been considerable. Thermal exposures, for example,
have varied in the length of exposure, whether the exposures were
continuous or intermittent, whether the subject was heat acclimatized
and/or trained, the temperature and relative humidity that was used and
whether the exposure was passive or involved exercise. The exercise
also varied in intensity, modality, posture and duration. All of the
other techniques, e.g. diuretics, also involve a huge spectrum of
variation. Some methodologies that have been used to induce weight loss
TABLE 2.1 Methods of rapid weight loss
Author Method
Biljani era/., 1980 Buskirk era/., 1958 CaldweU e/a/., 1984
Candas etal, 1986
CostUl, 1977
Nielsen e^fl/., 1981 Saltin, 1964b
Saltin, 1964c
CaldweU ^r a/., 1984 CostUl and Saltin, 1973 Kirsch era/., 1981 Nadel, 1980
Nielsen era/., 1981 Saltm, 1964a
Saltm, 1964b
CostiU and Fink, 1974 CostUl era/., 1976a
Cmig etal, 1966
Klinzing and Karpowicz, 1986
Armstrong et al, 1985a CaldweU e/a/., 1984 Claremont et al, 1976 Nielsen e/a/., 1981
BeU et al, 1982 Houston era/., 1981
Klinzing and Karpowicz, 1986 Turtle, 1943
Widermanera/., 1982
Heat exposure
Exercise
Exercise with heat exposure
Diuretics
Food and water restriction alone or in combination with other methods
Each methodology that is hsted in Table 2.1 can cause a different
haemodynamic response (CaldweU et al, 1984; Claremont et al,
1976; Lamb and Brodowicz, 1986). In addition, the blood sampling
technique and/or timing can result in a variation greater than the
effect of the experimental protocol. This problem will be discussed in
2.2.1.2. Blood sampling technique and timing
A loss of 11-15% of plasma volume has been demonstrated to occur
when movuig from a supine position to a motionless upright position
(Thompson et al, 1928; Waterfield, 1931). This compares to the
changes in intravascular volume of a magnitude similar to that produced
by thermal stress and exercise. Hagen et al (1978, 1980) stated
that some of the published data relating to plasma volume changes with
heat and exercise may be incorrect through a faUure to account for
effects of posture. In spite of this observation, except the studies of
Fawcett and Wynn (1960) and Eisenburg (1963), the possibUity of
measurements of intravascular volume responses to heat and exercise
being confounded by changes in posture has not been addressed, as
pointed out by Sarehus (1979) and Harrison (1985).
If blood is taken from the antecubital vein of a pendent arm and
compared with blood taken previously from the same arm in a horizontal
position, the haematocrit is greater in the pendent position, as a
result of blood pooling, by an amount equivalent to a 4% decrease in
blood volume (Eisenberg, 1963). Further, it has been observed that if
blood is sampled with the assistance of a torniquet (average length of
time with stasis before sampling was five seconds) the apparent plasma
volume decreases also by approximately 4% compared to the other arm,
which was sampled simultaneously without stasis (C.M.Burge, unpublished
A number of studies did not take into account the effects of acute
exercise on plasma volume (DiU et al, 1930; Myhre et al,
1982). Most commonly, exercise results in haemoconcentration (Bock et
al, 1927; Edwards et al, 1983; Greenleaf et al, 1979b;
Harrison, 1985), or more rarely haemodilution (CuUumbine and Koch,
1949; Senay, 1972). The extent of these changes is dependent upon the
exercise modality, intensity and postural position adopted during the
exercise (Kaltreider and Meneely, 1940; Senay et al, 1980; Hagen
et al, 1978; Harrison 1985). On cessation of the exercise, plasma
volume rapidly returns towards pre-exercise levels and these changes are
completed within 60 minutes post-exercise (Greenleaf et al, 1979b;
Harrison et al, 1975). Acute thermal exposure also produces
changes in plasma volume. On cessation of the exposure, plasma volume
returns towards pre-exposure levels over approximately the same time
span or less than that required for plasma volume recovery after
exercise (Harrison et al, 1983). If blood is sampled during these
transitory phases, the true equUibrated plasma volume status would not
be measured.
In a review by Harrison (1985), reference is made to eight studies
in which the results should be interpreted with care on the following
grounds:
a) the effects of exercise and posture could not be distinguished (DiU
et al, 1930; Myhre et al, 1982);
b) control blood samples were taken with subjects reclining (CostUl
al, 1977) and then compared with samples taken during upright
exercise; and
c) the body position in which the control blood sample was taken was
not stated (Greenleaf ef al, 1978; Maron et al, 1975).
Subsequent to the Harrison review, three further studies have been
published about which simUar reservations can be held. On simUar
grounds, Candas et al (1986, 1988) did not state the body position
in which the control blood sample was taken. Nose et al (1988a)
compared a control sample taken in a thermoneutral environment to a
sample taken ten minutes post-exercise in a hot environment after the
subjects had been relocated (it is not stated how they were transported
and it may be they walked) back to the thermoneutral chamber.
2.2.13. The measurement of plasma volume and assumptions
about vascular dynamics
The measurement of plasma volume, in itself, has aroused much
scientific scrutiny and criticism. Much early work measured changes in
plasma volume directly by dye and isotope dUution methods (Kozlowski
and Saltin, 1964; Fortney et al, 1981). Many studies tagged plasma
protein, assuming that the protein did not leave the vascular space.
Saltin (1964c) determined plasma volume with Evan's blue dye (T-1824),
according to the method described by Von Porat (1951) and Wiklander
(1956). Because it has been demonstrated that plasma protein leaves the
1963), the results of any research using tagged plasma protein to
determine changes in plasma volume are doubtful and should be
interpreted with care.
Of greater relevance to the accompanying research, is the
measurement of relative changes in plasma volume. The principle of
measuring relative plasma volume change assumes that the red cell is
unable to leave the vascular space and that there is no significant
addition of red cells from storage sites such as the spleen in humans
(CostiU and Saltin, 1974a; Von Fricke, 1965; Nylin, 1947; Uehhnger and
Bohhnan, 1961). Two schools of thought exist with respect to its
measurement (Dill and CostiU, 1974; Van Beaumont et al, 1972).
There is a controversy whether haematocrit ratios alone can be used to
measure relative changes in plasma volume (Van Beaumont, 1972) or
whether haemoglobin concentration also must be taken into account (Dill
and CostiU, 1974).
Van Beaumont (1972), indicated that change in plasma volume could be
calculated, using the assumption that red blood cell volume remains
constant, by change in haematocrit ratios (Hct) as follows:
100
% change PV = x 100 100 - Hctp^^
* pre post'
The assumption that red cell volume is stable even with changes in
plasma osmolality has been criticized (Harrison, 1985), although Van
Beaumont and colleagues have defended their stance in several studies
(Van Beaumont et al, 1972; Van Beaumont, 1973; Van Beaumont, 1974;
Greenleaf et al, 1979a; Greenleaf et al, 1979b; Van Beaumont
era/., 1981).
CostiU and Saltin (1974a) raised questions about Van Beaumont's
three major assumptions used in the calculation of changes in plasma
volume: i.e.;
a) that the total volume of circulating erythrocytes remained
constant;
b) that the size of individual erythrocytes did not change; and
c) that the ratio between venous haematocrit and whole body
haematocrit (F-cell ratio) remains unchanged with
dehydration.
The research of CostUl and Saltin (1974a) showed that both points (a)
and (c) remained true after a 4% loss of body weight. A discrepancy
between measured (-'^•^^I) and calculated changes in plasma volume,
however, suggested that shrinkage of red blood cells may have occurred
leading to an under-estimation of the venous haematocrit and subsequent
calculation of the percent change in plasma volume (PV). DUl and
CostUl (1974) and CostiU and Fink (1974) later confirmed that red ceU
To correct for changes in red blood ceU volume, the ratio of
haemoglobin (Hb) pre- to post-treatment should be included m the
calculation in addition to the haematocrit ratios (Elkinton et al,
1946; DUl and CostiU, 1974) as follows:
% change PV = 100 x
Hb^^^ (100 - Hct . )
pre ' post' Hb post (100 - « = V e >
- 100
(Dill and Costill, 1974)
Many authors have opted for the DiU and CostiU equation for
calculation of relative changes in plasma volume in their studies
(CoUins et al, 1986; CostiU et al, 1981; Fortney et al,
1981; Nadel et al, 1980; Pivarnic et al, 1986; Pivarnic and
Senay Jr., 1986; Pivarnikera/., 1988).
2.2.1.4. Corrections and mathematical errors in the
calculation of relative plasma volume
Haematocrit ratios are often multiplied by one and sometimes two
correction factors. The correction factors most commonly used correct
for trapped plasma and for the fact that the haematocrit averaged over
the whole body is less than the haematocrit of venous blood (F-ceU
ratio). Harrison et al, (1982) performed a mathematical appraisal
to the calculation of relative plasma volume using the equation of Dill
and CostiU (1974).
The first correction factor considered was the effect of correcting
for trapped plasma, the usual value being 0.96. The use of this
correction factor had a negligible effect on percent change of plasma
volume. Further, the error introduced by not correcting was much less
than the random variability caused by measurement errors in haematocrit
and haemoglobin (Harrison et al, 1982). In addition, the
correction factor using the microhaematocrit method also may be nearer
to 0.98 (Garby and VuiUe, 1961) than the 0.96 conventionally adopted.
Therefore, because the error arising from the neglect of the effects of
trapped plasma was so small compared to the random measurement error,
there appears little to be gained by correcting the values of
haematocrit for trapped plasma.
The second correction factor considered by Harrison et al
(1982) is the F-ceU ratio (Gibson et al, 1946). Over 80% of
directly determined values for F are in the range 0.85-0.99, and a value
of 0.91 (Chaplin et al, 1953; Green et al, 1987; Gregerson and
Rawson, 1959) or 0.92 (Albert et al, 1965) is generally adopted.
It should be noted, however, that Harrison and co-workers consistently
take an F-ceU value of unity (Harrison, 1974; Harrison et al,
1975, 1981). Harrison et al (1982) determined that the errors
introduced by failing to correct the measured haematocrit for an assumed
value for the F-cell ratio are small, and are negligible compared with
and Saltin (1974a) found that the F-ceU ratio also does not
significantly change following exercise dehydration leadmg to a 4% loss
of bodyweight. This observation lends vahdity to the DiU and CostUl
(1974) equation, which relies on the assumption that no change in the
F-cell ratio occurs pre- and post-dehydration.
Inconsistencies in the reported measurement of changes in plasma
volume can be attributed also to mathematical errors. For example, as
Harrison in his review (1985) has indicated, some confusion has arisen
because of multiplying changes in haematocrit ratio by 100 to change it
to a percentage. For example, if the haematocrit changes from 40% to
50%, the magnitude of the change is 25%; not deceptively 10%. Harrison
(1985) cited several reports where this type of interpretive ertor has
occurred, e.g. Pugh (1969) and Saltin (1964c). Other studies (cited in
Harrison, 1985) quoting relative changes in plasma volume did not
convert the percent change in haematocrit:
1 0 0 ( H c t j^-Hct2) / H c t 2 )
to percent change in plasma volume by multiplying it
by:-1 0 0 / ( by:-1 0 0 - H c t ^ )
e.g. Bazett et al (1940), Bock et al (1927), Gregerson and
Rawson (1959), Joye and Poortmans (1970), Poortmans (1971), Senay Jr.
(1970), Senay Jr. and Christensen (1965, 1968) and Stein et al
2.2.2. The effect of rehydration on the restoration of plasma volume
Lightweight rowers who have dehydrated to qualify for the weight
category usually have a period of approximately 90 minutes in which to
rehydrate. Wrestlers may have up to 5 hours to do so. The popularity
of wrestling in North American and Canadian universities, has led to a
significant amount of research on the problems associated with the
rehydration of wrestlers who have dehydrated to make weight categories.
Attempts to study the rehydration of rowers in conditions related to
their specific environment have not been previously pubhshed.
A variety of techniques has been used to achieve rehydration making
comparison between studies difficult. For example, rehydration regimens
have been structured, with fixed amounts of fluid being consumed at
regular time intervals (Costill and Sparks, 1973; Costill and Saltin,
1974b; Torranin et al, 1979) or ad libitum, where the subject
simply drinks to satiety (Klinzing and Karpowicz, 1986). On occasions
the subject has been permitted to eat during the rehydration period
(Houston et al, 1981). There has been also considerable variation
in the osmolality and the energy and electrolyte content of the
rehydration fluids used. Lamb and Brodowicz (1986) and Murray (1987)
have reviewed in depth the various drink formulations used to achieve
rapid rehydration after dehydration.
Previous discussion has indicated that plasma volume significantly
imphcated in the reduced physical working capacity observed foUowing
dehydration (Candas et al, 1986; Saltin, 1964b). Rehydration
research, therefore, has usually concentrated on methods of returning
plasma volume back to euhydration levels (Lamb and Brodowicz, 1986). In
the main, studies have shown that a few hours of rehydration are
sufficient to return most physiological parameters to near normal values
at rest, except plasma volume (Lamb and Brodowicz, 1986).
2.2.2.1. Rehydrating with water versus dilute solutions of
sodium chloride.
Nielsen (1984a) has pointed out that the rate of restoration of the
fluid lost is limited by the rate of gastric emptying, the rate of
absorption of fluid from the intestinal lumen and the equUibrium
processes between the body water compartments. In the case of ad
libitum rehydration regimens, the loss of the dipsogenic drive occurs
long before euhydration status is achieved (Nielsen et al, 1984a;
Nose et al, 1988b; Strieker and Jalowiec, 1970) partly because
stomach distension has been associated with the early termination of
drinking (Geelen et al, 1984; RoUs et al, 1980; Seckle et
al, 1986). Further, when the osmolality and/or chloride levels of
the vascular compartment become normalized, even if the volume has not
returned to normal, the thirst sensation usually ceases (Dill et
al, 1933). If serum osmolality and serum sodium levels decrease
urine production mediated via osmoreceptor suppression of vasopressin
release (Brandenburger et al, 1986; Robertson, 1974). This results
in excretion of water via the kidneys before the water loss is fully
replaced. In relation to the above discussion, the rapid consumption of
large volumes of water usually results in a decrease in serum osmolality
and a resultant diuresis before plasma volume is normalized.
The ideal rehydration fluid would contain sufficient quantities of
electrolyte such that when all the fluid that has been lost is replaced,
serum electrolytes and osmolality would be normal. In the exercise
context, however, other factors have to be considered, viz:
a) The relative importance of rehydrating the extracellular fluid
compartment compared to the intraceUular compartment on maximal
performance has not been studied. On the one hand, fluids
containing significant levels of sodium have been demonstrated to
rehydrate predominantly the extracellular compartment (Nielsen et
al, 1986). Ingestion of a high potassium fluid, on the other
hand, in addition to preferentially rehydrating the intracellular
space, appeared to enhance urine production and natriuresis (Nielsen
et al, 1986). There is no evidence, however, that the
inclusion of potassium in the high potassium drink specifically
resulted in intracellular rehydration as a drink high in
carbohydrate but low in potassium was equally effective in this
b) To replace the lost plasma volume completely and prevent the
hypo-osmotic induced diuresis from occurting, a solution of 0.45%
sodium chloride, or greater, is required to be drunk (Nose et
al, 1986). The large volumes required to be drunk could be
expected to induce feelings of fuUness and nausea mainly because of
retarded gastric emptying (Hunt, 1959). Competitors, for this
reason, would not voluntarily choose to drink such concentrated
solutions before competing in a race or similar event. A 0.3%
solution appears to represent the limits of voluntary toleration and
allaesthesia for large volumes in such a situation (personal
observation).
c) Gastric emptying is significantly slowed in the presence of
solutions with high osmotic pressures (CostUl and Saltin, 1974;
Fordtran and Saltin, 1967; Hunt and Pothak, 1960). However, gastric
emptying (Hunt and Pothak, 1960) and intestinal absorption (Schultz,
1981) is facilitated if a small amount of sodium chloride is present
compared to that of distilled water. This possibly stunulates the
active uptake of sodium that would carry water with it.
Davis et al (1987), using deuterium (D2O) labelled beverages,
demonstrated that the accumulation of D2O in the plasma was
significantly greater after ingestion of a hypotonic saline drink
compared to water after 90 minutes. In many studies, carbohydrate in
various concentrations has also been added to the rehydration medium,
making comparisons difficult (Allen et al, 1977; Corrigan et
their study, Costill and Sparks (1973) used a rehydration fluid that
consisted either of a glucose-electrolyte drink or distilled water. The
subjects were required to drink an amount calculated to be the
equivalent of 7.7% of the lost body weight every fifteen minutes such
that after three hours of rehydration, their lost body weight would be
regained. Bodyweight, however, is not a reliable indicator of fluid
status after rehydration because a significant proportion of the fluid
will have remained in the gut or been passed into the bladder (Costill
and Sparks, 1973). Therefore, it is not a surprising result that
although neither solution completely restored plasma volume after three
hours, the glucose-electrol)^e drink was significantly more effective.
Mack et al (1986) obtained simUar results using a hypotonic NaCl
solution. Davis et al (1987) found that there was very little
difference in the accumulation of D2O in the plasma of a hypotonic
electrolyte solution that also contained 6% glucose compared to the
hypotonic saline solution alone. Solutions containing greater than 6%
glucose, however, significantly retarded gastric emptying. Costill and
Saltin (1974b), also reported that gastric emptying rate decreased from
17 ml min'^ for a 0.2% (34 mmol l'^) saline solution to 10
2 3 . THE EFFECT OF DEHYDRATION ON THE
URINARY EXCRETION OF SODIUM AND
POTASSIUM
In dehydration, the rate of sodium reabsorption is increased,
despite raised plasma osmolality, in order to minimize the urinary loss
of water (Gauer et al, 1970; Nielsen et al, 1984a).
Aldosterone acts on the distal convoluted tubule to promote the active
reabsorption of sodium in exchange for potassium (Hierholzer and
Weiderholt, 1976). An increased potassium excretion after dehydration,
therefore, should be evident. Observations to this effect have been
made by Costill et al (1976b), Mnatzakanian and Vaccaro (1984) and
Zambraski ef a/. (1975).
2.4. THE EFFECT OF DEHYDRATION AND
REHYDRATION ON PERFORMANCE
A substantial volume of literature exists reporting the effects of
dehydration and rehydration on performance. Unfortunately, as
previously discussed, meaningful comparisons between studies have been
made very difficult because of different degrees of dehydration, methods
and time periods in which the dehydration was achieved and the method of
rehydration attempted. Finally, to add further to the plethora of
methods, the tasks chosen in which to quantify changes in performance
2.4.1. Physical work capacity after dehydration
A representative but not inclusive list of studies demonstrating the deleterious effect of dehydration on physical working capacity (PWC) is shown in Table 2.2. Rowing involves a combination of power and endurance. Elite rowers are characterized by their very high maximal oxygen uptakes and strength development and their capacity to tolerate very high levels of acidosis (Hagerman et al, 1979). To formulate a hypothesis on the effect of dehydration on rowmg performance, therefore, it is necessary to consider the effects of dehydration individually on:
a) endurance capacity; b) anaerobic capacity; and
u D O • —< L -(U +-' (D —' OJ X ) (U J Z -!-> W) c • — ' +-• m L -- M t o C Q C cD D t o CU • — " D =)
• H '
>> • M --^ U 03 Q . tfl U CtO c .— ^ i -o ^ —1 m u .—< IT) >^ J Z Q . C o c o 3 <u u c <d > ,
e -P O M m 10 u -d (1) o o t7>X! 0) (U Q Q O cu a o T3 O x: - p 0) t-l o X. wa as n) (U 0) 0) (0 ^ X! lO O
O 01 X k - O 01 u c u (U P X <a «3 M S o <u (U <-) o >1 o
. ^ <w * ? VO vo >o
in in vo
I I I n r^ [^
u xi <d e CM o > X m e ON o > oV> o r^ () U Q) r H <rt e ^1 0) o\<> VD i n u u Q) X w ^^^ r H (d e u (1) X £3 £ W EH M
c • P r-l (d M C W - H 3
A O J C 0) X •O 0) <W O
c o
• H - H
X -P
r H 01
(0 3 to 0) ^( o m -p I in C C • H . - ( o 0) Di « C - H o y. \o (d ^ 3.
<d t o t o 0) . H •H <d ^^ O XI (U tn nj 0) o 0) • a o <U o r -H 1 o o di o d p CO (fl (0 W W o -.H < Id P (M 0) r-p .-I u Q) Q) •a -a 0) 0) 01 (fl (0 (0 (U <u o o 0) (1) XJ Tf O U s s
ID !?
c • H e in u o O X en 10 >^ e o 0) > <H O Iff
> , o
O CO dp dp o o CM n I I CN n 0) w -H C) k a) X W M ^ (d <d u (U d) C •X. H (0 X) •rA P tn o o P TD k 0) (0 in <U lO a a) X o Q) C -H X (0 01 p 01 (U p o t o H I u dp CO (d <-\ a •H 01
a . 01 <d o (d e >^ o x : t o CTl u e (d 0) 01 ( 0 01 ^1 o 0) • a u p 01 0) p o I <J o i n x: CO - H Id o r -P cr\
0) r H
in XI 0) 0) Ul 01 (d (0 01 0) u u 01 0) •D X l d P <if
n tN] u a X! U C—( o P c >-l 01 o Id g P
^ o o
3 01 01 O H H 01 3 „ „ S Id X)
dp o 1-1 X! (d e 0) x :
+ J CTl
01 r--w c (0 !-i M O t H 01 Id 01 u u 01 XI (J s Ul (0 H X P (d e n
r - i P (d VI P 01 c p a e X 0) Id O eg c o H >
dp dp d p rH rH H " » ^ • *
H VJ n x : X! XI
x^ - ^ 00 CM ( N < •
0) o
JH M
Q W (d Xi O
Id p -^ 0) CO 0) :J X! Id o 0 o< o o
P O 0) 0) 01 0) XJ XI 0) XJ P dp dp
d p i n CO 0 ) • * n r H 01 •<• ^1 0) X 0) 01 ^ c P B c
0 ) CO
e I 01
-U X
O (0
c e
- H CM ^
o 01 >< 0 > c <i> ^41-1 e o 01 O P
0) 1 d p j < ; dP d p i n
-w o o o m in r» H
c o - H P 01 3 <0 X!
dp d p d p in in in
CM CN] O l
01
c e
O 1 I t o H I O CN O > o t n I 0) o Ul 0) • H O 01 M O (0 P e 01 ^ JH
01 O 01 3 X > i X ! - H W U H P
P CO 01 o\ rH c 01 01 flj •o c (0 h o
C P o 3 (0 01 M 0) <)-l V< <P e CO (0 o O Ul P
o o 0) o
o - e c
i n H P e o o in D^ C - H c C 3 ^1 >i O 10 u B p 10 O i 0) C P - H r H M P - H 01 . H 0 ) •<-< ^ 4 > ;
S (fl CM I ^ 1 X! O -rH P 01 3 <d P in
0 ) CO
cn C7>t-t C O ^ 1 P 01 e 0) C 01 •H -O <-{ P 01 Ul o o i p 0) o X! o in X3 t o CO O o CP ft C k
• H <d
c
• H XJ
2.4.1.1. The effect of dehydration on endurance performance
The consensus of previous investigations indicates that dehydration
causes a substantial decrease in maximal physical work capacity in
endurance type exercise. Armstrong et al (1985a) induced a weight
loss of between 1.9% and 2.1% in five hours following the administration
of 40 mg of the diuretic furosemide. In the dehydrated state, subjects
achieved less work during an incremental V02max test on a treadmill.
Using similar methods, Caldwell et al (1984) also observed
comparable results. Of greater practical significance, Armstrong et
al (1985a) demonstrated that competitive track running performance
was detrimentally affected over distances of 5,000 metres and 10,000
metres. Their linear regression analysis indicated that each 1%
decrease in body weight, following diuretic use, corresponded to running
time increases of 0.39 (r= -0.65) and 1.57 (r= -0.40) minutes
respectively for the 5,000 metres and 10,000 metres track running trials
(Armstrong e^fl/., 1985a).
Some studies specifically report that exercise induced dehydration
causes the greatest deleterious effect on physical work capacity
compared to other forms of dehydration (Costill and Saltin 1973, 1975;
Nielsen et al, 1981). The subjects in these studies had induced
the dehydration by exercising submaximally for a number of hours and
then, within 30-90 minutes after the cessation of this exercise,
performed a strenuous exercise test. Physical work capacity in these
performance decrement in these experiments can be attributed to the effects of dehydration? Asmussen et al (1974) observed that in euhydrated subjects, maximum physical work capacity was detrimentally affected when a strenuous exercise test was preceded by several hours of submaximal exercise. This kind of prior work could have depleted the muscle glycogen stores (Klausen et al, 1975), This point will be discussed in greater detaU later (section 2.6).
As CaldweU et al (1984) identified, only a few dehydration studies used methods that are actuaUy used by athletes to compare differences in dehydration protocols. For example, the methods used by CostUl and Saltin (1975), of exercise induced dehydration, would be very unlikely to be adopted as a technique for weight loss by athletes immediately prior to competition. The majority of weight is usually lost a night or so before the day of the event using light exercise and fluid restriction. CaldweU et al (1984), using such a regimen over a 48 hour period, demonstrated that this form of exercise-dehydration was significantly less detrimental to performance than the more rapid thermal or diuretic induced forms of dehydration. It is of interest that Caldwell et al (1984) reported that there were no significant changes in muscle glycogen content within any of the test groups before and after dehydration.
Similarly, Armstrong et al (1985a), reported that the track trials
were performed under competitive conditions with very highly motivated
individuals. As proposed by Saltin (1964b), the increased performance
times seem to imply a decreased physiological abihty to perform hard
muscular work.
2.4.1.2. The effect of dehydration on anaerobic performance
Jacobs (1981) observed that after thermal dehydration of 5% of body
weight, no deleterious effects on the abUity to perform the Wmgate
anaerobic test nor change in peak lactate accumulation were evident
(Jacobs, 1980). Bell et al (1982) similarly found that the abihty
to perform maximal anaerobic work was not affected by dehydration.
2.4.U. The effect of dehydration on strength and muscular
endurance
The assessment of the effect of dehydration upon muscular strength
and endurance has not been made in specific sporting environments. Most
studies have assessed the function of isolated muscle groups using
isometric and isotonic tasks with equivocal results (Serfass et al,
1984; Torranin et al, 1979; Bosco et al, 1974).
Some studies have examined the effects of dehydration on the hand
loss of body weight in trained wrestlers over a three day period. It
was not stated how the weight loss was achieved. The standard exercise
task required maximal contractions of the hand flexor muscles to be
performed at a rate of thirty contractions per minute for six minutes
using a hand dynamonometer. They did not identify any deleterious
effects from dehydration on initial strength, final strength or
force/time integrals. SimUarly, Saltm (1964a), Singer and Weiss
(1968) and Tuttle (1943) also did not report any decrements in hand grip
strength of wrestlers foUowing losses of up to 5% of bodyweight. In
contrast to the Serfass et al (1984) study, Torranin et al
(1979) reported a significant decrease in muscular endurance of the hand
flexor muscles foUowing dehydration. In this study, a 4% loss of body
weight was achieved by inactive thermal exposure for three hours. The
standard exercise task required regular contractions of 75% of a
previously determined maximal voluntary contraction (75% 1-MVC) to be
performed at a rate of thirty contractions per minute, again on a hand
dynamonometer. The test ceased when 75% 1-MVC failed to be achieved on
two consecutive contractions.
Torranin et al (1979) also reported the effects of dehydration
on isometric and isotonic muscular endurance in various other muscle
groups. For the isotonic measurements, arm curls (one arm), bench press
and leg press were performed. The standard exercise test, as previously
mentioned for the hand grip test, required contractions of 75% 1-MVC at
a rate of thirty contractions per minute. The standard isometric
exercise test required a sustained contraction of 75% 1-MVC to be
groups were averaged, dehydration was associated with a 31% decrease in
isotonic endurance time and a 29% decrease in isometric endurance time.
Their results also suggested that different muscle groups may be
affected differently in dehydration. During isometric work, performance
during the leg press and hand grip exercises appeared to be affected
significantly whereas the arm curl and bench press exercises were
relatively unaffected. During isotonic work, performance simUarly
decreased for the leg press and hand grip exercises. The isotonic arm
curl and bench press exercises were left relatively unaffected. The
major muscle groups involved in hip and leg extension are also required
m rowmg. It is of uiterest that the isotonic leg press exercise, as
used in the Torranin et al. (1979) study, was affected by
dehydration to a greater degree than the musculature associated with the
arm and pectoral girdle. Bosco et al (1974) also reported that
isotonic muscular endurance decreased foUowing dehydration. After a
5.7% loss of bodyweight induced over three days, the number of sit-ups
able to be performed in two minutes decreased by 9% (Bosco et al,
1974).
2.4.2. Physical work capacity after rehydration
Many physiological variables, important for endurance exercise and
that are adversely affected by dehydration, will return towards normal
after rehydration, albeit not completely in the hmited time before
competition (Allen et al, 1977; CostiU and Sparks, 1973; Herbert
capacity, although improved compared to a dehydrated trial, usuaUy
remains substantiaUy below that obtained when euhydrated (Corrigan et
al, 1984; Houston et al, 1981). After four hours of
rehydration, Torranin et al (1979) found that muscular endurance
was still depressed after an initial 4% loss of bodyweight. A study by
Houston et al (1981) showed that three hours of refeeding and
rehydration with self-selected foods and beverages after 8% loss of
bodyweight induced by dehydration and fasting did not return isokinetic
knee extension strength to normal. FinaUy, another study (Corrigan
et al, 1984) compared different beverages for rehydration by using
various combinations of electrolytes and either glucose or glucose
polymer. The authors found that performance in a 2-3 muiute
simultaneous arm and leg cychng task of maximal intensity was not
restored to normal after five hours of rehydration with any of the
beverages.
2.5. THE EFFECT OF DEHYDRATION ON RESPIRATORY,
METABOLIC AND CARDIOVASCULAR VARIABLES
A reasonable consensus between studies has been obtained with
respect to the effect of dehydration on various metabolic and
respiratory variables. Maximum oxygen uptake is either unchanged
(Armstrong et al, 1985a; Bock et al, 1967; Houston et al,
1981; Saltin 1964a,c) or decreases slightly (CaldweU et al, 1984;
Sawka et al, 1984b). Studies that report the effect of dehydration
intensity exercise of six to seven minutes duration have not been able
to be located. During submaximal exercise ranging from 50 to 85 percent
of maximal oxygen uptake, a decrease in RER has been reported (CostiU
etal, 1976a; Saltin, 1964a, 1964b),
Dehydrated subjects commonly experience a decrease in blood lactate
accumulation after maximal exercise of several minutes duration when
compared to a similar euhydrated trial (Nielsen et al, 1981;
Caldwell et al, 1984; Klinzing and Karpowicz, 1986; Armstrong et
al, 1985a), In a study by Saltin (1964c), thermaUy dehydrated
subjects complamed regularly that the legs were the "hmituig factors"
at the maximal work load suggesting a high lactate accumulation. This
observation, however, was not reflected in the measured blood lactate
accumulation.
At maximal work intensity, there is no change in maximum heartrate
after dehydration (Armstrong et al, 1985a; CaldweU et al,
1984; Klinzing and Karpowicz, 1986). If the dehydration induced loss of
plasma volume is less than 6%, vasoconstriction in peripheral beds can
usually compensate for the reduced blood volume and assist in
maintaining stroke volume and cardiac output (Nielsen, 1984b; Claremont
et al, 1976; Klinzing and Karpowicz, 1986; Sproles et al,
1976). End diastoUc volume is usually reduced (Sawka et al,
1984a) because of decreased filling pressure (Hales, 1986). Presumably
FoUowing substantial losses of sweat, the relative increase in the circulatmg volume of red blood ceUs is associated with higher blood viscosities (Vandewalle et al, 1988; Mnatzakanian and Vaccaro,
1984). Increases in blood viscosity has been associated with a decrease in cardiac efficiency due to an increased resistance to blood flow (Fowler and Holmes 1975; Gorden et al, 191 A). It is of uiterest that subjects who maximally exercise with artificiaUy increased blood viscosities appear to experience fatigue earher compared to a simUar trial with unadjusted blood viscosities (Dintenfass and Lake, 1977). Letcher et al, (1981) and Ernst (1985), also found that the resting blood viscosity of trained subjects was lower than that of untrained subjects. This difference in blood viscosity was due to a lower fibrinogen concentration in the trained subjects. This may help explain the observation that trained subjects appear to tolerate dehydration better than untrained subjects (Saltin, 1964a; Buskirk et al, 1958). Whether changes in blood viscosity are significantly
2.6. THE EFFECT OF DEHYDRATION ON MUSCLE
GLYCOGEN LEVELS AND UTILIZATION RATE
DURING EXERCISE
Muscle glycogen content foUowing dehydration has been measured only
on a relatively smaU number of occasions (CaldweU et al, 1984;
CostiU and Saltin, 1975; CostUl et al, 1976a; CostiU et al,
1981; Houston et al, 1981; Nielsen et al, 1986). In these
studies, except the studies of CaldweU et al (1984) and Houston
et al (1981), dehydration was induced using submaxunal exercise for
a number of hours prior to an exercise performance test. As mentioned
previously (section 2.4.1.1), Asmussan et al (1974) observed that
work capacity in euhydrated subjects was reduced when preceded by
several hours of submaximal exercise.
In the study by CostUl and Saltin (1975), a 4% loss of bodyweight
was achieved by continuous running for 1.5 to 2.5 hours. Unfortunately
the intensity of the submaximal exercise was not reported. Prolonged
exercise of between 60% and 74% of V02max for two hours has been
demonstrated to deplete completely the glycogen content of the slow
twitch (ST) muscle fibres and substantially deplete the fast twitch
(FTg) fibres but having a much lesser effect on the FT^^ fibres
(GoUnick et al, 1973a, 1974b). Thirty minutes after completion of
the prolonged submaximal exercise, the dehydrated exercise performance
test, involving 5 minutes of bicycle ergometer activity at 80 - 85%
V02max was performed. The exercise test probably would have
al, 1973b, 1974b). Hence, the decrease in performance reported m
the study of Costill and Saltm (1975) cannot be attributed fully to the
effect of dehydration alone but also to a prior depletion of glycogen in
the muscle fibres predominantly recruited during the exercise test
(i,e,, ST and FTg fibres),
Houston et al (1981) studied a group of wrestlers who were
required initially to restrict food intake for 48 hours. Muscle
glycogen levels decreased significantly from an initial level of 62.3 ±
3.3 mmol glucosyl units kg'^ wet weight of tissue (mmol kg'^
W.W.) to 44.0 ± 3.0 nrniol kg-^ W.W. For a further 24 hour period,
food intake continued to be restricted in addition to fluid intake also
being decreased by two thirds. A final additional 24 hour period
involved an almost complete restriction of food intake and no fluid
intake at aU. During the final 48 hour period, muscle glycogen
decreased significantly from 44.0 ± 3.0 mmol kg'^ W.W. to 33.9 ±
1.8 mmol kg"^ W.W. Light exercise training had been continued
during the 96 hour period and most probably contributed significantly to
the decrease in muscle glycogen levels. After a further three hour
period of rehydration and consumption of food containing mostly simple
carbohydrate, muscle glycogen levels did not increase significantly and
remained at 38.6 mmol kg"^ W.W. In this study, the decreases in
muscle glycogen probably could be attributed to the effects of 96 hours
of food restriction. The failure to synthesize muscle glycogen in the
three hour period of rehydration, however, may be attributed possibly to
CostUl et al (1988) demonstrated that muscle glycogen storage was affected by repeated biopsies from the same muscle. They found that samples taken from regions distal and proximal to the initial biopsy contained, on average, less glycogen than the contralateral control leg. These differences, however, were only significant m the distal muscle sample. Alterations in muscle glycogen storage were seen to persist for ten days after the first biopsy. They concluded that in studies requiring repeated muscle biopsies over several days, consideration should be given to the effects on impaired glycogen storage from biopsy trauma. The problem can be minimized by sampling muscle distal (approximately 3 cm) to the site of the previous biopsy, although some reduction in glycogen storage could be expected in these specimens (CostiU et al, 1988). This information may explain why Houston et al (1981) observed no glycogen synthesis durmg rehydration because aU biopsy samples had been obtauied from the same muscle.
termed exercise-dehydration. It is not made clear, however, whether
food and/or fluid was restricted during this period. Muscle glycogen
following the exercise-dehydration treatment did not decrease
significantly. It was of interest that lactate accumulation during the
incremental V02max tests was lower foUowing aU dehydration treatment
conditions despite the unchanged initial muscle glycogen levels.
One study provided evidence that dehydration may decrease muscle
glycogen utihzation rate during exercise (CostUl and Saltin, 1975).
These authors compared the effects of dehydration induced by prolonged
submaximal exercise or inactive thermal exposure on the distribution of
water and electrolytes between the internal and external phases of
skeletal muscle. Muscle glycogen levels were also measured. Their
research design involved completing a five minute control cycling task
at 80-85% V02max, which was then shortly followed by dehydration.
Dehydration (either thermal or exercise) proceeded until a 4% loss of
body weight had been achieved. After weight loss and thirty minutes
rest, the five minute exercise performance test was again performed.
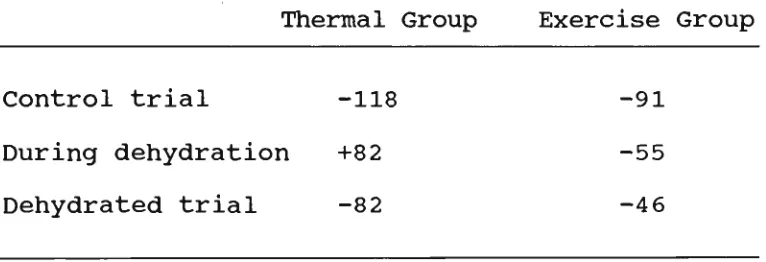
Unfortunately, Costill and Saltin did not report absolute muscle
glycogen concentration, but reported relative changes. The changes in
glycogen concentration following each trial have been estimated from a