Western University Western University
Scholarship@Western
Scholarship@Western
Electronic Thesis and Dissertation Repository
4-3-2012 12:00 AM
Hydrodynamics and Micro Flow Structure of Gas-Solid Circulating
Hydrodynamics and Micro Flow Structure of Gas-Solid Circulating
Turbulent Fluidized Beds
Turbulent Fluidized Beds
Maozhan QiThe University of Western Ontario
Supervisor Dr. J. Zhu
The University of Western Ontario Joint Supervisor S. Dr. Barghi
The University of Western Ontario
Graduate Program in Chemical and Biochemical Engineering
A thesis submitted in partial fulfillment of the requirements for the degree in Doctor of Philosophy
© Maozhan Qi 2012
Follow this and additional works at: https://ir.lib.uwo.ca/etd
Part of the Engineering Commons Recommended Citation
Recommended Citation
Qi, Maozhan, "Hydrodynamics and Micro Flow Structure of Gas-Solid Circulating Turbulent Fluidized Beds" (2012). Electronic Thesis and Dissertation Repository. 420.
https://ir.lib.uwo.ca/etd/420
Hydrodynamics and Micro Flow Structure of Gas-Solid
Circulating Turbulent Fluidized Beds
(Spine title: Hydrodynamics of CTFB)
(Thesis format: Integrated Article)
by
Maozhan Qi
Graduate Program in Engineering Science
Department of Chemical and Biochemical Engineering
A thesis submitted in partial fulfillment
of the requirements for the degree of
Doctor of Philosophy
The School of Graduate and Postdoctoral Studies
The University of Western Ontario
London, Ontario, Canada
THE UNIVERSITY OF WESTERN ONTARIO
SCHOOL OF GRADUATE AND POSTDOCTORAL STUDIES
CERTIFICATE OF EXAMINATION
Supervisor
______________________________ Dr. Jesse Zhu
Co-Supervisor
______________________________ Dr. Shahzad Barghi
Examiners
______________________________ Dr. Hugo de Lasa
______________________________ Dr. Ronald Breault
______________________________ Dr. Chao Zhang
______________________________ Dr. Chunbao Xu
The thesis by
Maozhan Qi
entitled:Hydrodynamics and Micro Flow Structure of Gas-Solid Circulating
Turbulent Fluidized Beds
is accepted in partial fulfilment of the requirements for the degree of
Doctor of Philosophy
Abstract
Circulating Turbulent Fluidized Beds (CTFB) refer to fluidized beds integrated into high
density circulating systems to simultaneously achieve highly efficient gas-solid
interactions existing in turbulent fluidized beds and low solids backmixing featured by
circulating fluidized beds. Hydrodynamics and micro flow structure were experimentally
studied in a CTFB (3.6 m high and 0.104 m id) using 76 µm FCC particle with air velocities
of 0.5 ~ 5.0 m/s and solids circulation rates of 0 ~ 420 kg/m2s The distributions of solids
holdup were acquired using optical fibre probes and pressure transducers at sampling
frequencies of 50 kHz × 131 s and 1 kHz × 400 s respectively. A Pseudo Bubble-Free
Fluidized Bed was developed to dynamically calibrate the optical fibre probes. Based on
statistical parameters, a Moment Consistency Data Processing Method (MCDPM) was
proposed to calculate solids holdups of the dense and dilute phases from the experimental
data. A Divided Phase Cross-Correlation Method (DPCCM) was adopted in cross-correlating
the solids holdup signals of the dense and dilute phases to obtain the phase particle velocities.
MCDPM provided average solids holdups of the dense and dilute phases and the phase
fractions over bubbling (BFB), turbulent (TFB), circulating turbulent (CTFB), high
density circulating (HDCFB) and circulating (CFB) fluidized beds. The flow structure in
terms of phase division and the micro flow characteristics were studied across all five
regimes from low to high velocities, CTFB was found to have strong similarities with
Study on the detailed hydrodynamics and transition characteristics of the CTFB
demonstrated that solids holdup distribution in CTFB was more homogeneous both
axially and radially than that of other regimes, and the local solids flux and the local
particle velocity were both proportional to the solids circulation rate. Microscopically,
CTFB was characterized by dilute phase dominating flow in the centre and dense phase
dominating flow in the annular region. Such flow structure was different from either
dense phase dominating flow in BFB or dilute phase dominating flow in CFB. New
criteria for the transition air velocities were proposed for CTFB. The results demonstrated
that the onset transition velocity from BFB to CTFB remained nearly unchanged, and the
ending transition air velocity from CTFB to CFB increased, with increasing solids
circulation rate.
Keywords: Circulating turbulent fluidized bed, Fluidization regime, Hydrodynamics,
Solids holdup, Transition velocity, Micro flow structure, Divided phase cross-correlation,
Dense and dilute phase division, Particle velocity, Slip velocity, Apparent particle
Co-Authorship Statement
Title: Dynamic calibration of optical fibre probes in gas-solid flow systems: low and high
solids concentrations (Chapter 3)
Authors: Maozhan Qi, Shahzad Barghi, Jesse Zhu
Maozhan Qi designed and performed the experiment and carried out data analysis under
the guidance of Dr. Jesse Zhu. All drafts of this manuscript were written by Maozhan Qi.
Modifications were carried out under close supervision of Dr. J. Zhu and Dr. Barghi. The
final version is ready to submit for publication. Major results were presented at 60th
CSChE conference.
Titile: Identification of micro flow structures and regime transition in gas-solid fluidized
beds through moment analysis (Chapter 4)
Authors: Jesse Zhu, Maozhan Qi, Shahzad Barghi.
Under peer review AIChE Journal, 2012
The experimental setup of a gas-solid circulating turbulent fluidized bed was modified by
Maozhan Qi under the guidance of Dr. Jesse Zhu and Dr. Barghi. All the experimental
work and data analysis were undertaken by Maozhan Qi. The first drafts of this
manuscript were written by Maozhan Qi with some major parts rewritten by Dr. Zhu in
Barghi. Partial results were also presented at 61st CSChE conference. The final version
of this article has been submitted to AIChE Journal.
Title: Transition characteristics of gas-solid flow in circulating turbulent fluidized beds
(Chapter 5)
Authors: Maozhan Qi, Jesse Zhu, Shahzad Barghi
Maozhan Qi designed and performed the experiments and carried out data analysis under
the guidance of Dr. Jesse Zhu and Dr. Barghi. All drafts of this manuscript were written
by Maozhan Qi. Modifications were carried out under close supervision of Dr. J. Zhu and
Dr. Barghi. The final version has been submitted to Powder Technology.
Title: Detailed hydrodynamics of high flux gas-solid flow in a circulating turbulent
fluidized bed (Chapter 6)
Authors: Maozhan Qi, Shahzad Barghi, Jesse Zhu
Maozhan Qi designed and performed the experiment and carried out data analysis under
the guidance of Dr. Jesse Zhu and Dr. Barghi. All drafts of this manuscript were written
by Maozhan Qi. Modifications were carried out under close supervision of Dr. J. Zhu and
Dr. Barghi. The final version is ready to submit for publication. Some results were
Title: Particle velocity and flux distribution in a high solids concentration circulating
turbulent fluidized bed (Chapter 7)
Authors: Maozhan Qi, Jesse Zhu, Shahzad Barghi
Maozhan Qi designed and performed the experiment and carried out data analysis under
the guidance of Dr. Jesse Zhu and Dr. Barghi. All drafts of this manuscript were written
by Maozhan Qi. Modifications were carried out under close supervision of Dr. J. Zhu and
Acknowledgments
I would like to extend my sincerest gratitude and deepest appreciation to my supervisor Prof. Jesse Zhu for his unwavering dedication to this project. His knowledge, patience, continual support and guidance have been the foundations, on which this research has been built. I would also like to express my special thanks to my co‐supervisor Dr. Barghi for his advice, helpful suggestions and kind encouragement during the progress of this work, and for his generous timely support.
Special appreciations go to Jiemi Gao and Mohammed Abdelhadi who offered their great help and assistance for the experiments. Thanks are also extended to my friends in the research group, Dongbing Li, Jing Xu, Qi Miao, Long Sang, Tracy Wang, Yuanyuan Shao, Jingsi Yang, and other colleagues who supported me in every respect during the completion of this project. I would like to thank Joanna Blom, April Finkenhoefer, Kristen Hunt, J. Wen, Michael Zhu, Qing Mu, George Zhang, Lisa Desalaiz, Mike Gaylard, Clayton Cook for their timely supports.
I would like to thank Western University, Natural Sciences and Engineering Research Council of Canada (NSERC) for their financial supports toward my studies and research.
I am extremely thankful to my mother, my parents-in-law, my son, my brother Maogong Qi, and my sister-in-law Chrystal Ren who encouraged me throughout this journey.
Dedication
To
Table of contents
CERTIFICATE OF EXAMINATION ... ii
Abstract ... iii
Acknowledgments ... viii
Dedication ... ix
Table of contents ... x
List of tables... xv
List of figures ... xvi
1 Introduction ... 1
1.1 Background ... 1
1.2 Available measurement technologies ... 3
1.3 Hydrodynamics of TFB ... 6
1.4 Studies on circulating turbulent fluidized bed (CTFB) ... 10
1.5 Objectives ... 11
1.6 Thesis organization ... 12
Reference ... 14
2 Experimental Apparatus and Measurement Technique ... 21
2.1 Circulating turbulent fluidized bed ... 21
2.2 Particle Properties ... 23
2.3 Measurement Techniques ... 24
2.3.1 Measurement of superficial gas velocity ... 24
2.3.2 Differential pressure measurement ... 25
2.3.4 Cross-correlation method of particle velocity ... 29
2.3.5 Solids circulation rate measurement ... 30
Nomenclature... 31
References ... 32
3 Dynamic calibration of optical fibre probes in gas-solid flow systems: low and high solids concentrations ... 34
3.1 Introduction ... 34
3.2 Experimental setup and calibration procedure ... 38
3.2.1 Experimental setup... 38
3.2.2 Probe and calibration procedure ... 41
3.2.3 Application experiment ... 43
3.3 Results and discussion ... 44
3.3.1 Dynamic signals ... 44
3.3.2 Uniformity... 45
3.3.3 Calibration curves ... 47
3.3.4 Applications of optical fibre probe ... 53
Conclusion ... 59
Nomenclature... 59
References ... 60
4 Identification of micro flow structures and regime transition in gas-solid fluidized beds through moment analysis ... 64
4.1 Introduction ... 64
4.2 Experimental setup... 66
4.3 Moment consistency data processing method ... 70
4.3.2 Division of dense and dilute phases ... 76
4.4 Results and discussion ... 77
4.4.1 Flow structure across regimes ... 77
4.4.2 Flow regime transition and similarities ... 81
4.4.3 Flow regime differences and similarities ... 86
4.4.4 Micro flow structure analyses ... 89
Conclusion ... 93
Acknowledgement ... 94
Notation ... 95
Literature cited ... 96
5 Transition characteristics of gas-solid flow in circulating turbulent fluidized beds ... 99
5.1 Introduction ... 99
5.2 Experimental setup... 103
5.3 Results and discussion ... 107
5.3.1 Transient features of solids holdup signals ... 107
5.3.2 Skewness and kurtosis vs. two phase flow ... 111
5.3.3 Skewness and kurtosis profiles ... 116
5.3.4 Transition velocities of CTFB ... 124
Conclusions ... 133
Acknowledgement ... 134
Nomenclature... 134
References ... 135
6.1 Introduction ... 141
6.2 Experimental setup and methods ... 144
6.2.1 Experimental setup... 144
6.2.2 Parameters of dense and dilute phases ... 149
6.2.3 Phase particle velocity computation ... 150
6.3 Results and discussion ... 151
6.3.1 Macro flow structure of CTFB ... 151
6.3.2 Micro flow structure of CTFB ... 157
6.3.3 Solids circulation effect on CTFB ... 164
6.3.4 Typical characteristics of CTFB ... 170
Conclusion ... 175
Acknowledgement ... 175
Nomenclature... 176
References ... 177
7 Particle velocity and flux distribution in a high solids concentration circulating turbulent fluidized bed ... 180
7.1 Introduction ... 180
7.2 Experimental setup and methods ... 184
7.2.1 Experimental setup... 184
7.2.2 Divided phase cross-correlation method ... 188
7.2.3 Apparent particle velocity and phase slip particle velocity ... 193
7.3 Results and discussion ... 194
7.3.1 Particle velocities of dilute and dense phases ... 194
7.3.2 Phase slip particle velocity... 201
7.3.4 Apparent particle velocity and cross-correlation methods ... 210
Conclusion ... 212
Acknowledgement ... 213
Nomenclature... 213
References ... 215
8 Conclusions and recommendations ... 220
8.1 Conclusions ... 220
8.2 Assessment on CTFB ... 222
8.3 Recommendations ... 226
Appendix A.1 Derivation of MCDPM (Chapter 4) ... 228
Appendix A.2 Calculation of coefficient of determination in Chapter 3 ... 232
Appendix A.3 List of equations in Chapter 4 ... 233
Appendix A.4 List of equations in Chapter 5 ... 235
Appendix A.5 List of equations in Chapter 7 ... 236
Appendix B.1 Matlab code for MCDPMand phase division... 237
Appendix B.2 MatLab code for DPCCM ... 239
Appendix C.1 Velocity chart for the primary air supply ... 242
Appendix C.1 Velocity chart for the secondary air supply ... 243
Appendix D.1 Pressure chart for transducer ... 244
Appendix D.2 Pressure chart for transducer ... 245
Appendix D.3 Error analysis of solids holdup measurements using optical fibre probes ... 246
List of tables
Table 2.1 FCC particle size distributions ... 23
Table 2.2 Locations of pressure transducers ... 26
Table 3.1 Particle properties ... 41
Table 3.2 Coefficients of determination R2 at different positions ... 46
Table 4.1 Operating conditions of experiments ... 68
Table 4.2 Radial Non-uniformity Index (RNI) and average value for the dilute and dense phase solids holdups and the dense phase volume fraction ... 87
Table 5.1 A summary of transition air velocities of TFB in previous studies, using FCC as solid particle ... 102
Table 5.2 Operating conditions of experiments ... 105
Table 5.3 Local flow structure features of flow regimes vs. moment values ... 132
Table 6.1 Major advantages and disadvantages of CFB and TFB ... 143
Table A.1 Error Analysis of probe #1 (at z = 0.8 m) ... 248
Table A.2 Error Analysis of probe #2 (at z = 1.5 m) ... 249
Table A.3 Error Analysis of probe #3 (at z = 2.2 m) ... 250
List of figures
Figure 2.1 Schematic drawing of experimental apparatus ... 22
Figure 2.2 Setup of optical fibre probes and pressure transducers ... 29
Figure 3.1 Pseudo bubble-free fluidized bed and calibration system ... 40
Figure 3.2 Probe signals of PBFFB with GB #2 at different bed heights ... 45
Figure 3.3 Time average response voltage vs. solids holdup of sand at different radial and axial positions ... 46
Figure 3.4 Calibration curves with PBFFB and downer calibration procedures: .. 49
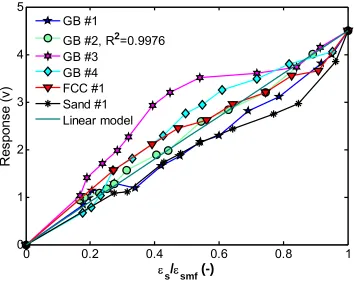
Figure 3.5 Calibrations of the optical probe in different particles ... 51
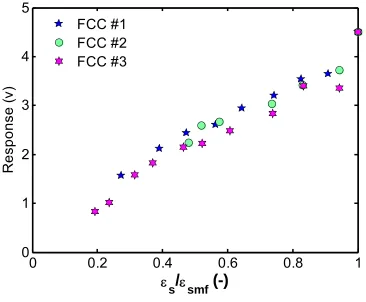
Figure 3.6 Probe responses to different FCC particle size distributions ... 52
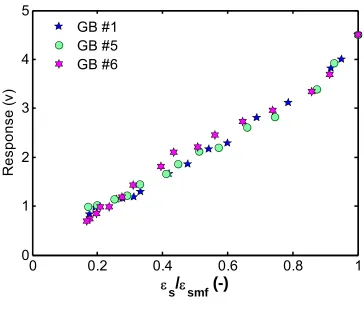
Figure 3.7 Probe responses to different glass bead particle size distributions .... 53
Figure 3.8 Axial profiles of cross-sectional averaged solids holdup in CTFB obtained by optical fibre probes and differential pressure transducers ... 54
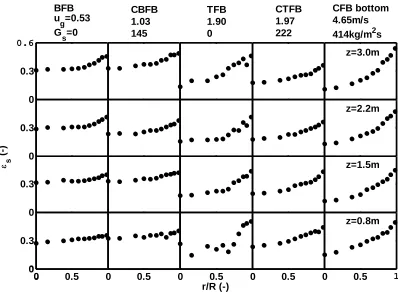
Figure 3.9 Radial profiles of time-average solids holdup in different regimes obtained by optical fibre probes ... 55
Figure 3.10 Solids holdup profiles of the dense phase in CTFB ... 56
Figure 3.11 Solids holdup profiles of the dilute phase in CTFB ... 57
Figure 3.12 Profiles of the dense phase fraction in CTFB ... 58
Figure 4.2 Segment of (a) measured solids holdup signals of CTFB vs. (b) the solids holdup signals from the corresponding ideal two phase flow ... 72
Figure 4.3 Relative moment errors of MCDPM with respect to (a) skewness or (b) kurtosis of local solids holdup signals ... 75
Figure 4.4 Relationship of skewness and kurtosis for all solids holdup signals ... 76
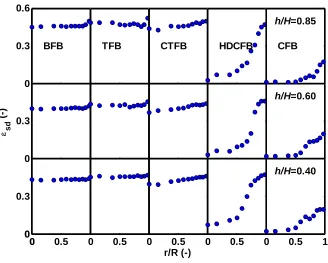
Figure 4.5 Radial solids holdup profiles of the dilute phase of BFB, TFB, CTFB, HDCFB and CFB, (data for HDCFB and CFB from Yan and Zhu, 2004) ... 79
Figure 4.6 Solids holdup profiles of dense phase of BFB, TFB, CTFB, HDCFB and CFB, (data for HDCFB and CFB from Yan and Zhu, 2004) ... 80
Figure 4.7 Profiles of dense phase fraction of BFB, TFB, CTFB, HDCFB and CFB, (data for HDCFB and CFB from Yan and Zhu, 2004) ... 81
Figure 4.8 Variation of average values of sb, sd and fd across the fluidization
regimes, BFB, TFB, CTFB, HDCFB and CFB, (data for HDCFB and CFB from Yan and Zhu, 2004) ... 83
Figure 4.9 Radial Nonuniformity Index (RNI) of sb, sd and fd for 5 fluidization
regimes, BFB, TFB, CTFB, HDCFB and CFB, (data for HDCFB and CFB from Yan and Zhu, 2004) ... 85
Figure 4.10 PDF profiles of BFB, TFB, CTFB, HDCFB and CFB, (data for HDCFB and CFB from Yan and Zhu, 2004) ... 91
Figure 4.11 Radial skewness profiles for BFB, TFB, CTFB, HDCFB and CFB, (data for HDCFB and CFB from Yan and Zhu, 2004) ... 92
Figure 4.12 Profiles of dense phase fraction of BFB, TFB, CTFB, HDCFB and CFB, (data for HDCFB and CFB from Yan and Zhu, 2004) ... 93
Figure 5.2 Evolution of solids concentration traces in BFB, CTFB, and the bottom zone of CFB (z = 1.5 m) ... 108
Figure 5.3 Comparison of solids concentration traces in TFB and CTFB
regimes under similar air velocities and different solids circulation rates ... 110
Figure 5.4 Moments vs. local solids holdup fluctuations in (a) BFB and (b) CFB fluidization regimes ... 114
Figure 5.5 Skewness profiles of solids holdup under different air velocities and different solids circulation rates in BFB, CTFB and the bottom zone of CFB ... 117
Figure 5.6 Skewness profiles of solids holdup under different solids
circulation rates in TFB and CTFB ... 118
Figure 5.7 Standard kurtosis profiles of solids holdup under different air velocities and different solids circulation rates in BFB, CTFB and the
bottom zone of CFB ... 120
Figure 5.8 Standard kurtosis profiles of solids holdup under different solids
circulation rates in TFB and CTFB ... 121
Figure 5.9 Probability Density Function (PDF) of local solids holdup at r/R = 0 for CTFB, noted with kurtosis and bi-peak parameter ... 124
Figure 5.10 Skewness variation of gas-solid flow and the transition velocities .. 126
Figure 5.11 Standard deviation, skewness and kurtosis of solids holdup signals in a conventional turbulent fluidized bed (data from Zhu and Zhu, 2008) ... 127
Figure 5.12 β values vs. air velocity and ending transition air velocity of CTFB 129
Figure 5.13 Ending transition air velocities of CTFB regime against solids
Figure 6.1 Experimental apparatus and optical fibre probe setup ... 148
Figure 6.2 Axial profiles of cross-sectional average solids holdup obtained from pressure gradients, (a) at different air velocities, and (b) with and without solids circulation, and (c) from optical probe measurement ... 153
Figure 6.3 Radial profiles of local average solids holdup against air velocity .... 155
Figure 6.4 Annular average solids holdup with respect to air velocity and solids circulation rate ... 156
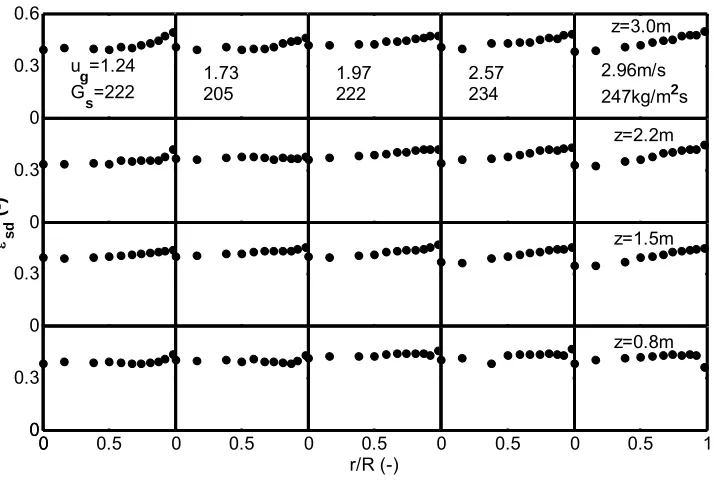
Figure 6.5 Annular average solids holdups of the dilute phase with respect to air velocity and solids circulation rate ... 158
Figure 6.6 Annular average solids holdups of the dense phase with respect to air velocity and solids circulation rate ... 160
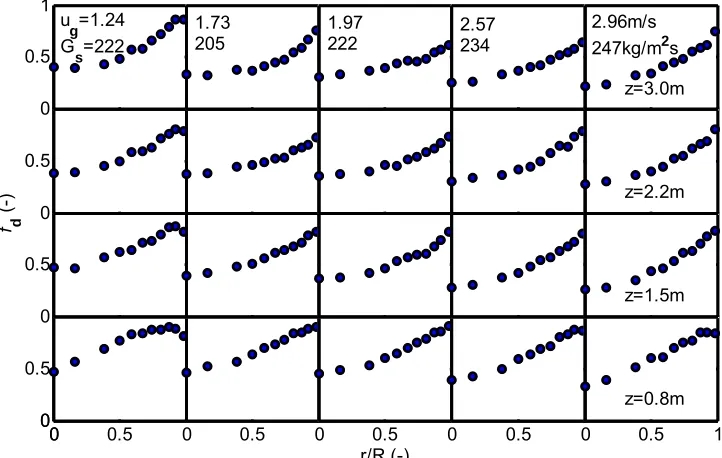
Figure 6.7 Annular average values of the dense phase fraction with respect to air velocity and solids circulation rate ... 162
Figure 6.8 Comparison of probability density function of solids holdup over transition, and over effects of superficial air velocity and effects of the solids circulation rate ... 164
Figure 6.9 Profiles of the reduced net solids flux at different air velocities: in entrance, fully developed and exit sections ... 167
Figure 6.10 Profiles of the reduced net solids flux at different solids circulation rates: in entrance, fully developed and exit sections ... 168
Figure 6.11 Profiles of the apparent particle velocity at different air velocities: in entrance, fully developed and exit sections ... 169
Figure 6.12 Profiles of the apparent particle velocity at different solids
Figure 7.1 Experimental apparatus and optical fibre probe setup ... 187
Figure 7.2 Signal decomposition of DPCCM: (a) original signal segment of solids holdup, (b) sub-signals of dense phase, (c) sub-signals of dilute phase . 189
Figure 7.3 Profiles of upward radial particle velocity of dilute and dense phases ... 195
Figure 7.4 Profiles of downward radial particle velocity of dilute and dense
phases ... 197
Figure 7.5 Annular average of upward particle velocities of dilute and dense phases with respect to air velocity, z = 1.5m ... 198
Figure 7.6 Annular average of upward particle velocities of dilute and dense phases with respect to solids circulation rate, z = 1.5 m ... 199
Figure 7.7 Profiles of upward and downward time fractions of dilute and dense phases, ug = 2.90 m/s, Gs = 145 kg/m2s ... 201
Figure 7.8 Profiles of phase slip particle velocity between dilute and dense
phases ... 202
Figure 7.9 Phase slip particle velocity between dilute and dense phases ... 204
Figure 7.10 Profiles of upward solids flux profiles of dilute and dense phases .. 205
Figure 7.11 Profiles of downward solids flux profiles of dilute and dense phases ... 206
Figure 7.12 Profiles of apparent particle velocity at different air velocities and solids circulation rates ... 210
Figure 7.13 Apparent particle velocity and comparison between CCM and
Figure A1 Velocity chart for the primary air supply………242
Figure A2 Velocity chart for the secondary air supply………243
Figure A3 Pressure chart for transducer of PX163-120D5V………244
Figure A4 Pressure chart for transducer of PX162-027D5V………245
1
Introduction
1.1
Background
Flow of a gas through a bed of solid particles can result in suspension of the particles due
to the imposed drag force on them. Particles in suspension move randomly and offer
maximum contact area, which is critical in heat and mass transfer processes. Winkler
introduced such gas-solid system for coal gasification in 1920s, as regarded as the first
fluidized bed reactor. The fluidization technology has drawn much attention ever since
due to its unique features, and a wide range of industrial application have been
developed, such as catalytic cracking of crude oil in the 1940s (Jahnig et al, 1980;
Squires, 1986). At early stages (1970s), the main research focus was on bubbling
fluidized beds. The concept of circulating fluidized bed or fast fluidized bed was first
proposed by Yerushalmi (1976), where solids must be fed continuously into the bed and
entrained upward in a riser, then collected/separated at the riser top, and re-circulated
through a particle storage vessel or stand pipe back to the bottom of the riser. Due to
excellent heat and mass transfer efficiencies, uniform temperature distribution and easy
addition and withdrawal of solids, circulating fluidized bed (CFB) has been applied to
chemical processing, mineral processing, pharmaceutical production and energy-related
process, etc. (Grace, 1990). The turbulent fluidization flow regime is commonly
considered to lie between bubbling fluidization and the fast fluidization regimes. It has
disappearance of large bubbles/voids. The first photo graph of a turbulent fluidized bed,
distinctly different from bubbling fluidization, was published by Matheson et al (1949). A
turbulent fluidization regime was introduced in the flow regime diagram of Zenz (1949).
The first quantitative study seems to have been performed by Lanneau (1960) who
measured local voidage fluctuations and pierced void lengths in a 76 mmID fluidized bed
with fine catalyst particles at high gas velocities, although the transition from
bubbling/slugging to the turbulent regime was not quantified. Kehoe and Davidson
(1970) extended their work on slugging to higher velocity operation and identified the
transition from bubbling to turbulent fluidization based on visualization of a 2-D bed and
bubble rise velocity and capacitance traces in a 3-D column. Later the turbulent
fluidization regime was reported by Massimilla (1978), Thiel and Potter (1977) and
Crescitelli et al (1978).
There are some inherent characteristics of CFB and TFB which limit the performance of
these reactors. The relatively low solid concentration and the non-uniform axial and
radial flow structure in CFBs cause many disadvantages. For instance, their serious gas
by-passing through the core dilute region and extensive backmixing of solids in the wall
region, consequently, led to reduced overall gas-solid contact efficiency (Perales et al,
1990). As TFB is concerned, serious backmixing of the solids phases responds to a broad
residence time-distribution of the solids and poor chemical reaction selectivity (Zhu and
Zhu, 2008a). Low gas passing through is another shortcoming of TFB. In view of CFB
making up most of TFB shortcomings, a new concept of circulating turbulent fluidized
circulating and turbulent fluidized beds into a unique high-density fluidization system, to
simultaneously achieve efficient gas-solid contact and low solids back-mixing. Their
results demonstrated that CTFB operation may be attributed to a new flow regime, the
circulating turbulent fluidization regime, independent of turbulent fluidization, fast
fluidization and dense suspension upflow (Qi and Zhu, 2009)..
1.2
Available measurement technologies
Many techniques based on a variety of principles have been developed to study
hydrodynamics in fluidized beds and other gas–solids systems (Yates et al, 1994;
Bachalo, 1994). These methods can be broadly classified as: impact, isokinetic, flow
visualization, laser Doppler and cross-correlation techniques. The impact method is based
on measuring the force exerted on a small obstacle inserted in the flow path. The particle
velocity can then be related to the measured impact force (Heertjes, 1970). However,
calibration in this method is difficult, limiting its application (Massimilla, 1978; and
Donsi et al, 1980). Using an isokinetic sampling probe set along the flow direction to
collect particles can measure the mass flux and velocity of solid particles in the riser of
circulating fluidized beds. Dividing the amount of solids collected by the time of
collection and the open area of the sampling tube gives the mass flux of solid particles.
The isokinetic conditions are usually obtained by balancing the static pressure difference
inside and outside the sampling probe. However, to obtain particle velocity, it is
necessary to measure the solids concentration simultaneously (Monceaux et al, 1986;
Bader et al, 1988; Rhodes et al, 1988; Herb et al, 1992). Both impact and isokinetic
and often make continuous measurement possible (Donadono et al, 1978; Donsi et al,
1980). However, these devices tend to interfere with the flow system being investigated
and often require other parameters, such as the solids concentration, to be determined
simultaneously, thus increasing the complexity and reducing the accuracy. Direct visual
techniques have also been employed to measure particle velocity. These include
high-speed photography for dilute systems (Donadono et al, 1978; Donsi et al, 1980),
periodically excited fluorescent particles, other tracer techniques, and particle imaging
velocimetry PIV. These methods tend to be accurate and are usually non-intrusive.
Another advantage is that the whole pattern of particle movement may be obtained
instantly. However, analyses of the results tend to be very time-consuming and often
require a high-speed computation system. Another disadvantage is that the associated
equipment is generally expensive. Laser Doppler Velocimetry LDV is another powerful
instrument in fluid dynamics research, which is reliable, accurate and easy to use
(Bachalo, 1994; Adrian, 1991). The basis of this technique is that the frequency of light
scattered by a moving particle is subject to a Doppler shift and the particle velocity can
be determined by measuring the shift. This method has been demonstrated as being able
to accurately measure gas–solids velocities in gas–solid suspensions, with very small
seed particles added in the flow for gas velocity, over a velocity range from creeping to
hypersonic flow. The measurements are made in situ and non-intrusively in the flow
fields that range in size from less than a millimeter to many meters in cross-section. Levy
and Lockwood (1983), Kale and Eaton (1985), Hamdullahpur and Mackay (1986) and
Berkelmann and Renz (1989) have used LDV to measure particle and gas velocities in
optic path is available to the measurement site so that it is only suitable for dilute
suspensions. In addition, LDV instruments are costly. Cross-correlation technique has
been widely used in determining particle velocity. The principle is that individual or
groups of particles in the flow are detected at two locations aligned in the direction of
particle flow. The velocity can then be determined by computing the cross-correlation
function. A common technique is to cross-correlate capacitance signals from two nearby
needle probes. Mathur and Klinzing (1984) applied the cross-correlation method for
measuring the average particle velocity using signals from two commercial
dielectric-property measuring devices in pneumatic transport. Euzen et al (1993) used a capacitive
sensor to measure the particle velocity in a gas–solids reactor. The capacitive
measurement is based on variations in dielectric capacitance caused by the change in
solids concentration in a measuring volume. If the capacitance variations are measured at
two points fairly close to each other in the main particle flow direction, the solids velocity
can be obtained from cross-correlation of the two signals. Such capacitive measurements
are sensitive to electrostatic effects, so that good grounding is needed to decrease the
interference.
Cross-correlation technique is applicable to optic fiber probes containing light-emitting
and light-receiving fibers to detect reflected light from particles in their vicinity.
Measurements of particle velocity and concentration have been reported using optic fiber
probes in conventional low-velocity fluidized beds and pneumatic transport systems (Oki
et al, 1975; Shirai et al, 1977; Horio et al, 1980; Ishida et al, 1980; Patrose, 1982;
method is the preferential detection of the velocity of particle clusters over individually
flowing particles, especially when the gas–solids suspension is not very dilute. For both
the capacitance and light reflection signals, the passage of particles closely grouped
together in the form of clusters or agglomerates tends to cause much larger peaks than
individual particles. During cross-correlation, it is the large peaks in the signals which
dominate in determining the maximum of the cross-correlation function. On the other
hand, individual particles tend to travel at higher velocities in most gas–solids upflow
given their reduced slip velocities. As a result, the cross-correlation method tends to
underestimate the actual particle velocity in up-flow, while overestimating the magnitude
of the velocity for downflow systems. Another disadvantage of the cross-correlation
method is that it gives only an average value over extended periods. It provides no
information on the velocity distribution or the instantaneous velocity.
1.3
Hydrodynamics of TFB
Compared with other fluidization regimes, studies on hydrodynamics of turbulent
fluidized beds (TFB) are relatively scarce and mainly focusing on the macro structures,
such as dilute phase volume fraction and dense phase void. Knowledge of the local flow
structures of TFB had been started from the investigation on the properties of bubbles
(Lanneau, 1960). Assuming two distinct phases as in (TFB), dilute phase volume fraction
was obtained. Local void fractions were also roughly been deduced using gas tracer (Lee
and Kim, 1989), and from solids holdup signals measured by optical probes (Nieuwland
et al,1996; Farag et al, 1997; Zhang et al, 1997). However, it is questionable how to
seemed to reach similar conclusions: the dense phase void increased with increasing air
velocity in TFB (Werther and Wein 1994; Yamazaki et al, 1991). Relatively, only a few
studies focused on the macro structures of TFB. The radial non-uniformity decreased for
the higher static bed height due to smaller voids near the wall at higher axial positions.
Farag et al (1997) found two circulation cells in a column of diameter 0.3 m, and a more
homogeneous flow structure for a 0.5 m diameter column in the turbulent regime. The
greater homogeneity for the larger column could result from a lesser wall effect and
turbulent eddies disrupting gulf streaming (Ege, 1996). Core-annular structure was
observed in a FCC TFB by Zhu and Zhu (2008c). Obviously, studies on the flow
structures are not adequate to understand TFB regimes, possibly due to its transition
characteristics and lack of knowledge of TFB (Zhou et al, 2000).
TFB has not been always recognized as an actual fluidization regime (Bi et al, 2000). It
behaves like a continuous phase, where intermittent and interspersing voids and dense
pockets alternating. However, Rhodes (1996) did not considered turbulent regime as a
separate regime of dense fluidization. He equated this regime to dilute flow regime at
different suspension densities in the freeboard of a bubbling bed, to dilute region of a
CFB or even to pneumatic transport under certain conditions. Such a flow regime was
related to the variation of the solids inventory in the bed (Rhode, 1996). While Rhode did
not refer to the same flow as other researchers, he emphasized the importance of solids
There are also uncertainties about transition critical velocity determination. Yerushalmi
and Cankurt (1979) divided the transition flow regime between bubbling and fast
fluidization regimes into turbulent transition and turbulent fluidization regimes using
transient velocity uc, onset velocity uk and ending velocity utr. Using pressure drop signals
with pressure transducers along the bed, uc and uk were defined at the specific air
velocities corresponding to the maximum standard deviation and to the levelling off of
standard deviation of the pressure signals respectively. However, other authors found no
such a uk to mark the beginning of TFB (Kashkin et al, 2003). It is now widely
considered that TFB extends from uc to the onset of fast fluidization, utr (Bi et al, 2000).
This confusion resulted from the fact that pressure fluctuations of a gas-solid system and
flow regime transition are two different hydrodynamic phenomena. They may or may not
coincide in the same pace or pattern (Horio et al, 1992). Therefore, it might be a proper
way to relate the critical air velocity of TFB to the standard deviation of the local solids
holdup, one property parameter of local flow structures of TFB (Zhu and Zhu, 2008).
The confusion on the ending air velocity of TFB or onset air velocity of CFB, utr was
attributed to the lack of knowledge about how the flow structure of a gas-solid system
transited from TFB to CFB (Kashkin et al, 2003). TFB can operate at much higher than
particles terminal velocity and at higher density than dilute transport as there exist plenty
of high density clusters (Guilherme et al, 2009) and different flow structures compared to
BFB and CFB (He et al, 2009). As the ending of TFB responds just to the onset of CFB,
the high density flow structure and solids circulation are two important factors
as the transport air velocity close to terminal velocity of median particle using pressure
diagram. The transport velocity, corresponding to the saturation carrying capability of the
gas-solid system, is used in defining the regime transition between the dilute transport
suspension flow and fast fluidization (Xu et al, 2001; Yang, 2004). Schnitzlein et al
(1988) also found such a velocity did not mark any observable changes of flow structure.
Related to choking velocity and solids circulation rate, a significant entrainment velocity
in the fluidized bed was defined as the transition point from TFB to CFB (Bi, 1994),
while high solids circulation of 50kg/m2s was obtained in an FCC particle CTFB at 0.70
m/s air velocity equal to uc (Zhu and Zhu, 2008b).
There were also debates on the void velocity in TFB. Pointing at studies on void rising
being analogous to the bubbling regime (Lanneau, 1960; Yamazaki et al, 1991; Lu et al,
1997; Farag et al, 1997; Taxil et al, 1998), other researchers found that voids in turbulent
fluidized beds tend to be small and transient, with indistinct or irregular boundaries
(Rowe & MacGillivray, 1980; Lee & Kim, 1989). As ug > 0.6m/s, it was very hard to
identify the voids in TFB due to their rapid rising (Lanneau, 1960). Negative rise
velocities in the centre of TFB of diameter 0.3 m were observed by Farag et al (1997),
indicating a circulation pattern where gas travels downwards near the axis and upwards
near the wall. Taxil et al (1998) found a correlation between the void chord length and
rise velocity, which was widely used in measuring the bubble rising velocity in bubbling
fluidized bed. Using cross-correlation method on solids holdup signals measured by dual
and downward particle velocities, indicating potential applications of cross-correlation
methods in studies on TFB.
1.4
Studies on circulating turbulent fluidized bed (CTFB)
CFB and TFB can mostly make up their shortcomings one another (Zhu and Zhu, 2008a).
This raises a question how to combine them together without losing their merits and to
make the fluidization reactors more efficient (Zhu and Bi, 1995). Zhu and Zhu (2008a)
integrated a conventional turbulent fluidized bed into a high-density circulating system to
simultaneously achieve high efficient gas-solid contact and low solids backmixing. Their
investigations proved the benefits of such a combination. The results at ug = 1.0, 2.0 m/s
and Gs = 50, 150 kg/m2s demonstrated that the CTFB is capable of: (1) recycling
particles and maintaining a high solids concentration and gas-solid reaction intensity; (2)
handling high particle capacity with low gas by-passing; (3) exhibiting no net downflow
of solids over the whole section; (4) providing axial homogenous flow and enforced
radial homogeneity of the solids suspension (Zhu and Zhu, 2008a and c). Their results
demonstrated that the CTFB operation is achievable and its flow structure can be
attributed to a new flow regime, the circulating turbulent fluidization regime, independent
of turbulent fluidization, fast fluidization and dense suspension upflow (Zhu, 2010; Qi
and Zhu, 2009). Obviously, reported investigation results on CTFB are not adequate in
understanding the new fluidization regime and designing CTFB reactors. Experiments
depict CTFB macroscopically and microscopically, especially on the transition
mechanism and detailed hydrodynamics of CTFB.
1.5
Objectives
The objectives in this thesis are composed of the following five parts:
1) Study hydrodynamics and detailed flow structures of BFB, TFB, CTFB, CFB and
HDCFB to explore the transition, the differences and similarities across the regimes and
to further distinguish the new fluidization regime, CTFB, from the other regimes;
2) Study the transient mechanism and characteristics spanning from BFB to HDCFB to
define the criteria for determining the transient critical air velocities demarcating the
novel circulating turbulent fluidized bed;
3) Investigate properties of the dense and dilute phases in the various fluidized beds to
further characterize the heterogeneous flow structures observed at high density and high
solids flux;
4) Analyze dynamic behaviors of the dense and dilute phases in CTFB, such as, phase
particle velocities in upward and downward directions, slip velocity, apparent particle
5) Establish new data processing methods to divide the dense and dilute phases and to
compute the phase particle velocities.
1.6
Thesis organization
Following the introductory, a comprehensive literature review on hydrodynamics of
gas-solid fluidization is presented in chapter 1.
Chapter 2 provides the details about the experimental apparatus, the measurement techniques
and experimental procedures in this study.
Chapter 3 presents the calibration procedure of optical fibre probes at low and high solids
concentrations. A novel technique is developed for this calibration, with which
significant improvements are made on high solids concentration over previous reported
investigations. Using this technique, the probes are uniquely calibrated in a downer and
in a pseudo bubble-free fluidized bed for FCC powders to obtain the calibration curves.
In Chapter 4, a Moment Consistency Data Processing Method (MCDPM) is proposed
based on statistical parameters of the experimental data. From microscopic point, three
parameters, the solids holdups of the dense and dilute phases and the relative phase
fraction, are obtained using MCDPM in bubbling (BFB), turbulent (TFB), circulating
turbulent (CTFB), circulating (CFB) and high density circulating (HDCFB), displaying
the different flow structures in the 5 regimes. Using the 3 parameters, the average values
and the non-uniformity indices are discussed to explore the flow transition, differences
and similarities across the 5 regimes. The micro flow structures in the 5 regimes are also
discussed through the probability density function (PDF), skewness and kurtosis of the
In Chapters 5, the transition mechanism of a circulating turbulent fluidized bed is
analyzed through the solids holdup fluctuation, the profiles of the skewness and kurtosis
of the solids holdup data, and variation of PDF. The determination criteria for two
transition air velocities of CTFB are proposed, corresponding to the transitions from BFB
to CTFB and from CTFB to CFB.
In Chapter 6, the detailed hydrodynamics of CTFB are analyzed through the axial and
radial profiles of solids holdup, and variation of the annular average solids holdups of the
dense and dilute phase and relative phase fraction, suggesting the different flow structure
in CTFB from that in other fluidization regimes. The solids circulation effect on the flow
is also explored, suggesting the interior solids circulation structure in CTFB is different
from that in conventional TFB. Typical characteristics of CTFB are also discussed.
In Chapter 7, based on the phase division procedure proposed with MCDPM, a Divided
Phase Cross-Correlation Method (DPCCM) for studying the particle movements in the
dense and dilute phases is established by cross-correlating the solids holdup signals of the
dense and dilute phases. Using DPCCM, phase particle movement is studied, and phase
particle ship velocity, apparent particle velocity, and net local solids flux are defined and
discussed to explore the effects of solids circulation on the flow in CTFB.
Chapter 8 summarizes the major findings of this study with recommendations for
Reference
Adrian R.J., (1991), Rev. Fluid Mech., 23, 261
Bachalo W.D., (1994), Int. J. Multiphase Flow, 20, 261, (suppl.)
Bader R., J. Findley and T.M. Knowlton, (1988), Circulating Fluidized Technology II, Pergamon, Toronto, pp. 123–137.
Berkelmann K.G. and Renz U., (1989), Fluidization VI, Engineering Foundation, New York, pp. 105–112.
Bi X., (1994), Flow regime transitions in gas-solid fluidization and transport, Ph.D. dissertation, University of British Columbia, Vancouver, Canada
Bi H. T., Ellis N., Abba I. A. and Grace J. R., (2000), Review: A state-of-the-art review of gas-solid turbulent fluidization, Chemical Engineering Science 55 4789-4825
Bi H. T. and Su P., (2001), Local Phase Holdups in Gas-Solids fluidization and Transport, AIChE Journal, Vol. 47(9), 2025
Crescitelli S., Donsi G., Russo G., and Clift R., (1978), High velocity behaviour of fluidized beds: Slugs and turbulent flow. In S. Schlosser, Selected papers presented at the sixth international congress CHISA '78, Prague (pp. 1-11).
Donadono S. and L. Massimilla, (1978), Cambridge Univ. Press, UK, pp.375–381
Ege P., Grislinga A. and deLasa H. I., (1996), Modelling turbulent fluidized bed reactors: Tracer and "bre optic probe studies. Chemical Engineering Journal, 61, 179-190
Euzen J.P., P. Trambouze and J.P. Wauquier, (1993), Eds.., Scale-up Methodology for Chemical Processes, Gulf Publishing, Houston, Chap. 4
Farag H. I., Ege P. E., Grislinga A. and deLasa H. I, (1997), Flow patterns in a pilot plant-scale turbulent fluidized bed reactor: Concurrent application of tracers and fiber optic sensors. Canadian Journal of Chemical Engineering, 75, 851-860
Guilherme J. Castilho and Marco A. Cremasco, (2009), Experimental Study In A Short Circulating Fluidized Bed Riser, Particulate Science And Technology, 27: 210–221 Grace J. R., (1990), High Velocity Fluidized Bed Reactors, Chem. Eng. Sci., 45, 1953-1966,
Hamdullahpur F. and Mackay G.D.W., (1986), AIChE J, 32, 2047.
He Y., Deen N. G., van Sint Annal and M. Kuipers J. A. M., (2009), Gas Solid Turbulent flow in a Circulating fluidized Bed Riser: Experimental and Numerical Study of Mono-disperse Particle Systems, Ind. Eng. Chem. Res., 48, 8091–8097
Heertjes P.W., J. Verloop and R. Willems, (1970), Powder Technol., 4, 38
Herb B., Dou S., Tuzla K. and Chen, J.C., (1992), “Solid mass fluxes in circulating fluidized beds”, Powder Technology, 70, 197-205
Horio M., A. Taki, Y.S. Hsieh and I. Muchi, (1980), Fluidization, Plenum, New York, pp. 509–518
Ishida M. and T. Shirai, (1980), Powder Technol., 27, 1
Jahnig C.E., Campbell D.L. and Martin H.A., (1980), “History of Fluidized Solids Development at EXXON”, Fluidization, (eds. J.R. Grace and J.M. Matsen), Plenum Press, New York, 3-24
Kale S.R. and J.K. Eaton, (1985), Int. J. Multiphase Flow, 11, 659.
Kashkin V. N. and Lakhmostov V. S., (2003), Studies on the onset velocity of turbulent fluidization for alpha-alumina particles,Chemical Engineering Journal, 91, 215–218
Kehoe P.W.K. and Davidson J.F., (1970), “Continuously slugging fluidized beds”, Chemeca '70, Institution of Chemical Engineers Symposium Series, Australia: Butterworths, 33, 97-116
Lanneau K. P., (1960), “Gas-solids contacting in fluidized beds”, Transactions of the Institution of Chemical Engineers, 38, 125-137
Lee G. S. and Kim S. D., (1989), Gas mixing in slugging and turbulent fluidized beds,
Chemical Engineering Communications, 86, 91-111
Levy Y. and F.C. Lockwood, AIChE J., 29, 1983, 889
Lu C., Xu Y., Shi M. and Shen F., (1997), Two-area model for bubble distribution in a turbulent fluidized bed of fine particles, Chinese Journal of Chemical Engineering, 5(4), 287-295
Massimilla L. and Donadono S., (1978), Cambridge Univ. Press, UK, pp. 375–381.
Matheson G.L., W.A. Herbst and P.R. Holt, (1949), "Characteristics of fluid-solid systems,"
Mathur M.P. and G. Klinzing, (1984), Part. Sci. Technol, 2, 223
Monceaux L., M. Azzi, Y. Molodtof and J.F. Large, (1986), Fluidization V, Engineering Foundation, New York, pp. 337–344
Nieuwland, J. J. etc., (1996), Measurement of solid concentration and axial solids velocity in gas-solid two phase flow, Powder Technology, 87, 127–139
Oki K., T. Akehata and T. Shirai, (1975), Powder Technol., 11, 51
Patrose B. and H.S. Caram, (1982), AIChE J, 28, 604
Perales J. F., T. Coll, M. F. Llop, L.,Puigjaner, J. Arnaldos and J. Casal, (1990), On the Transition from Bubbling to Fast Fluidization Regimes, Circulating Fluidized Bed Technology, Vol. 111, p.73, P. Basu, M. Horio, and M. Hasatani, eds., Pergamon Press, Oxford.
Qi X., Zhu H. and Zhu J., (2009), Demarcation of a New Circulating Turbulent fluidization Regime, AIChE Journal Vol. 55, No. 3, 595
Rathbone R.R., M. Ghadiri and R. Clift, (1989), Fluidization VI, Engineering Foundation, New York, pp. 629–635
Rhodes M.J., P. Laussmann, F. Villain and D. Geldart, (1988), Circulating Fluidized Technology II, Pergamon, Toronto, pp. 155–164.
Rowe P. N. and MacGillivray H. J. (1980), The structure of a 15 cm diameter gas fluidized bed operated at up to 1 m/s and seen by X-rays. In J. R. Grace, & J. M. Matsen,
Fluidization (pp. 545-553), New York: Plenum Press
Schnitzlein M. G. and Weinstein H., (1988), Flow characterization in high-velocity fluidized beds using pressure fluctuations. Chemical Engineering Science, 43, 2605-2614
Shirai T., M. Ishida and Y. Tto, N. Inoue and S. Kobayashi, (1977), J. Chem. Eng. Jpn., 10, 40.
Squires A.M. (1986), “The story of fluid catalytic cracking: The first circulating fluid bed”, Circulating Fluidized Bed Technology, (eds. P. Basu), Pergamon Press, Toronto, 1-19
Taxil I., Guigon P., Archimbault F. and Gauthier T. A., (1998), Gas flow characterization in turbulent fluidization for FCC catalyst. In L. S. Fan, & T.M. Knowlton, Fluidization IX
(pp. 69-76). New York: Engineering Foundation
Thiel W. J. and O. E. Potter, (1977), “Slugging in Fluidized Beds,” Ind. Eng. Chem. Fund., 16, 242
Wang J., (2010), Flow structures inside a large-scale turbulent fluidized bed of FCC particles: Eulerian simulation with an EMMS-based sub-grid scale model, Particuology, 8, 176–185
Xu G., Nomura K., Gao S. and Kato, K., (2001), More Fundamentals of Dilute Suspension Collapse and Choking for Vertical Conveying Systems, Vol. 47, No. 10, AIChE Journal, 2177
Yamazaki R., Asai M., Nakajima M. and Jimbo G. (1991), Characteristics of transition regime in a turbulent fluidized bed, Proceedings of the forth China-Japan yuidization conference (pp. 720-725), Beijing: Science Press
Yang W., (2004), “Choking” Revisited, Ind. Eng. Chem. Res., 43, 5496-5506
Yates J. G. and .J.R. Simons, (1994), Int. J. Multiphase Flow, 20, 297, (suppl.)
Yerushalmi J., Turner D.H. and Squires A.M., (1976), “The fast fluidized bed”, Ind. Engrng. Chem., Proc. Des. Dev., 15, 47-57
Yerushalmi J. and N. T. Cankurt, (1979), Further Studies of the Regimes of Fluidization, Powder Technology, 24 187 - 205
Zenz F.A., (1949), “Two-phase fluidized-solid flow”, Ind. Engrng Chem., 41, 2801-2806
Zhang X. and Qian Y., (1997), Mass transfer between the bubble and emulsion phase in a turbulent fluidized bed with FCC particles. In Q. Yu & C. Huanqin, Advances in environmental engineering and chemical engineering (pp. 190}193). Guangzhou, China: South China University of Technology Press
Zhou C., M.C. Slaughter and S.L. Soo, (1991), Rev. Sci. Instrum., 62, 2036
Zhu J. (2010), Circulating turbulent fluidization—A new fluidization regime or just a transitional phenomenon, Particuology, 8, Pages 640-644
Zhu J. and Bi H., (1995), Distinctions between Low Density and High Density Circulating Fluidized Beds, The Canadian Journal of Chemical Engineering, Volume 73, 644
Zhu Haiyan and Jesse Zhu, (2008a), Gas-Solids Flow Structures in a Novel Circulating-Turbulent Fluidized Bed, AIChE Journal, Vol. 54, No. 5, 1213
Zhu Haiyan and Jesse Zhu, (2008b), New Investigation in Regime Transition from Bubbling to Turbulent Fluidization, The Canadian Journal of Chemical Engineering, Vol. 86(6), 553
Zhu Haiyan and Jesse Zhu, (2008c), Comparative study of flow structures in a circulating-turbulent fluidized bed, Chemical Engineering Science, 63, 2920-2927
2
Experimental Apparatus and Measurement Technique
2.1
Circulating turbulent fluidized bed
To conduct the experiments on the detailed hydrodynamics of CTFB, a solids circulating
loop was setup, where two parallel columns (riser and downcomer) connected with a
bottom inclined tube and a smooth top bent as shown in Fig. 1. The riser column i.d. is
0.101 m and its height is 3.6m at lower part and an upper quick discharging section with
a diameter of 0.203 m and a total height of 6.4 m. At the bottom of the riser a disk type
air distributor was also installed, and an annular air distributor was installed between the
CTFB column and the upper discharge section, both being perforated with 12.6% free
area. The smooth bent on the top of quick discharging section was connected to a primary
cyclone at the inner top of a down comer, the other column (i.d. 0.305 m) in the loop. A
solid control valve was installed in the inclined tube and a solids circulation rate
measurement device with two flapper valves in the top section of the downcomer just
below the primary cyclone to measure the solids flow rate. Before air discharge, two
other standard cyclones and a bag filter house were linked between the exit of the
primary cyclone and the air discharge line in series, where fine particle was captured and
returned to a seal tank connected the downcomer below the solid circulation flow rate
control device.
Two streams of metered air were supplied through two orifice plates, regarded as primary
and secondary air. The primary air fluidized the particles coming from the downcomer at
proper flow rate was able to quickly discharge the particles out of CTFB to maximum
particle delivery capacity by relatively increasing the backpressure of the downcomer and
dragging force of the primary air. Most of the entrained particles in gas-solid stream from
the quick discharge section were separated in the primary cyclone and back to the
circulating process with or without being measured according to the experiment
requirements, while the clean air was discharged downstream at the filter. The special
design of the quick discharge section made it possible for CTFB to operate at high solids
circulation rates and high suspension density at superficial gas velocity of 1–5 m/s. FCC
particles with a particle density of 1780 kg/m3 and a Sauter mean diameter of 76 µm was
used in the experiments, and air was at the relative humidity of 70 and 80% maintained
using steam supply to minimize the electrostatic effects.
2.2
Particle Properties
Spent fluid catalytic cracking (FCC) catalyst with a particle density of 1780 kg/m3 and a
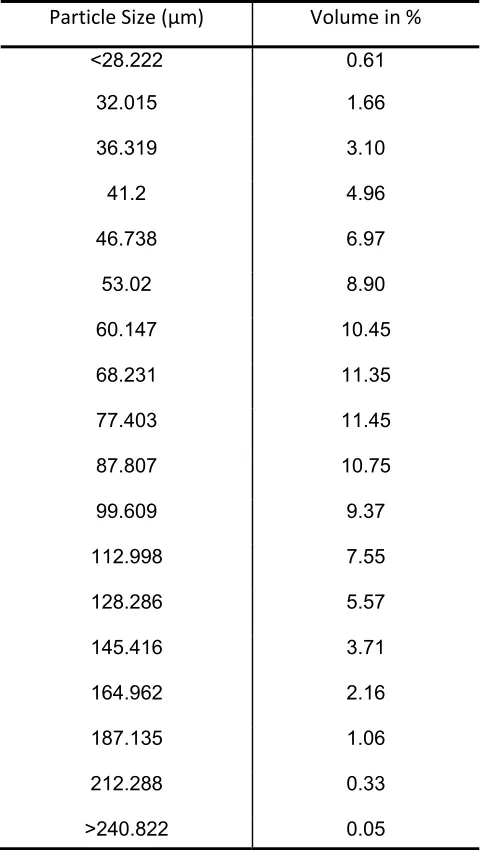
Sauter mean diameter of 65 µm was used as solid phase. The particle size distribution is
summarized in Table 2.1.
Table 2.1 FCC particle size distributions
Particle Size (μm) Volume in %
<28.222 0.61 32.015 1.66 36.319 3.10 41.2 4.96 46.738 6.97
2.3
Measurement Techniques
Experimental studies conducted in this research include the following parameters
measurements: superficial gas velocity, ug; pressure gradient along the column, ΔP/ΔH;
local solids holdup, εs; solids circulation rate, Gs; and local particle velocity, vp.
2.3.1
Measurement of superficial gas velocity
Superficial gas velocity in the three fluidized beds was measured by a sharp-edged orifice
meter on which vena-contracta taps had been installed. The orifice meter was designed
following the ASME standards (American Society of Mechanical Engineers, New York,
1959) so that the performance of the orifice meter could be predicted accurately without
calibration (McCabe et al, 1993). Eq. 2.1 is used in this study to calculate the air
flow-rate: g g O H h g YS C Q ) ( 2 1 2 4 0
0
(2.1)
Where Q is the volume flow-rate of air through the orifice (m3/s); C0 is the orifice
coefficient and it is taken as 0.609 for vena-contracta taps; β is the ratio of orifice
diameter to tube diameter; S0 is the cross-sectional area of the orifice; Δh is the pressure
drop reading, which shows the pressure drop across the orifice, mH2O; ρg is the air
density when flowing through the orifice; and Y is an expansion factor, which provides
modification of the equation when the fluid is not incompressible. An empirical equation
for Y of a standard sharp edged orifice is available (Fluid Meters: The theory and
) 1 ( 35 . 0 41 . 0 1 2 1 4 p p
Y
(2.2)
where p1 and p2 are the pressures at stations 1 and 2, which are positioned before and
after the orifice plate; γ is the isentropic exponent and it is taken as 1.40 when the gas is
considered ideal.
The superficial gas velocity in a fluidized bed is dependent upon both volumetric
flow-rate at the orifice meter and the pressure ratio Pc/Pm, where Pc is the pressure at the inlets
of the bed; Pm is the pressure at the upstream of the orifice meter. The superficial gas
velocity can be calculated using Eq. 2.3. S is the cross-sectional area of the bed.
m c g P P S Q
u (2.3)
2.3.2
Differential pressure measurement
To obtain pressure drops along the bed, 10 pieces of differential pressure transducers
from Omega Engineering (PX163-120D5V and PX162-027D5V) were installed along the
riser. Excitation voltage supplying to these pressure transducers was 8 VDC (at 20 mA
each), giving a voltage output of 1 to 5 VDC over its pressure ranges. Manometers were
used to calibrate the pressure transducers: Air source of 20 psig was connected to one end
of the meter and the high-pressure pin of the unidirectional differential pressure
transducer. The other end of the U-tube and the other pin of the pressure transducer were
open to room air. The typical calibration data were well agreeable with a linear
proportional to the pressure drop in the range of 0 to 10 kPa. For all experiments, the
signals of the differential pressure fluctuations were sampled with a frequency of 1000
Hz and stored on a hard disk of a computer. The total acquisition time was 40s and thus
the maximum length of the time series was 40,000 points. The locations of pressure taps
along the fluidized bed are shown in Table 2.2. It can be seen that the lowest position is
0.3 m higher than the gas distributor, which is above the primary bubble formation and
coalescence controlled region.
Table 2.2 Locations of pressure transducers
Section: range (m) Mid-elevation (m)
0.244-0.515 379.5
0.515-0.812 663.5
0.812-1.095 953.5
1.095-1.478 1286.52
1.478-1.819 1648.62
1.819-2.209 2014.38
2.209-2.697 2453.4
2.697-3.005 2851.32
3.005-3.427 3216.5
2.3.3
Local solids holdup measurement
Experimental data were acquired using four multi-fibre optical reflective probes of model
PV-6, developed by the Institute of Process Engineering, Chinese Academy of Sciences,
Beijing, China. Each of the four probes consists of two fibre bundles located on the same
vertical line. Each bundle is composed of both light-emitting and receiving quartz fibres
arranged in an alternating array, corresponding to emitting and receiving layers of fibres.
The diameter of each fibre was 25 µm. Light from a light emitting diode (LED) transmits
through the emitting half of the fibres to the tip, where upon hitting particle(s) in the riser,
will be reflected back to the probe. The intensity of the reflected light depends on the
concentration, size distribution, composition, and shape of the particles. The received
light reflected by the particles was converted by a photo-multiplier into voltage signals.
The voltage signals were further amplified and fed into a PC. The sampling rate was 50
kHz and data were collected for 131 sec. A special calibration procedure in high particle
density environment had been carried out and the calibration curves had been obtained to
convert the voltage data to solids holdups, following the procedure proposed by Zhang et
al (1998).
The probes were setup at four separate axial elevations and traversed horizontally to
measure local solids holdups at eleven radial positions (Fig. 2.2). The four axial locations
were chosen in an effort to characterize the acceleration zone (0.8m) and the fully
developed zone (1.5, 2.2 and 3.0m). Radial positions were chosen at the midpoints of
0.98) at each axial level within the risers. There were two PV6 units used in the
experiments: a master and a slave. A special setup procedure was carried out for the two
units to control four probes and a special data processing method was implemented with
normalized calibration curves and different unit gains and offsets to obtain consistent
experimental results throughout the bed. At one radial location two adjacent probes were
connected to the units and then switched to the other two. To ensure the consistency of
the data at one specific operating condition, the data at all anticipated locations were
collected within one run by the four probes.
From the solids holdup signals, the heterogeneous flow structures in a fluidized bed can
be studied macroscopically and microscopically by signal moment estimations, such as
mean solids holdup, s, standard deviation σ, skewness S and kurtosis K (Eqs. 2.2-2.5).
N i i s N 1 1
(2.4)
N i s i N 1 2 / 1 2] ) ( 1 1 [ (2.5)
Figure 2.2 Setup of optical fibre probes and pressure transducers
2.3.4
Cross-correlation method of particle velocity
In addition to being converted to the local solids holdup, the dual signals of solids
holdup acquired by a two-channel optical fibre probe can be used in computing the
particle velocity. To measure the solids holdup fluctuations, the two channels of the
probe are aligned vertically, and they respond to upward or down ward movements of
the particle in front of the probe. If a particle or a cluster velocity is vs, there is a time
delay τ for both of the channel detecting the same particle or cluster, as shown Eq. 2.8.
d
vs (2.8)
Optical fibre robes
where d is the distance between the two channels. The time delay can be calculated using
cross-correlation method, as shown by Eq. 2.9. For different time delay, τ, Eq. 2.9 gives
different cross-correlation coefficient and only the time delay corresponding to the
maximum coefficients are used in producing instantaneous particle velocity solutions
over a given tiny time period using Eq. 2.8. For dual solids holdup signals, εs1(t) and εs2
(t), the cross-correlation can be expressed as
t t tN s s
N s s
N s s s s n n n n 2 2 , 2 , 2 1 , 1 , 2 , 2 , 1 , 1 , ) ) ( ( ) ) ( ( )] ) ( )( ) ( [( ) ( (2.9)
Using instantaneous particle velocity and solids holdup, other local parameters can be
derived, such as local flux, local net flux, average particle velocity and solids circulation
rate, etc, as shown in Eqs. 2.10-2.13.
t T j i s j i s j i p j is v t t dt
T
F ,, ( ) ,, ( )
, ,
,
, (2.10)
si j
l
s F
G , ,, (2.11)
t T j i s j i j is v t dt
T
V 1 ,, ( )
, , , (2.12)
t T l ss G dr
R
G 2 , (2.13)
2.3.5
Solids circulation rate measurement
The measuring device of solids circulation rate is located at the top of the downcomer.
Two half butterfly valves and the vertical separate board conduct and collect the particles
valves from one side to the other, solids circulated through the system can be
accumulated in one side of the measuring section for a given time period to provide the
solids circulation rate:
t S V
G b
s
(2.14)
where V is the volume of the half section during time period (Δt), m3;
Nomenclature
d, distance between the emitting and receiving optical fibre bundles of the probe, m
Fp, phase solids flux, kg/m2s
Gs, cross-sectional average net solids flux or solids circulation rate, kg/m2s
sl
G , local net solids flux, kg/m2s
K, standard kurtosis of local solids holdup fluctuations
N, population of a time series
R, radius of the column, m
S, skewness of local solids holdup fluctuations
T, time, s
V, local average particle velocity, m/s
s
V , apparent particle velocity, m/s
r, radial position, m