ISSN(Online): 2319-8753 ISSN (Print): 2347-6710
I
nternational
J
ournal of
I
nnovative
R
esearch in
S
cience,
E
ngineering and
T
echnology
(A High Impact Factor, Monthly, Peer Reviewed Journal) Visit: www.ijirset.com
Vol. 8, Issue 11, November 2019
A Biomechanical Approach for the Study of
Two Phase Blood Flow through Venules
during Tuberculosis
Khushboo Tripathi
1, A. K. Agrawal
2, V.Upadhyay
3, J.P.Singh
4Research Scholar, Dept. of Physical Sciences, M.G.C.Gramodaya Vishwavidyalay, Chitrakoot, Satna (M.P.), India1 Associate Professor, Dept. of Physical Sciences, M.G.C.Gramodaya Vishwavidyalay, Chitrakoot, Satna (M.P.), India2,3
Assistant Professor, Dept. of Applied Science, Greater Noida Institue of Technology, Greater Noida (U.P.), India4
ABSTRACT: A mathematical model for blood flow through veinules is discussed in this paper. Blood has been represented by a non Newtonian fluid obeying Herschel-Bulkley fluid. The variation of blood flow fluctuation and blood pressure during tuberculosis hasbeen analyzed by numerical techniques. The role of hematocrit explicit in determination of pressure drop.
KEYWORDS: Hematocrit, Blood Flow, Herschel Bulkleynon-Newtonian model, circulatory system.
I. INTRODUCTION
The lungs are pyramid shaped paired organs that are connected to the trachea by the right and left bronchi; on the inferior surface. The lungs are bordered by the diaphragm. The lungs are enclosed by the pleurae, which are attached to the mediastinum. The right lung is shorter and wider than the left lung and the left lung occupies a smaller volume than the right. Each lung is composed of smaller unit called lobes fissures separate these lobes from each other the right lung consist of three lobes: the superior, middle and inferior lobes. The left lung consists of two lobes: the superior and inferior lobes [1].Tuberculosis is caused by infection with the bacterium mycobacterium tuberculosis. It is primarily transmitted by the respiratory route; individuals with active disease may infect others if the airborne particles they produce when they cough, talk or sing are inhaled by others. Once infected, an individual’s enters a period of latency during which he exhibits no symptoms and is not infectious to others [2].Lungs receive the whole amount of blood that is pumped out from right ventricle. Output of blood per minute is same in both right and left ventricle. It is about 5 liter. Thus, the lungs accommodate amount of blood, which is equal to amount of blood accommodated by all other part of body [3].
II. BASIC BIO FLUID EQUATION FOR TWO PHASE BLOOD FLOW
Blood is mixed fluid. Mainly there are two phases in blood. The first phase is plasma, while the other is that of blood cells are enclosed with semi permeable membrane whose density is greater than that of plasma. These blood cells are uniformly distributed in plasma. Thus blood can be considered as a homogenous mixture of two phases [4].
Equation of continuity: The flow of blood is affected by the presence of blood cells. This effect is directly proportional to the volume occupied by blood cells [5]. The mass ratio of blood cells to plasma r is defined by-
𝑟 = 𝑋𝜌𝐶
1−𝑋 𝜌𝑃 ……….(1)
ISSN(Online): 2319-8753 ISSN (Print): 2347-6710
I
nternational
J
ournal of
I
nnovative
R
esearch in
S
cience,
E
ngineering and
T
echnology
(A High Impact Factor, Monthly, Peer Reviewed Journal) Visit: www.ijirset.com
Vol. 8, Issue 11, November 2019
𝜌𝑝= density of blood plasma.
𝑋 = Volume portion covered by blood cells.
1 − 𝑋 = Volume portion covered by plasma.
The both phase of blood that means blood cells and plasma move with the common velocity. Hence equation of continuity for two phases according to the principle of conservation of mass defined as follows-
𝜕 𝑋𝜌𝑐
𝜕𝑡 + 𝑋𝜌𝑐𝑣 𝑖 ,
j = 0 ………...….. (2)
𝜕 1−X ρp
𝜕𝑧 + 1 − 𝑋 𝜌𝑝𝑣 𝑖 ,
j = 0 ………..… (3)
Where 𝑣 is the common velocity of two phase blood cells and plasma. If we define the uniform density of the blood 𝜌𝑚 as follow-
1+𝑟
𝜌𝑚 =
𝑟 𝜌𝑐+
1
𝜌𝑝 ……….… (4)
Above equation can be combined together as follows, 𝜕 𝜌𝑚
𝜕𝑡 + 𝜌𝑚𝑣
𝑖 ,
j = 0. ……… (5)
III. EQUATION OF MOTION FOR TWO PHASE BLOOD FLOW
The hydro dynamical pressure 𝑝 between the two phases of blood can be supposed to uniform because the both phases are always in equilibrium state in blood [6]. Taking viscosity coefficient of blood cells to be 𝜂𝑐 and applying the principle of conservation of momentum, we get the equation of motion for the phase of blood cells as follows:
𝑋𝜌𝑐 𝜕𝑣𝑖
𝜕𝑡 + 𝑋𝜌𝑐𝑣 𝑖 𝑣
,𝑗𝑖 = −𝑋𝑝,𝑗𝑔𝑖𝑗 + 𝑋𝜂𝑐 𝑔𝑗𝑘𝑣𝑘𝑖 ,𝑗 ………..………..……… (6)
The equation of motion for plasma will be as follows:
1 − 𝑋 𝜌𝑝 𝜕𝑣𝑖
𝜕𝑡 + 1 − 𝑋 𝜌𝑝𝑣 𝑖 𝑣
,𝑗𝑖 = − 1 − 𝑋 𝑝,𝑗𝑔𝑖𝑗 + 1 − 𝑋 𝜂𝑐 𝑔𝑗𝑘𝑣,𝑘𝑖 ,𝑗 ………..…….. (7) From above equations, we have
𝜌𝑚 𝜕𝑣𝑖
𝜕𝑡 + 𝜌𝑚𝑣 𝑗 𝑣
,𝑗𝑖 = −𝑝,𝑗 + 𝜂𝑚 𝑔𝑗𝑘𝑣𝑘𝑖 ,𝑗 ………...…. (8) Where 𝜂𝑚 = 𝑋𝜂𝑐+ 1 − 𝑋 𝜂𝑝is the viscosity coefficient of blood as a mixture of two phases.
IV. MATHEMATICAL MODELING
As the velocity of blood flow decreases, the viscosity of blood increases. The velocity of blood decreases successively. The Herschel Bulkley law holds good on the two phase blood flow through veinules and whose constitutive equation is as follows:
𝑇′ = 𝜂𝑚𝑒𝑛+ 𝑇𝑝(𝑇′> 𝑇𝑝)and 𝑒 = 0(𝑇′ < 𝑇𝑝), where 𝑇𝑝 is the yield stress. When strain rate 𝑒 = 0(𝑇′< 𝑇
𝑝) a core region is formed which flows just like a plug. Let the radius of the plug be𝑟𝑝, The stress acting on the surface of plug will be 𝑇𝑝. Equating the forces acting on the plug, we get,
𝑃𝜋𝑟𝑝2= Tp2πrp
Implies that 𝑟𝑝 = 2 𝑇𝑝
𝑃 ……….. (9)
𝜂𝑝 = viscosity of plasma layer
The constitutive equation of the blood vessel is
𝑇′ = 𝜂
𝑚𝑒𝑛+ 𝑇𝑝
𝑇′− 𝑇
ISSN(Online): 2319-8753 ISSN (Print): 2347-6710
I
nternational
J
ournal of
I
nnovative
R
esearch in
S
cience,
E
ngineering and
T
echnology
(A High Impact Factor, Monthly, Peer Reviewed Journal) Visit: www.ijirset.com
Vol. 8, Issue 11, November 2019
𝜌𝑚 = 𝑋𝜌𝑐+ 1 − 𝑋 𝜌𝑝
The blood flow in capillary is symmetric w. r t. axis. Hence,
𝑣𝜃 = 0, 𝑣𝑧, 𝑣𝑟 and 𝑝 do not depend upon θ
Since the one component of velocity which is along axis is effective We have,
𝑣𝜃 = 0, 𝑣𝑧= 𝑣, 𝑣𝑟 = 0 Since flow is steady,
𝜕𝑝 𝜕𝑡 =
𝜕𝑣𝑟
𝜕𝑡 =
𝜕𝑣𝜃
𝜕𝑡 =
𝜕𝑣𝑧
𝜕𝑡 = 0 𝜕𝑣𝑧
𝜕𝑧 = 0 𝑣𝑧= 𝑣 𝑟
𝑟Component
𝜌𝑚 0 =
𝜕𝜌
𝜕𝑟+ 𝜂𝑚 0 𝜕𝑝
𝜕𝑟= 0 𝑝 = 𝑝 𝑧 𝜃Component
𝜌𝑚 0 = 0 + 𝜂𝑚 0
0 = 0 𝑧 Componnt
𝜌𝑚𝑣 𝜕𝑣
𝜕𝑡 = −
𝜕𝑝 𝜕𝑧 + 𝜂𝑚
1 𝑟
𝜕 𝑟𝜕 𝑣𝑧𝜕𝑟
𝜕𝑟 +
𝜕𝑦
𝜕𝑥 ……… (10)
And pressure 𝑝 depends on z
Pressure gradient 𝑑𝑝
𝑑𝑧 = 𝑝, 𝑟 𝑑𝑣 𝑑𝑧
𝑛
= −𝑝𝑟2
2𝜂𝑚+ 𝐴 Using boundary condition- at 𝑟 = 0, 𝑣 = 𝑣0 then 𝐴 = 0
− 𝑑𝑣 𝑑𝑟 =
𝑝𝑟 2𝜂𝑚
1 𝑛
−𝑑𝑣 𝑑𝑟=
𝑝𝑟 − 𝑝𝑟𝑝
2𝜂𝑚
1 𝑛
𝑑𝑣 𝑑𝑟 = −(
𝑝 2𝜂𝑚)
1 𝑛 𝑟 − 𝑟𝑝
1
𝑛 ………. (11)
Integrating equation (11) under no slip boundary condition V = 0 at r = R we get
𝑣 = ( 𝑝
2𝜂𝑚) 1
𝑛 𝑛
𝑛+1[𝑅 − 𝑟𝑝)
1
𝑛+1− ( 𝑟 − 𝑟𝑝) 1
𝑛+1 ……….. (12)
This is the formula for velocity of blood flow in veinules. Putting 𝑟 = 𝑟𝑝 to get the velocity 𝑣𝑝 of plug flow -
𝑣𝑝= 𝑛 𝑛+1 (
𝑝 2𝜂𝑚)
1
𝑛 (𝑅 − 𝑟𝑝) 1
ISSN(Online): 2319-8753 ISSN (Print): 2347-6710
I
nternational
J
ournal of
I
nnovative
R
esearch in
S
cience,
E
ngineering and
T
echnology
(A High Impact Factor, Monthly, Peer Reviewed Journal) Visit: www.ijirset.com
Vol. 8, Issue 11, November 2019
V. RESULT& DISCUSSION (BIO-PHYSICAL INTERPRETATION)
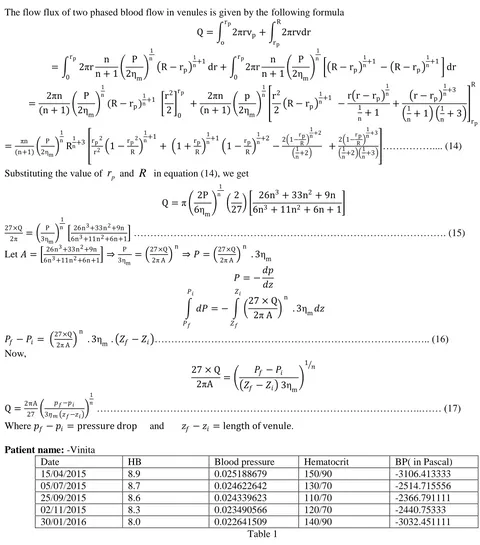
The flow flux of two phased blood flow in venules is given by the following formula
Q = 2πrvp rp
o
+ 2πrvdr
R
rp
= 2πr n
n + 1 P 2ηm
1 n
R − rp
1
n+1 dr + 2πr
rp
0 rp
0
n n + 1
P 2ηm
1 n
R − rp
1
n+1 − R − r
p
1 n+1 dr
= 2πn (n + 1)
P 2ηm
1 n
(R − rp)
1 n+1 r
2
2
0 rp
+ 2πn n + 1
p 2ηm
1
n r2
2 R − rp 1
n+1 −r r − rp 1 n
1
n+ 1
+ r − rp 1 n+3
1 n+ 1
1 n+ 3 r
p R = πn (n+1) P 2ηm 1 n
R1n+3 rp 2
r2 1 −
rp2
R
1 n+1
+ 1 +rp
R
1 n+1
1 −rp
R
1 n+2
−2 1− r p R 1 n +2 1 n+2
+2 1− r p R 1 n +3 1 n+2 1 n+3 ……….... (14)
Substituting the value of
r
p andR
in equation (14), we getQ =π 2P
6ηm
1 n 2
27
26n3+ 33n2+ 9n
6n3+ 11n2+ 6n + 1
27×Q
2π =
P 3ηm
1
n 26n3+33n2+9n
6n3+11n2+6n+1 ………. (15)
Let 𝐴 = 26n3+33n2+9n
6n3+11n2+6n+1 ⇒ P 3ηm =
27×Q 2π A
n
⇒ 𝑃 = 27×Q2π A n . 3ηm
𝑃 = −𝑑𝑝 𝑑𝑧
𝑑𝑃
𝑃𝑖
𝑃𝑓
= − 27 × Q 2π A
n
. 3ηm𝑑𝑧
𝑍𝑖 𝑍𝑓 𝑃𝑓− 𝑃𝑖 = 27×Q 2π A n
. 3ηm . 𝑍𝑓− 𝑍𝑖 ……….. (16)
Now,
27 × Q 2πA =
𝑃𝑓− 𝑃𝑖
𝑍𝑓− 𝑍𝑖 3ηm 1
𝑛
Q =2πA
27
𝑝𝑓−𝑝𝑖 3𝜂𝑚 𝑧𝑓−𝑧𝑖
1 𝑛
………..…… (17)
Where 𝑝𝑓− 𝑝𝑖 = pressure drop and 𝑧𝑓− 𝑧𝑖 = length of venule.
Patient name: -Vinita
Date HB Blood pressure Hematocrit BP( in Pascal)
15/04/2015 8.9 0.025188679 150/90 -3106.413333
05/07/2015 8.7 0.024622642 130/70 -2514.715556
25/09/2015 8.6 0.024339623 110/70 -2366.791111
ISSN(Online): 2319-8753 ISSN (Print): 2347-6710
I
nternational
J
ournal of
I
nnovative
R
esearch in
S
cience,
E
ngineering and
T
echnology
(A High Impact Factor, Monthly, Peer Reviewed Journal) Visit: www.ijirset.com
Vol. 8, Issue 11, November 2019
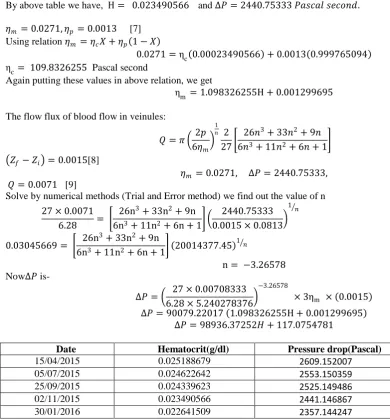
By above table we have, H = 0.023490566 and ∆𝑃 = 2440.75333 𝑃𝑎𝑠𝑐𝑎𝑙 𝑠𝑒𝑐𝑜𝑛𝑑.
𝜂𝑚 = 0.0271, 𝜂𝑝= 0.0013 [7] Using relation 𝜂𝑚 = 𝜂𝑐𝑋 + 𝜂𝑝 1 − 𝑋
0.0271 =ηc 0.00023490566 + 0.0013 0.999765094
ηc= 109.8326255 Pascal second
Again putting these values in above relation, we get
ηm= 1.098326255H + 0.001299695
The flow flux of blood flow in veinules:
𝑄 = 𝜋 2𝑝 6𝜂𝑚
1
𝑛 2
27
26𝑛3+ 33𝑛2+ 9𝑛
6𝑛3+ 11𝑛2+ 6𝑛 + 1
𝑍𝑓− 𝑍𝑖 = 0.0015[8]
𝜂𝑚 = 0.0271, ∆𝑃 = 2440.75333,
𝑄 = 0.0071 [9]
Solve by numerical methods (Trial and Error method) we find out the value of n
27 × 0.0071
6.28 =
26n3+ 33n2+ 9n
6n3+ 11n2+ 6n + 1
2440.75333 0.0015 × 0.0813
1 𝑛
0.03045669 = 26n
3+ 33n2+ 9n
6n3+ 11n2+ 6n + 1 20014377.45 1
𝑛
n = −3.26578
Now∆𝑃 is-
∆𝑃 = 27 × 0.00708333
6.28 × 5.240278376
−3.26578
× 3ηm × 0.0015
∆𝑃 = 90079.22017 1.098326255H + 0.001299695 ∆𝑃 = 98936.37252𝐻 + 117.0754781
Date Hematocrit(g/dl) Pressure drop(Pascal)
15/04/2015 0.025188679 2609.152007
05/07/2015 0.024622642 2553.150359
25/09/2015 0.024339623 2525.149486
02/11/2015 0.023490566 2441.146867
30/01/2016 0.022641509 2357.144247
Table 2
ISSN(Online): 2319-8753 ISSN (Print): 2347-6710
I
nternational
J
ournal of
I
nnovative
R
esearch in
S
cience,
E
ngineering and
T
echnology
(A High Impact Factor, Monthly, Peer Reviewed Journal) Visit: www.ijirset.com
Vol. 8, Issue 11, November 2019
Figure-1
VI. CONCLUSION 1. The two phase model is
m
X
c
1
X
p where100
H
X
and H is Hematocrit which is 3 times ofHemoglobin. Explained the role of Hematocrit in determination of blood pressure drop.
2. The above graph shows that when hematocrit increases then pressure drop increased with slope 98936.
Acknowledgement:
I owe my sincere thanks to Dr Tomar, Physician of district hospital.
REFERENCES
[1] Anatomy and physiology volume 3 textbook equity edition, ISBN- 978-1-304-84331-9, PP 985-987.
[2] Caroline Colijn et al., “Mathematical model of tuberculosis: accomplishment and future challenges’’, PP 1-26, 2006. [3] K. Semabulingam and et al., “Essential of medical physiology”, sixth edition, PP 679, 2012.
[4] Neelam Bajpai and et al , “A Non Newtonian mathematical model on the two phase renal mean blood flow in renal arterioles with special reference to kidney infection”, Volume 4 Issue 5, International Journal of Engineering and Innovative Technology, PP 104-111, 2014. [5] Harishchandra and et al. “A mathematical model on the two phase renal diastolic flow in arterioles with special reference to diabetes”,
International Journal of Scientific and Engineering Research, Volume 4, Issue 1’ PP 01-09, 2013. [6] Ruch T.C. and H.D. , “Physiology and Bio-physics”, Vols (ii) and (iii) W.B.S., 1973.
[7] Neha Trivedi and et al. “Mathematical modeling in two phases pulmonary blood flow through arterioles in lungs with special reference chronic obstructive pulmonary disease(COPD)”, Asian Journal of Science and Technology, Volume 4, Issue 5 PP 27-31, 2013.
[8] M.S.Olufsen and et.al, Cardiovascular and Pulmonary Physiologyand Anatomy”, Applied Mathematical Models in Human Physiology, Biomath-Group Department of mathematics and physics Roskilde University Denmark, PP 27, 2006.
[9] Dheerendra Kumar and et al , “Applied mathematical models on two phase human pulmonary blood flow in Veinules with special reference to Lung cancer”, International Journal of Current Research, Volume 9, Issue 10, PP 58601-58606, 2017.
30/01/2016
02/11/2015
25/09/2015 5/07/2015
15/04/2015 y = 98936x + 117.0
2300 2350 2400 2450 2500 2550 2600 2650
0.0225 0.023 0.0235 0.024 0.0245 0.025 0.0255
Pressure drop