IN THIS
ISSUE
The Wonderful Prairie Sod... ____ _____ ____ . . . .._.._..._..~._~. E. Weaver 165 The Micro-Unit Forage Inventory Mefhod...M. C. Shoop and E. H. Mcllvain 172 Our Native Range - A New Horizon in Soil, Wafer and Plant Conservation
E. William Anderson 179 A Proposed Method of Determining Cattle Numbers in Range Experiments
Elbert H. Reid, Jacob L. Kovner and S. Clark Martin Seed Qualify in Green Needlegrass...Raymond C. Kinch and Loren E. Wiesner
184 187 Herbicide Control of Sagebrush on Seeded Foothill Ranges in Utah
C. Wayne Cook Control of Arizona Chaparral With 2,4,5-T and Silvex...D. T. LiZZie
190 195 Competition and Wafer Requirements of Cheafgrass and Wheatgrasses in the
Greenhouse.... ____ _________________________________ ____ _______ _____ _________________________ ____ . . . . ..A. C. Hull, Jr. Effect of Fertilization on Yield on an Irrigated Mountain Meadow
Ross W. Learner 199
A Subalpine Grassland Seeding Trial... _________ . . . ..Justin G. Smith Book Reviews: Field and Laboratory Guide for Ecology (G. W. Tomanek);
The Public Lands (Martin W. Buzan); Index fo Grass Species (A. A.
Beetle); Concepts of Forest Entomology (T. 0. Thatcher)... ________ _______ ____________ 204 208
Current Literature ______________ ____ _________ ________ ________________________________________.._.._.._._._~.._.___.__._~.__.~_._.~._ News and Notes ._____.__ ______ __... _____ ____ _ ______ ________________ ____ _____ _____ _________ _.____..__ _____________ ____ __________________
With the Sections.... __________________ _ ____ _ _____ _____ _______ _ ____ _______ _____ ________________ ________._______ _ __.__________________ Society Business _______. _ ____ _ ____________________... ____ __..._________..._______ ______ ____.__ _ _______________ _ _____
211 213 215 220 222
Cover Photo - Monarchs of the Plains
By Jim YoakumJournal of
July, 1963
RANGE
MANAGEMENT
The Wonderful Prairie
Sod
J. E. WEAVER
Professor Emeritus of Plant Ecology, Department of Botany, Univemity of Nebraska.
A magnificent
expanse of
grassland occupied the central
part of North America before the
coming of the white man. This
paper is the result of a continu-
ous investigation which began in
1916 of a large portion of this
prairie. The area of most inten-
sive study included
approxi-
mately the western third of Iowa
and the eastern third of Nebras-
ka. The advent
of the great
drought of 1933 to 1940 offered
an exceptional opportunity
to
ascertain the responses of native
plants to extremely adverse con-
ditions. The role played by rhi-
zomes of grasses in endurance of
drought and frequently their re-
covery from it was very impres-
sive. Indeed only then did the
great importance of the part of
the prairie in the upper four
inches of soil-the prairie sod-
become clear. Hence a special
study was made in 1961-62 on
this portion of prairie vegetation.
The rhizomes of most prairie
plants are relatively shallow and
confined to the upper four to five
inches of soil. They have a com-
paratively
long life, perhaps
many years. Plant parts in
prairie sod are protected from
sudden and extreme changes in
temperature. They are scarcely
harmed by frost or severe cold of
winter, driving hail, tornadoes,
or prairie fires. They endure rav-
ages by grasshoppers and greatly
prolonged drought.
To prairie
sod, only the plow is lethal.
The ability to adjust itself to
the environment by various de-
grees of tillering accounts in a
large measure for the successful
occupation of more of the earth’s
surface by grass than by any
other life form. The development
of an extensive system of rhi-
zomes not only enables grasses
to spread widely into open spaces
but also to invade underground
and place new growing points
between or beneath other plants,
which are then often replaced.
Moreover, rhizomes afford an ex-
cellent place for food accumula-
tion and some retain life even
after above-ground
parts have
long since disappeared and root
systems have been greatly weak-
ened or died.
Translocation and storage of
reserves in the underground or-
gans of grasses has been well
summarized as follows; “Certain
carbohydrates
(mainly sugars,
fructosans, dextrins and starch)
have been shown to be the prin-
cipal reserve
substances
in
grasses. These materials are elab-
orated by the leaves in excess
after flowering, and are subse-
quently translocated to the roots
and rhizomes, where they are
stored to be drawn in the follow-
ing spring for the production of
new top growth. Nitrogen and
mineral elements
(though not
165
being reserves in the true sense
of the word but merely nutri-
ents) are likewise translocated
in autumn from the aerial parts
to the underground
system
where they are stored over win-
ter” (Weinmann, 1948).
Few studies have been made
upon the rhizomes or other plant
parts in prairie sod, although
Hitchcock (1899, 1900) gave gen-
eral descriptions and a classifica-
tion of the subterranean organs
of several species of plants from
the vicinity
of Manhattan,
Kansas. A notable exception is
the excellent study by Mueller
(1941). She traced the develop-
ment of the rhizomes of several
prairie grasses and forbs from
seedlings to the adult stage, and
thus through a complete annual
cycle. Rate of vegetative spread
was also ascertained.
In the present study, following
Hayden (1919, 1934), Brenchley
(1920), and Mueller (1941), a rhi-
zome is considered as any some-
what uniformly thickened under-
ground stem, regardless of its po-
sition in the sod. Names of
grasses are according $0 Hitch-
cock and Chase (1950).
166
lowlands and lower hillsides will be described first. Then the bunch grasses and others of up- land drier sites will be examined.
Big bluesfern
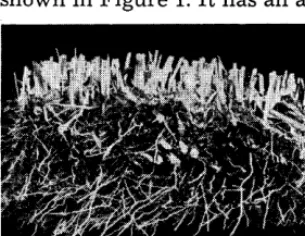
A representative block of the underground parts of big blue- stem (Andropogon gerardi) is shown in Figure 1. It has an area
FIGURE 1. Sod formed by big bluestem in- eludes stem bases, rhizomes and roots.
of about one square foot and over a period of three years de- veloped from a centrally placed planting of ten seedlings. Condi- tions favorable to growth in a prairie environment were main- tained. By tillering and develop- ment of rhizomes a characteristic sod was formed. Stems are nor- mally about a centimeter apart, even in the densest sod they average less than one per square centimeter. The woody stem bases occupy the surface 1.5 inches of soil. They are five to eight millimeters in diameter. Within the block of sod there is a close network of coarse, gnarled, much-branched and in- tricately interwoven rhizomes. Many had extended beyond the area of the block and were cut off (light spots) in removing it from the soil.
Examination of a typical sam- ple of sod from prairie revealed that the rhizomes are usually three to nine millimeters in di- ameter and often less than a foot long. They are normally crooked and well supplied with short branches. For example, one rhi- zome about eight inches long pursued a zigzag course and gave rise to ten short branches. There
WEAVER
were 15 thickened stem bases in the sample, all of which were connected. These compact knotty bases gave rise to numerous coarse roots; many others arose from the rhizomes. This coarse and compacted system occurred mostly between one and three inches in depth.
Figure 2 illustrates the dense clumps of compacted rhizomes and stem bases which scarcely permitted the light to penetrate. Rhizomes appear to have a very long life since dead ones were rare in this and most of the nu- merous samples of various grasses. When they were sepa- rated and measured a total length of 61 feet of rhizomes per square foot of sod was found. When freed from roots and air dried, their weight was 105 grams. A second sample from an- other prairie yielded a total length of rhizomes of 59 feet.
The larger, densely compacted rhizomes from a somewhat wet- ter area in another prairie
formed a dense mat about two inches thick, two to four inches below the soil surface. The inter- twined tough roots were often three mm thick. They occurred at the rate of 650 per square foot
(Weaver 1958). Total length of rhizomes per unit area was 53 feet. A final square foot sample from a flood plain yielded 100 grams of rhizomes from a length of 50 feet.
The average length of rhi- zomes of 55 feet per square foot of bluestem sod, indicates that an acre of this grass might con- tain more than 400 miles of rhi- zomes (Figure 3). The tensile strength of individual rhizomes three to four mm in diameter was found to vary but little. They broke only under a pull of 55 to 64 pounds.
Similar general rhizome pat- terns will be shown to be com- mon among other tall grasses. When one considers this, his con- cept of grasses as vertically placed organisms is considerably
FIGURE 2. Surface view of a square foot washed away and roots removed.
modified. Although the shoots and stems of big bluestem extend upward five to ten feet and may appear to occupy all the ground, actually the plant cover (basal area) just above the soil is only about 15 percent (Weaver and Fitzpatrick 1934).
Indian grass (Sorghastrum nutans) is a tall, coarse plant with ecological requirements and distribution pattern very similar to that of big bluestem. It may form patches of sod or occur in bunches intermixed with big bluestem, but it is far less abun- dant. Its usual percentage in western true prairie is only one to five but in the Flint Hills southward it may compose much more of the plant cover.
This grass is slower in produc- ing tillers and rhizomes than most of its competitors, and does not spread so rapidly. Under se- vere competition tillering is al- most nil, a fact which may ac- count for the occurrence of sin- gle stems or isolated small bunches scattered among other species. It does seed readily and thrives in disturbed places. The stem bases are nearly as coarse as those of big bluestem but the rhizomes are mostly smaller and shorter. The rhizome mat is shal- lowly placed. Most rhizomes curve downward and outward two to three inches from the par- ent stem and then turn upward with very little spreading.
In one square foot of sod there were 58 feet of rhizomes. When air dried they weighed 89 grams. Another sample yielded 48 feet of the short, typically curved rhi- zomes. This rhizome habit seems much less efficient, as regards propagation, than that of big bluestem.
Switchgrass
Switchgrass (Panicum virga- turn) grows in wetter soils than big bluestem. Clumps three to five feet in width often occur but this grass is found only infre- quently in extensive pure stands. The coarse stems are four to seven mm in diameter but most- ly widely spaced. They originate underground at a depth of one to two inches. Switchgrass does not tiller so readily or as abun-
dantly as big bluestem. Owing to lack of basal shoots and wide spacing between unbranched stems, it usually occupies only about five percent of the soil sur- face even in excellent stands.
A dense network of entangled, somewhat woody and much branched rhizomes is developed. These are three to seven mm thick and one to two feet long. They occur usually at depths of two to five inches but are some- times eight inches deep. They en- able the plant, once established, to spread readily. There are often five to eight internodes ~.ey inch of rhizome; branching is frequent and rebranching recurs again and again to form irregu- lar patterns. Often several rhi- zomes develop from a single base. From these and stem bases a multitude of strong, coarse, poorly branched roots arise. They are thickest around the swollen stem bases but are also scattered along the entire length of the rhizomes. Many extend al- most vertically downward about eight feet. Rhizomes occurred at the rate of 43 feet per square foot.
168 , WEAVER
washed away and nearly all of the roots removed. This vast net- work extended to within two inches of the soil surface. Each of two square foot samples con- tained 50 feet of rhizomes. Each sample w e i g h e d approximately 192 grams. Another sample from the same area yielded similar re- sults.
The tensile strength of these rhizomes is very great. This was ascertained by placing individ- ual pieces in a tensiometer. The weakest broke only under a pull of 80 pounds and one resisted a pull up to 132 pounds. The vol- ume of 50 feet of four-mm rhi- zomes was 11.7 cubic inches. Thus, each square foot of the tall-grass sod, whether bluestem or switchgrass, has ample space for food storage. This is reflected in their very rapid growth in spring.
Prairie cordgrass
Prairie cordgrass (Spurt&a pectin&a) occupies soil too wet and too poorly aerated for the development of big bluestem and switchgrass. It is a coarse grass, often six to eight feet tall. The stiff woody stems are sometimes ten mm in diameter but so widely spaced that they rarely occupy more than one to three percent of the soil surface. It for- merly clothed thousands of acres of low, wet prairie land. Beneath mature plants the soil to a depth of six to ten inches contains a mat of coarse, woody, very much branched rhizomes four to eight mm in diameter. When young they are sheathed with hard, pointed scales which are some- what longer than the internodes. They vary greatly in length, some exceeding two feet and many extend outward from their origin two to 18 inches before giving rise to erect shoots. The long sharp-pointed buds are well adapted to penetrate heavy, com- pact soil.
Some rhizomes occur 0.5 to one inch below the soil surface. The
elaborate network occupies mostly the upper four inches of soil, but some rhizomes may occur at depths of eight to ten inches, especially where soil is being deposited. Lateral branches originate at various depths from vertically placed rhizomes. Two to several centers of stem bases may be connected by a single rhizome. The golden yellow underground stems are woody but flexible, of very great tensile strength, and intricately intertwined to form an open framework. Individual rhizomes resisted a pull of 46 to 55 pounds before breaking. The network of rhizomes is further anchored by the coarse, deep wire-like roots which arise at stem bases and all along the underground stems. The rhizomes of a sample from a young stand occurred at the rate of 80 feet per square foot and weighed 124 grams. Those from a long-established stand had a length of 87 feet per unit area and a weight of 208 grams. A third from another wet prairie had 74 feet of rhizomes and a weight of 123 grams. Compared with big bluestem the rhizomes are much coarser and the net- work more open but greater in the vertical dimension.
Other Lowland Grasses
The coarse, woody mass of rhi- zomes and roots of eastern gama grass (Tripsacum dacty Zoides) in the surface four inches of soil had twice the weight of that of prairie cordgrass and three times that of big bluestem taken from the same prairie. Reed canary grass (Phalaris arundinacea), like most species from moist low- lands, renews growth in early spring from a vast system of coarse, deep, tangled rhizomes. Redtop (Agrostis alba) and salt- grass (Distichlis spicata) have extensive systems of rhizomes. But all of these and indeed all combined are of minor impor- tance when compared with the four great dominants described.
Little bluesfern
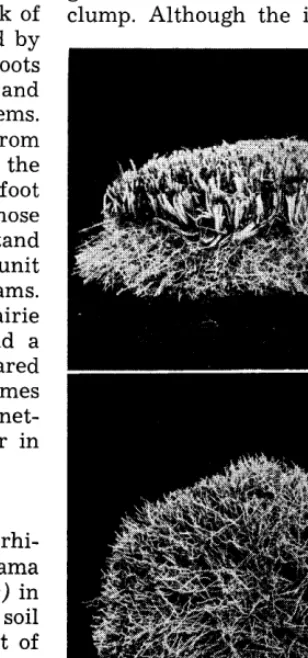
On uplands the dominant spe- cies of grasses occur mostly in the bunch form. Usually rhi- zomes are absent or not well de- veloped. A sample of the com- pact base of a bunch of little bluestem, (Andropogon scopar- ius) occurring entirely in the surface four inches of soil, is shown in Figure 5. It is three vears old and the sod is about Y
eight by ten inches in size. The numerous stem bases, the very short rhizomes, and the hundreds of roots are securely knit to- gether into a somewhat circular clump. Although the individual
FIGURE 5. (Above) Sod formed by little
bluestem includes stem bases and roots.
(Below) Upturned sod showing abun-
dance of fine roots.
spade. It was securely held in place by a deep network of strong roots. Since, according to Pavlychenko (1942), a single root has a tensile strength of about 2.5 pounds, one can only marvel at the wonderful way in which the plant is anchored to the soil.
In good stands 15 to 20 bunches often occur in an area of ten square feet with diameters near the soil surface of four to eight inches. The spread of the foliage, however, is two to three times that of the basal area. In deep soils on the drier hillsides this species alone frequently fur- nishes 90 percent of the vegeta- tion and in drier soils as a whole, including nearly level uplands, 55 to 75 percent. The average basal cover in the little bluestem community rarely exceeds 25 percent and is usually about 15. Little bluestem alone, on an average, occupies ten percent of the soil surface.
It has long been believed that the earlier death in drought of little bluestem compared with big bluestem was due to the deeper root system of the tall grass. This usually exceeds that of the mid grass by one to two feet. Further study indicates, however, that accumulated food supply in the sod, which is much greater in big bluestem, may also have been an important fac- tor in survival.
The roots of bunch grasses ex- tending far outward from the base of the plant are so impor- tant in the formation of sod that they should be well understood. This habit is very similar in needlegrass (Stipa spartea), prairie dropseed (Sporobolus heterolepis) and others to that of little bluestem.
In Figure 6, blocks of sod were taken to include the soil eight inches on all sides from the center of the bunch. The sod was then cut at a depth of exactly four inches. After long soaking in water the soil was washed
shown.
away, thus exposing the roots that extended outward on all sides of the bunches. The bunches varied in diameter from two inches (needlegrass) to 4.5 inches (prairie dropseed). These roots were all in the 1.5 to four inch soil level. In washing, all other plant materials were sepa- rated from the roots and dis- carded. Roots arising from the vertical bases of buried stems spread outward in all directions, many crisscross under the bunch ,and extend outward on the oppo- site side. Most of the roots, how- ever, grow more or less vertical- ly downward, but some from all of these grasses extend outward at least two feet in the upper four inches of soil (Weaver 1958).
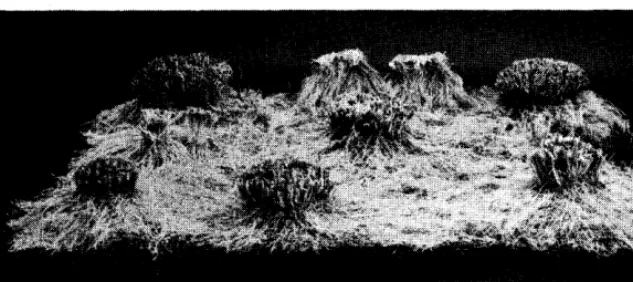
A plot of little bluestem sod of about six square feet (35 x 25 in.) is shown in Figure 7. The larger bunches are little blue- stem except one in the left back- ground which is Indian grass. Two small plants of needlegrass dre shown (central left) and two
of Junegrass (Koeleria cristatu) in the background. Only the stem
bases and roots occurring in the upper four inches of soil are shown. Thus, one to 1.5 inches of stem bases are found just below the soil surface.
inches of soil.
clipped to the soil surface. The soil was then removed by wash- ing; the mats of roots and rhi- zomes were air dried and weighed.
Species in the interbunch sod were numerous but the plants were small. Weight per square foot averaged 28 grams. This indicates that more than one ton per acre of plant material occurs between the bunches of dominant grasses of upland.
The weight of the mass of roots and stem bases, after all soil was removed and the plant materials air dried, has been ob- tained from 16 prairies in west- ern Iowa, eastern Nebraska, and central Kansas. It was 3.15, 2.60 and 2.34 tons per acre respec- tively, the amount decreasing westward somewhat in propor- tion to rainfall (Shively and Weaver, 1939). Thus, the main cause of the great stability of upland prairie soil is found in the solidly anchored bunch grasses and the interlocking of the surface tangle of their wire- like roots between the bunches. This is reinforced by roots and rhizomes of plants growing be- tween the bunches. Perusal of the preceding facts leads one to agree with Clements (1938) that “during the historical period, dust storms have come only from soils exposed by man in the course of settlement.”
Other Grasses and Grass-like Plants Many grasses and sedges of uplands are provided with rhi-
zomes. Scribner panicum (PcH& cum scribnerianum) a small per- ennial, occurs almost every- where in prairie and propagates by means of short rhizomes. Sideoats grama (Bouteloua cur- tipendula) produces scaly rhi- zomes two to five inches long. Kentucky bluegrass (Poa pra- tensis) is a constant but small component (about five percent) of prairie. Rhizomes are 0.5 to two mm. in diameter and some are five to 12 inches long. A single square foot of sod may contain 60 or more feet of rhi- zomes. Moreover, big bluestem commonly forms five to 20 per- cent of upland vegetation.
Certain sedges range widely throughout upland prairie. Their rhizomes contribute consider- ably to soil stability. Penn sedge (Carex pennsylvanica) is the most widely spread and very locally may form half of the plant cover. Meads sedge
(C. meadii) produces yellowish- brown, shallow rhizomes about five mm thick. They are long but not much branched and usually connect several plants. A single square foot of sod con- tained 102 feet of rhizomes.
A most remarkable invasion by rhizomes was exhibited by western wheatgrass (Agropyron smithii) during the great drought of the thirties. It oc- curred only sparsely in true prairie but great losses sustained by the bluestems and other grasses and the bare areas thus produced made possible its en- ormous spread. It often became the most abundant grass to within 40 miles of the Missouri River. In addition to being a good seed-producer, large, more or less circular areas where other grasses were nearly dead indicated the excellent and rapid method of migrating by long, much-branched rhizomes (Fig- ure 8). The vitality of the rhi- zomes and their resistance to drought are remarkably great. The boundaries of spreading patches of wheatgrass were marked in many places and a yearly advance by rhizomes of nine to fourteen feet was as- certained.
The long slender rhizomes are one to three mm in diameter, glistening white when young but straw-colored when mature. They vary in length from a few inches to five or more feet. A
single plant may develop several rhizomes of great tensile strength. They are much branched into a coarse, tangled network, which with the stem bases and abundant tough roots form a sod between depths of 1.5 and five inches. But in drift- ing, wind-blown soil they may be 12 inches deep, yet some shoots from them may reach the surface soil. The mass of rhi- zomes and roots in the sod of old stands is only about an inch thick. Total length of rhizomes per square foot in such stands was 84 feet. Wheatgrass is not a good competitor under normal true-prairie environment and is now about as rare as before the great drought.
Summary
Big bluestem produces great numbers of branched rhizomes, three to nine mm in diameter, compacted into dense mats about two inches thick at depths be- tween one and three inches. Their length per square foot of sod averaged 55 feet. Tensile strength was 55 to 64 pounds for individual rhizomes. Indian grass is similar to the preceding grass in total length of rhizomes and their position in the sod, but it is less efficient in spreading.
Switchgrass has rhizomes three to seven mm thick and one to two feet long. It differs from big bluestem by forming an open framework two to five inches, but sometimes eight inches deep. A square foot of soil contains about 50 feet of much branched and interwoven rhizomes. A single rhizome exhibited a ten- sile strength of 80 to 132 pounds.
Beneath mature plants of prairie cordgrass the soil to a depth of six to ten inches con- tains a mat of coarse, woody, much branched rhizomes four to eight mm thick. Lateral branches originate at various depths from vertically placed rhizomes. Some exceed two feet in length and lateral spreading
is rapid. Compared with big bluestem the rhizomes are much coarser and the network much more open, but greater in the vertical dimension. Total length of rhizomes averaged 80 feet per square foot. On moist lowland rhizomes are common on many grasses, sedges and rushes.
Of the rhizome networks of the four chief lowland grasses, that of big bluestem is the shal- lowest. That of Indian grass is very similar in the vertical di- mension. Switchgrass forms an open network with a depth of three to eight inches. Prairie cordgrass has a framework of variable thickness, ranging from two to eight inches.
Rhizomes furnish abundant room for storage near the food factories above and they are close to the water and nutrient supplies around and beneath them. Fifty feet of rhizomes with an average diameter of four mm have a volume of 11.7 cubic inches. Above these food-storage reservoirs the tall coarse grasses rapidly develop shoots, followed by an enormous expanse of leaves.
Dominants of uplands are mostly, but not all, bunch grasses. The most abundant of these is little bluestem. Its com- pact bases are closely com- pressed in the surface 1.5 to two inches of soil. Roots arise from the bases of buried stems and spread outward in all directions, thus binding the stems together and firmly anchoring the bunch. Roots spread laterally in great numbers to at least two feet in the surface four inches of soil. Numerous other plants, espe- cially other grasses, grow be- tween the large bunches and also occupy a part of the upper soil. Their roots and rhizomes furnish a considerable part of the 2.6 to 3.15 tons of plant materials per acre in the upper four inches of soil-the bluestem sod. This is essentially true of bunches of prairie dropseed and needle-
grass, which also maintain up- land communities.
LITERATURE CITED BRENCHLEY, W. E. 1920. Weeds of
farm land. Longmans, Green and Co. London.
CLEMENTS, F. E. 1938. Climatic cycles and human populations in the Great Plains. Scientific Monthly 47: 193-211.
HAYDEN, A. 1919. The ecological sub- terranean anatomy of some plants of a province in central Iowa. Amer. Jour. Bot. 6: 87-105.
. 1934. Distribution and reproduction of Canada thistle in Iowa. Amer. Jour. Bot. 21: 355- 373.
HITCHCOCK, A. S. 1899. Studies on subterranean organs. I. Compositae of the vicinity of Manhattan, Kan- sas. Trans. Acad. of Sci., St. Louis 9: 1-8.
. 1900. Studies on sub- terranean organs II. Some dicoty- ledonous herbaceous plants of Manhattan, Kansas Trans. Acad. Sci., St. Louis 10: 131-142.
MUELLER, I. M. 1941. An experi- mental study of rhizomes of cer- tain prairie plants. Ecol. Monog. 11: 165-188.
PAVLYCHENKO, T. K. 1942. Root sys- tems of certain forage crops in re- lation to the management of agri- cultural soils. National Res. Coun- cil, Canada, No. 1088. Ottawa.
SHIVELY, S. B. AND J. E. WEAVER. 1939.
Amount of underground plant ma- terials in different grassland cli- mates. Univ. Nebr. Conserv. and Surv. Div. Bull. 21.
WEAVER, J. E. 1958. Summary and interpretation of underground de- velopment in natural grassland communities. Ecol. Monog. 28: 55- 78.
WEAVER, J. E. AND T. J. FITZPATRICK. 1934. The prairie. Ecol. Monog. 4: 109-295.
WEINMAN, H. 1948. Investigations on the underground reserves of South African grasses. So. African Sci. 2: 12-15.
Longmont Seed Co.
Field Seeds and Complete Seed Service Buy-Clean-Treat-Sell
The Micro-unit Forage Inventory
Method1
M. C. SHOOP AND E. H. McILVAIN
Research Range Conservationist and Research Agrono- mist, Crops Research Division, Agricultural Research
Service, U. S. Department of Agriculture, U. S. Southern Great Plains Field Station, Woodward, Oklahoma Of all the measurements used
in range research and range ad- ministration, none has been SO difficult and expensive to ob- tain and none so sorely needed for correct decision-making as weight of forage per acre. This paper describes a refined weight- estimate method used to deter- mine forage production and dis- appearance in pounds per acre on the Southern Plains Experi- mental Range near Woodward, Okla. The method was developed, tested, and modified from 1948 to 1952. Since then, it has been the primary tool for evaluating forage response in all phases of range research at Woodward.
In itself, the micro-unit forage inventory method offers only a few new techniques and prin- ciples. Primarily the method re- combines and modifies sampling techniques proposed and used by others, especially those of Pechanec and Pickford (1937). The recombination created a simple, rapid, precise, low-cost method to determine the elusive “pounds of each species per acre.”
Description of Method
The micro-unit method uses the objective principle of count- ing, or taking inventory of, esti- mated micro-units of range for- age by species within micro-plots. Definitions used in this article are: (1) micro-unit, an arbitrary small quantity of forage, usually 10 grams (field weight), (2) micro-plot, a small quadrat 1.917
-
1 Cooperative investigation of the Crops Research Division, Agricul- tural Research Service, U. S. De- partment of Agriculture, and the Oklahoma Agricultural Experiment Station, Stillwater, Oklahoma.
square feet in area, and (3) for- age, current-year growth of grass and forbs above juncture of stem and root. In brief, an examiner delimits a micro-plot and counts the number of whole and frac- tional micro-units of each spe- cies.
Essence of the method is that the micro-unit to be estimated is physically present within an arm’s length, it can be seen and touched, and its weight can be checked by clipping and weigh- ing to the nearest gram within about 30 seconds. The time re- quired by a single examiner to delimit, estimate, and record one plot is usually 30 to 60 seconds. The only ability that must be developed is that of estimating a small weight unit of each spe- cies, and great accuracy can be developed rapidly by most will- ing technicians.
The remainder of this descrip- tion is concerned with the simple but exacting details that will permit technicians to use the method without redeveloping re- liable detailed procedures.
The Micro-unit and Estimate The micro-unit is estimated by a visual appraisal combined with the sense of touch. Factors to be taken into account when esti- mating a micro-unit include: (1) length, width, and thickness of leaves and stems; (2) inherent specific gravity of different spe- cies and phenotypes; (3) ratio of leaves to stems; (4) moisture content as reflected by turgidity, shape, and color; (5) presence of growth from previous years; and (6) degree and type of grazing by insects, rodents, wildlife, and livestock.
172
In short, a man learns to esti- mate, among other character- istics, the compressed basal di- ameter, compressed crown diameter, and compressed leaf length measurements shown to be highly correlated with weight by Hickey (1961). But man’s eye, hand, and mind can determine and take into account numerous factors which relate to weight that cannot be readily measured. Furthermore, the examiner con- cerns himself only with the mi- cro-unit, not the entire plant. Stated another way, an experi- enced estimator carries in his mind and constantly uses numer- ous “regression formulas” of the effect of many plant character- istics on weight.
The learning process includes estimating, clipping, weighing, modifying the estimate, and re- weighing until the estimator be: comes experienced and expert with weights of range forage. On the sagebrush range type at Woodward, a man who knows the vegetation, but who has no previous weight-estimating ex- perience, can usually become proficient with two days of in- tensive practice. A man with previous experience can usually regain his micro-unit concepts in half a day.
Micro-unit estimates are of ac- tual field weights which are con- verted later to air-dry or oven- dry values. During the training period, representative clippings of each major species are placed in moisture-tight plastic bags for determination of percent dry matter. If the survey lasts sev- eral weeks, moisture samples must be taken whenever a sig- nificant change occurs in plant moisture, usually at one- or two- week intervals.
Ssmbol Item Grams/Dlot
0
Micro-unit (10 grams), orfraction of unit ---
111 II*
~,,I,\' - Blue grama
*r--\
\.,./
Little bluestem: c--
\ 21-d
IJ
Side-oats gramaTotal
FIGURE 1. Method of counting tihole
ber of micro-units (Figures 1
40
16
3 ---
59
and fractional micro-units within a micro-plot.
and 2). Micro-plot totals can be checked by clipping. Training efficiency can be gained by hav- ing the men estimate each other’s quadrats. If additional practice is needed, the examiners can work in pairs for the first few hours of the actual survey.
Size, shape, and delineation of plot are important factors which contribute to final accuracy of any survey method (Christidis, 1931; Pechanec and Stewart, 1940; Green et al., 1952; Brown, 1954). However, Jolly (in Brown,, 1954) stated, “Fortunately, size of unit is often much less critical than the experimenter imagines, and quite a large alteration in size of unit will sometimes pro- duce only a small effect on the final accuracy of his results (as- suming the total amount of sam- pled material to remain con- stant) .” Jolly also stated that for a given sampling method, more accurate results are usually ob- tained from a large number of small plots than from a small number of large ones.
After much field study at Woodward, it became apparent that small plots which could be delineated rapidly, and with all portions close to the observer’s eye and hand, were absolutely essential for accuracy and speed. A dominant consideration affect- ing this decision was the mental fatigue associated with pro-
longed periods of estimating and counting micro-units in larger plots.
A rectangle with length about twice the width was selected as the best compromise on shape because (1) it could be delimited quickly and accurately, (2) it retained some advantage of a circle which has the least border- effect bias of all shapes, and (3) it had some linearity which in- creased sampling efficiency. In addition, the plot size was calcu- lated so that a constant of 50 could be multiplied by grams per plot to give pounds per acre.
Final measurements of the quadrat were 11.5 by 24.0 inches. The quadrat was constructed of 1/d-inch milled steel rod, and all measurements were made from rod centers (Figure 3). Quadrats larger than those used at Wood- ward may be desirable where vegetation is sparse and smaller quadrats may be more efficient where vegetation is dense.
One end of the quadrat was left open and the resultant points were sharpened so they could be pushed through the basal por- tions of plants at ground line. Time and effort are required to work the perimeter of a closed quadrat down to ground line, and errors frequently occur. The
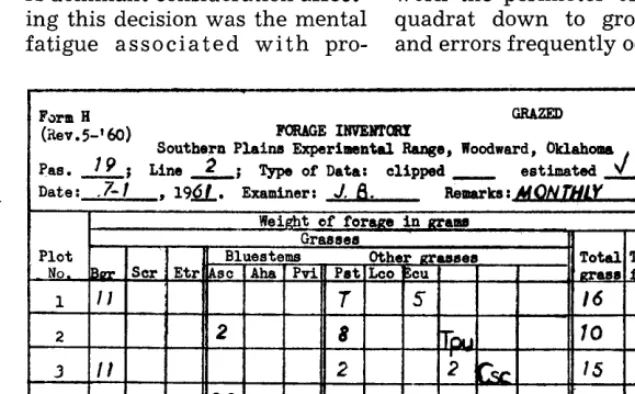
Fmn H
(iiev.5-‘60) FORAGEINVEliTORY
Southern Plains Experiassntal Range, Woodward, Oklahoma
Pas. 19 ; Line 2 ; Type of Data: clipped eetimated 4 Date: -7-1 , 194t. Examiner: J. 8. harks:~ChV~~-
2
3 It 2 21Gjg: 15 T
4 38 T T 39
25 14 4 21
Total
1
FIGURE 2. Field data sheet for “grazed” areas showing species symbols and extent of field
174 SHOOP AND McILVAIN
open end of the quadrat is “closed” with a pencil, or short rod, which is again pushed through the basal portion of the plants. Frequently, no plants are located across the open end and no marker is needed.
Maintenance of Reliability Concept of micro-units is maintained during the survey by clipping about every tenth plot or by clipping micro-units from that plot. If vegetation on the plot to be clipped is sparse (three to five grams) the ex- aminer clips the next plot hav- ing more forage. If a quadrat falls on an area of extremely dense forage (80 to 200 grams) it is usually more accurate to clip the plot than to estimate it. The reason for this is explained later under the subheading “Nature of Variation Associated with Es- timates.”
Several reasons exist for the estimator to continually check his micro-unit concept by clip- ping rather than to use a double- sampling technique (Wilm et al., 1944). These include: (1) the time factor as shown under the sub- heading “ Tim e Comparisons”; (2) the need of having another examiner clip and weigh the
plot, or the need of the examiner carrying unweighed sacks of clipped forage with him (to pre- vent introducing subconscious bias from the learning process); and (3) the necessity under sev- eral varied conditions of clipping sufficient plots to calculate valid correction constants. Then too, if a break of time were to occur during the inventory, the prob- lem of obtaining sufficient clipped samples to calculate cor- rection constants would be in- tensif ied.
Measuring Production and Disappearance
Forage production in pounds per acre can be measured on un- grazed areas with the micro- unit forage inventory method at any selected time by using an appropriate area-sampling sys- tem. Micro-plots can be com- pletely randomized, randomized in clusters, or mechanized along randomized stratum lines. All human bias must be eliminated when delimiting each micro-plot.
In a grazed pasture, weight of forage is measured under cages to determine production. This is usually done at end of sum- mer. An equal number of micro- plots is then measured in the
grazed portion of the pasture, and the difference between “grazed” and “ungrazed” yields is summerlong disappearance.
Winter-for age disappearance due to livestock grazing is ob- tained by caging the summer “grazed” micro-plots during the winter and re-inventorying them in the spring for comparison with an inventory of micro-plots grazed during winter. Total winter disappearance, grazing plus attrition, is obtained by comparing yield of micro-plots grazed during winter with end- of-summer “ungrazed” yields.
Monthly production and dis- appearance data are obtained by taking “grazed” and “ungrazed” measurements at monthly inter- vals. After the “ungrazed” micro-plot is inventoried, on May 31 for example, a “May- grazed” micro-plot is located, in- ventoried, and then caged with the cage from the “May-un- grazed” micro-plot. The “May- grazed” micro-plot becomes the “June-ungrazed” micro-plot when it is inventoried on June 30. Monthly production on the plot is obtained by subtrac- tion of the first-of-the-month measurement from the end-of- the-month measurement.
Precision and time are gained by leaving the micro-plot quad- rat in place under the cage from one reading to the next. Hall (1959) showed that sampling error of growth measurements in forests was reduced 25 per- cent by remeasuring plots as compared with subtracting re- sults of successive inventories on different plots.
Equipment
FIGURE 4. Typical sand sagebrush range. Examiner is recording grams of a species within a micro-plot.
was purchased from the Ox- wall Tool Co., Ltd., 133-10 32nd Avenue, Flushing 54, N. Y., at a cost of about $7.20.2 Inventory equipment needed includes: quadrat, shears, scale, field forms, clipboard, kraft sacks and rubber bands for weighing for- age, pencils, plastic sacks, cages, and anchoring pins.
Testing the Method The micro-unit method was compared with clipping in three trials conducted on the Southern Plains Experimental Range. The experimental range is located on rolling, stabilized, sand dunes, and the predominant soil type is Pratt loamy fine sand. Annual precipitation averages 23 inches, but varies from ten to 43 inches. Native vegetation of the area is dominated by an overstory of sand sagebrush (Artemisia fili- folia Torr.) , with an average
canopy cover of 38 percent. The understory of grasses and forbs
aMention of specific instrument and manufacturer is for identification and does not imply any endorse- ment by the U. S. Department of Agriculture.
produces an annual average of 1,050 pounds of oven-dry forage per acre. Average forage produc- tion consists of 20 percent sand dropseed (Sporobolus cryptan- drus (Torr.) A. Gray) ; ten per- cent sand lovegrass (Eragrostis trichodes (Nutt.) Wood) ; six percent blue grama (Bouteloua grucilis (H.B.K.) Lag. ex Steud.) ; 16 percent little blue- stem (Andropogon scopurius Michx.) , sand bluestem (A. hullii Hack.), and switchgrass (Pun- icum virgutum L.) ; 31 percent other grasses; and 17 percent forbs (Figure 4).
General procedure in the trials was to inventory a series of micro-plots by the micro-unit method. Afterwards, the plots were clipped. The quadrat frames were pinned in place to prevent movement. Examiners were range technicians well ac- quainted with the vegetation and the micro-unit method. Order of examining the plots was ar- ranged so that each man made an equal number of first, second, and third inspections of each plot to equalize “examiner disturb- ance.”
Trial 1 was conducted in early winter on a one-acre area which was predominately blue grama. Three examiners estimated the forage weight of individual species in 75 micro-plots, and then the vegetation was clipped and weighed in two categories, blue grama and “all other species.” Each examiner esti- mated and clipped a non-test plot located at every tenth micro-plot to maintain his micro- unit concepts. A time record was kept of all operations.
Trial 2 was conducted in late summer on micro-plots located along a stratum line in a native pasture. Vegetation varied greatly since the stratum line crossed numerous vegetative sites. Two examiners estimated the forage on 25 plots on two successive days to measure the repeatability of the method. Both the estimates and clips were by individual species. Ex- aminers maintained reliability of micro-units by checking esti- mates outside the plots.
A third trial was conducted and the data were included in the averages of all trials. For the sake of conciseness, specific results from trial 3 were not re- ported because they were similar to those of trials 1 and 2. Addi- tional data were obtained by calculation of statistics from pas- ture inventories made by the micro-unit method.
176
t2s2tL2, where t is at five per-
cent level for infinite degrees of
freedom, s is standard deviation,
and L is allowable error (here,
ten percent of the mean).
Results
Estimated Versus Clipped Weights
Forage weights estimated by
the micro-unit method closely
approached the average weights
obtained by clipping. Estimated
average weights
varied with
each examiner from two to 13
percent less than the clip in
trial 1 and from nine percent
more to nine percent less than
the clip in trial 2 (Table 1). In
ten comparisons,
estimated
weights averaged eight percent
less than clipped weights. Two
reasons for these conservative-
type estimates are breakage of
mature foliage associated with
repeated “examiner disturbance”
and the tendency of examiners
to underestimate highiproducing
plots, as discussed in more de-
tail under the subheading “Na-
ture of Variation Associated with
Estimates.”
Estimated weights on individ-
ual micro-plots were highly cor-
related with clipped
weights.
Correlation coefficient of esti-
mated weights with clipped
weights averaged 0.87 in the ten
comparisons and ranged from
0.74 to 0.96.
SHOOP AND McILVAIN
Differences Between Examiners and Days
Differences between estimates
of the same plot by individual
examiners were relatively small.
Eight comparisons of estimates
showed an average difference
between men of only seven per-
cent with a range of one to 15
percent. Average correlation be-
tween estimates of examiners
was 0.86, and the range was from
0.81 to 0.92.
Repeat estimates of plots by
examiners on successive days
showed technicians were highly
consistent in their ability to es-
timate forage weights. Second-
day estimates were about 100
pounds per acre, or two grams
per plot, lower than first day es-
timates (Table 1). Repeat esti-
mates were expected
to be
slightly lower than first-day es-
timates since handling mature
vegetation to estimate its weight
by the sense of touch as well as
sight causes slight breakage and
loss. However, first- and second-
day estimates were highly cor-
related, 0.91, in three compari-
sons.
Time Comparisons
The micro-unit method was
approximately four times as fast
as the clip method in trial 1.
Average time required to esti-
mate the forage in a micro-plot
was 34 seconds when travel time
between plots spaced 15 feet
apart was included. An average
of 59 seconds per micro-plot was
required when one plot in ten
was checked by clipping.
Four minutes and ten seconds
was required to clip and weigh
the forage in a micro-plot and to
travel to the next plot. Clipping
and weighing each individual
species would have increased the
time requirement.
In grazed pastures, about two
minutes were required to esti-
mate a micro-plot. Much of this
time was used to move cages and
to travel between plots. Inven-
tory time was also influenced by
number of species, degree of spe-
cies intermixture,
quantity of
forage present, and number of
micro-plots read per cage.
Number of Plots Required
Number of plots required to
sample within ten percent of the
mean was calculated from actual
forage inventory data of two dif-
ferent pastures at Woodward,
one relatively uniform and one
highly variable. In a high-rain-
fall year, 1961, a valid estimate
of yield on a 25-acre seeded blue
grama pasture required 28 mi-
cro-plots. In the same year on
25 acres of sand sage rangeland,
a valid estimate required 193
plots. In a year of low forage
production, 1956, 36 and 73 plots
were required to sample the blue
Table 1. Comparison of clipped and estimated (micro-unit method) forage weights and their sampling statistics Trial 1, 75 micro-plots Trial 2,25 micro-plots
A
Micro-unit method Micro-unit method
Clip Man Man Man Clip Man A Man B
Item method A B C method 1st day 2ndday 1st day 2ndday
Forage weight, lb./acre1 1768= 1650b 1534c 1740= 1386ab 1386= 1246b 1492= 1382=
Standard error, lb./acre 62 56 50 52 123 120 102 130 108
Sampling error of mean, % 3.5 3.4 3.3 3.0 9.0 8.7 8.2 8.7 7.8
Coeff. of variation, % 31 29 28 26 45 43 41 44 39
Plots needed (n) 36 33 30 26 77 72 65 73 58
Difference from clip, % --._ -7 -13 -2 .___ 1 -9 9 1
Correlation coeff.2 ___. .86 .74 .81 ____ .87 -88 .96 .87
1 Field weight. Comparable means with different letters are significantly different at the five percent level by the Duncan multiple range test.
Table 2. Number of cages (n) required for a valid estimate of fofal perennial grass yield in relation fo number of contiguous micro-plots under a cage, fo uniformity of vegetation, to level of production. and fo size of pasture1
Pasture kind and Average Cages required when number of size and level yield contiguous micro-plots per cage is2
of production pounds/acre 1 2 3 4
Blue grama, wtiform vegetation: Low production, 1956:
12 acres 477 29 .__. . . . . . . . .
25 acres 565 36 .._. . . . . .._.
High production, 1961:
1 acre 1600 14 11 8 . . . .
12 acres 1494 27 18 10 . . . .
25 acres 1440 28 20 17 . . . .
Native sand-sage, variable vegetation: Low production, 1956:
25 acres 744 73 59 40 34
50 acres 740 80 67 50 38
160 acres 762 87 56 37 38
High production, 1961:
1 acre 2802 176 . . . . . . . . . . . .
25 acres 2948 193 . . . . . . . . . . . . 50 acres 2658 247 . . . . . . . . . . . .
160 acres 2844 233 140 123 95
IValid in this instance implies a 95 percent probability of being within 10 percent of the population mean. Yields are field weights measured in fall. 2Adjacent plots 1.917 square feet in size were combined to alter size of sample plot. Estimation of individual plots larger than 1.917 square feet is extremely tiring and soon becomes inaccurate.
grama pasture and the native range, respectively (Table 2).
Number of plots required for a valid estimate of yield was not directly proportioned to size of pasture or area. For instance, a valid estimate of yield in 1961 on a one-acre area of the seeded blue grama pasture required 14 plots; a la-acre area of the same pasture required 27 plots; and the entire 2%acre pasture re- quired 28 plots (Table 2) . Kling- man et al. (1943) also found that nearly as many plots were re- quired on small as on large areas. Number of plots required to sample production of an indi- vidual native range species with- in ten percent of its mean was many times that required to sample total forage. In a native pasture in which 240 quadrats were sufficient to sample total forage within ten percent of the mean, the number required to sample sand dropseed was 769, sand lovegrass 2,104, and blue
grama 7,606. Other investigators also found that large numbers of plots were required to secure low sampling errors for individ- ual species (Harris, 1951; Pech- anec and Stewart, 1941).
Cage requirements per pasture were materially reduced when more than one micro-plot was read per cage. Cage numbers were reduced about 30 percent by reading two plots per cage, about 50 percent by reading three, but only 57 percent by reading four (Table 2) .
Nature of Variation Associated with Estimates
In ten comparisons, estimated yields were eight percent smaller than clipped yields. Also, esti- mated yields varied less than clipped yields. There are at least three reasons for these discrep- ancies.
One reason is examiners tend to cluster yield estimates about the mean (Pechanec and Pick- ford, 1937). In the ten compari-
sons, coefficients of variation were 46 percent for clipped yields and only 41 percent for estimated yields. Clustering lowers the mean because a given percentage error multiplied by low yields influences the mean less than the same percentage error multiplied by high yields.
A second reason is that ex- aminers overestimated low-yield- ing plots by only about eight percent, and they underestimated high-yielding plots by about 16 percent. This discrepancy in ac- curacy of estimates is also shown by a correlation coefficient of 0.70 for estimated and clipped yields of high yielding plots and 0.82 for low-yielding plots (Table 3).
A third and minor source of error in estimating was the ten- dency of examiners to overlook small plants. This tendency be- came greater as size of plot in- creased.
Discussion
The prime consideration of an inventory method is its accuracy, and the micro-unit method proved acceptably accurate when compared with clipping in the tests at Woodward. Some other important advantages of the mi- cro-unit method are: estimates are based on a specific observa- tion of each plant, not on a gen- eralized view or concept of the mass; estimates can be rapidly verified by clipping; vegetation can be left in place for re-estima- tion later; growth from previous years can be eliminated; small plots permit economical caging; small plots which can be studied from one position increase speed and accuracy; and the small plots can be delimited rapidly and ac- curately with the open-end quad- rat frames.
178 SHOOP AND McILVAIN
tion is usually underestimated slightly; rank , high-producing vegetation cannot be estimated as accurately as sparse vegeta- tion; and highly variable vege- tation requires relatively large numbers of small sampling plots because larger plots cannot be estimated accurately. A minor disadvantage is that individual examiners vary slightly in their ability to estimate. To overcome this, all members of a crew should inventory a proportionate share of each pasture or experi- mental treatment.
a panacea, and it should be tested under local conditions before be- ing used extensively. There is still great need for a forage measurement technique that is completely objective and can be used by inexperienced exam- iners. Until such a method is de- veloped, the micro-unit method should have a place on many western ranges.
Summary
The reader should be fore- warned about the difference in precision of measuring forage production and forage disappear- ance. Forage disappearance when calculated as the differ- ence between grazed and un- grazed plots, is never measured as accurately as forage produc- tion, because variance of a dif- ference is greater than the vari- ance of either parent mean
(Boyd, 1949). This is true whether yields are obtained with the micro-unit method or by clipping. The use of paired plots (Klingman et al., 1943) over- comes much of the disadvantage of the difference method for cal- culating disappearance. One mi- cro-plot is chosen by a mechani- cal or random method and then matched with a similar plot. One of the pair is selected at random as the ungrazed plot and the other becomes the grazed plot.
The micro-unit forage inven- tory method was developed as a simple, rapid, low-cost technique to measure forage production and disappearance on rangeland at Woodward, Oklahoma. For- age yields are measured by using the objective principle of count- ing estimated micro-units of each species within micro-plots. A mi- cro-unit is an arbitrary small quantity of forage, usually ten grams, and a micro-plot is a small quadrat 1.917 sq. ft. in area.
The micro-unit method is not
The micro-unit is estimated by a visual appraisal combined with the sense of touch. Factors taken into account include: size of leaf and stem, leaf-stem ratio, mois- ture content, previous-year’s growth, utilization, and pheno- typic variations. Range tech- nicians can rapidly develop the necessary estimating ability. The estimated micro-unit can be checked quickly, usually within 30 seconds, by clipping and weighing. The scale used is about the size of a fountain-pen.
Table 3. Difference between and correlafion of clipped and esfimafed (micro-unit method) forage yields in relation fo quantify of forage per micro-plofl
Clipped yields Difference of Correlation Weight class Weight/acre estimate from clip coefficient
(Pounds) (Percent)
Lowest 20 percent 825 8 .82
and-low 20 percent 1190 2 ___.
Middle 20 percent 1515 -7 .81
and-high 20 percent 1935 -10 ____
Highest 20 percent 2545 -16 .70
All plots 1602 -8 .87
IYields from 155 micro-plots were grouped by weight class. Data are field weights measured in the fall.
The rectangular quadrat frame selected to delimit a micro-plot in the sand sagevegetation meas- ured 11.5 by 24.0 inches. One end was left open to facilitate rapid and accurate placement. The dominant factor in selecting this small micro-plot was mental fa- tigue caused by estimating and counting micro-units in larger plots.
Forage production and disap- pearance can be obtained with the micro-unit method on a monthly, seasonal, or yearly basis. This is done by using a standard area-sampling tech- nique and caged and uncaged plots. Cage numbers per pasture can be materially reduced by reading more than one micro- plot per cage.
The micro-unit method was compared with clipping in three trials. Forage weights estimated by the micro-unit method aver- aged eight percent less than clipped weights, and varied from 13 percent less to nine percent more. Estimated and clipped weights were highly correlated, 0.87. Differences between yield estimates of the same plot by in- dividual examiners were slight, only about seven percent. First- and second-day estimates of mi- cro-plots by the same examiners were highly correlated, 0.91.
Micro-plot yields were esti- mated in 34 seconds, whereas four minutes and ten seconds was required to clip each micro- plot. In grazed pastures, about two minutes was required to es- timate a micro-plot, move the cage, and travel to the next plot.
Number of micro-plots re- quired for a valid estimate of yield varied directly with uni- formity of vegetation and only indirectly with area. A 12-acre area of seeded blue grama was adequately sampled with 27 plots and a 25-acre area with 28 plots. On 25-acre pastures of highly variable native range, from 73 to 193 plots were required.