Clinical Epidemiology
Dove
press
R E v i E w
open access to scientific and medical research
Open Access Full Text Article
Global prevalence and incidence
of traumatic spinal cord injury
Anoushka Singh* Lindsay Tetreault* Suhkvinder Kalsi-Ryan Aria Nouri
Michael G Fehlings
Toronto western Research institute, Toronto western Hospital, Toronto, Ontario, Canada
*These authors contributed equally to this paper
Correspondence: Michael G Fehlings Division of Neurosurgery, Toronto western Hospital, 399 Bathurst St Suite 4ww-449, Toronto Ontario M5T2S8, Canada Tel +416 603 5072 Fax 416 603 5298
Email michael.fehlings@uhn.ca
Background: Spinal cord injury (SCI) is a traumatic event that impacts a patient’s physical, psychological, and social well-being and places substantial financial burden on health care systems. To determine the true impact of SCI, this systematic review aims to summarize literature reporting on either the incidence or prevalence of SCI.
Methods: A systematic search was conducted using PubMed, MEDLINE, MEDLINE in process, EMBASE, Cochrane Controlled Trial Register, and Cochrane Database of Systematic Reviews to identify relevant literature published through June 2013. We sought studies that provided regional, provincial/state, or national data on the incidence of SCI or reported estimates of disease prevalence. The level of evidence of each study was rated using a scale that evaluated study design, methodology, sampling bias, and precision of estimates.
Results: The initial search yielded 5,874 articles, 48 of which met the inclusion criteria. Forty-four studies estimated the incidence of SCI and nine reported the prevalence, with five discussing both. Of the incidence studies, 14 provided figures at a regional, ten at a state or provincial level and 21 at a national level. The prevalence of SCI was highest in the United States of America (906 per million) and lowest in the Rhone-Alpes region, France (250 per million) and Helsinki, Finland (280 per million). With respect to states and provinces in North America, the crude annual incidence of SCI was highest in Alaska (83 per million) and Mississippi (77 per million) and lowest in Alabama (29.4 per million), despite a large percentage of violence injuries (21.2%). Annual incidences were above 50 per million in the Hualien County in Taiwan (56.1 per million), the central Portugal region (58 per million), and Olmsted County in Minnesota (54.8 per million) and were lower than 20 per million in Taipei, Taiwan (14.6 per million), the Rhone-Alpes region in France (12.7 per million), Aragon, Spain (12.1 per million), Southeast Turkey (16.9 per million), and Stockholm, Sweden (19.5 per million). The highest national incidence was 49.1 per million in New Zealand, and the lowest incidences were in Fiji (10.0 per million) and Spain (8.0 per million). The majority of studies showed a high male-to-female ratio and an age of peak incidence of younger than 30 years old. Traffic accidents were typically the most common cause of SCI, followed by falls in the elderly population.
Conclusion: This review demonstrates that the incidence, prevalence, and causation of SCI differs between developing and developed countries and suggests that management and preventative strategies need to be tailored to regional trends. The rising aging population in westernized countries also indicates that traumatic SCI secondary to falls may become an increasing public health challenge and that incidence among the elderly may rise with increas-ing life expectancy.
Keywords: SCI, causation, epidemiology
Clinical Epidemiology downloaded from https://www.dovepress.com/ by 118.70.13.36 on 20-Aug-2020
For personal use only.
Number of times this article has been viewed
This article was published in the following Dove Press journal: Clinical Epidemiology
Dovepress Singh et al
Introduction
Spinal cord injury (SCI) is a traumatic event that results in disturbances to normal sensory, motor, or autonomic function and ultimately impacts a patient’s physical, psychological, and social well-being.1–3 The management of SCIs requires
significant health care resources and can place a substan-tial financial burden on patients, their families, and the community.3 These costs are largely due to a need for
high-level acute care in the short term and associated secondary complications that occur in the long term.4 To improve injury
management, it is necessary to quantify the incidence and prevalence of SCI to better understand rates of occurrence and delineate ways of prevention. Furthermore, this knowl-edge enables health care providers to estimate both the cost and psychosocial burden of this disease and the resources required for its management.
The economic impact of SCI on health care providers and on the system has become an increasingly important topic. According to Krueger et al, the estimated lifetime economic burden associated with SCI in Canada ranges from CAD$1.47 million for a person with incomplete paraplegia to $3.03 million for one with complete tetraplegia.4 These
estimates include complications in the early surgical phase, such as wound infections and displaced instrumentation; emergency readmissions; and long-term complications, including pressure ulcers, bladder and bowel dysfunction, neuropathic pain, and respiratory problems. Annually, the estimated economic burden associated with SCI in Canada is $2.67 billion ($1.57 billion in direct costs and $1.10 bil-lion in indirect costs) and includes costs associated with hospitalizations ($0.17 billion, or 6.5% of total costs), health care provider visits ($0.18 billion, or 6.7%), equipment and home modifications ($0.31 billion, or 11.6%) and attendant care ($0.87 billion, or 32.7%).4
Three previous reviews were conducted to compare incidence and prevalence of SCIs in different countries and to outline causation of injuries in various geographies and economies.5–7 In 2011, Cripps et al reported the global
prevalence of SCI to be between 236 and 1,009 per million, a figure similar to that estimated by Blumer and Quine in 1995 (110–1,120 per million).5,7 Although several studies
have attempted to quantify worldwide prevalence and inci-dences, several issues have prevented an accurate estimate. First, there is no standardized method of assessment across regions; second, the estimates for some countries have been extrapolated from numbers obtained in either urban or rural areas and therefore may not be entirely representative; third, a large proportion of global prevalence data is from
developed nations such as Spain and the United States of America, with limited information from developing conti-nents including Africa, South America, and Asia; and finally, given that there is such a high mortality rate at the scene of the accident and during patient retrieval and transport, many studies have underestimated figures.
This study aims to summarize the literature discussing incidence and prevalence of SCI and provide an up-to-date review of its epidemiology. This knowledge is necessary to quantify the rate of occurrence, track the efficacy of preven-tative measures, and provide estimates of the burden of SCI on the patient and the system.
Methods
A systematic search was conducted using PubMed, MEDLINE, MEDLINE in process, EMBASE, Cochrane Controlled Trial Register, and Cochrane Database of Systematic Reviews to identify relevant literature published through June 2013. Only studies on humans and those written in English were considered for this review. The keywords used for the search were SCI, causation, epidemiology, incidence, and prevalence. Case reports, meeting abstracts, and editorials were excluded.
All abstracts and titles were reviewed independently by two of the authors and were sorted based on predefined inclusion criteria. We sought studies that provided regional, provincial/state, or national data on the incidence of SCI or reported estimates of disease prevalence. The bibliogra-phies of included articles were also systematically screened. From the prevalence studies, the following information was extracted: definition of acute SCI, how prevalence was calculated or estimated, and reported figures. From the included incidence articles, the following data were collected: definition of acute SCI, methodology of data collection, reported incidence, male:female ratio, age of peak incidence, causation, and level of injury.
The level of evidence of each study was evaluated using a scale developed for this review using guidelines from the Agency for Healthcare Research and Quality. This scale consisted of ten questions related to study design, sampling methodology, sampling bias, precision, and reliability of esti-mates. Further, two questions discussed whether the studies adequately defined SCI and whether patients who died at the site of injury were included in the incidence figure. The rating scale addresses all methodological components of epidemi-ology studies and was specifically developed to target SCI incidence and prevalence literature. Table 1 displays the rating scale as well as interpretations for each of the ten questions.
Clinical Epidemiology downloaded from https://www.dovepress.com/ by 118.70.13.36 on 20-Aug-2020
Dovepress Traumatic spinal cord injury
Based on rating distributions, a study was classified as high if it scored $8 (two or fewer minor flaws), as medium if it scored between 5 and 7, and low if it scored ,5 points. The Table S1 provides a detailed overview of how each article was rated, and Tables 2 and 3 summarize whether each article was high, medium, or low-level evidence.
The bulk of this literature reported the incidence, prevalence, and primary causes of SCI as well as interest-ing demographic trends in this patient population. We did not exclude studies based on class of evidence, but rather included all relevant articles in an attempt to provide the most detailed review on the incidence and prevalence of SCI around the globe.
Results
The initial search yielded 5,874 citations. Forty-three stud-ies met all inclusion criteria and discussed either the inci-dence or prevalence of SCI at a regional, state/provincial, or national level. An additional five studies were identified after systematically searching the bibliographies of included articles. Of these 48, 43 estimated the incidence of SCI and nine reported the prevalence, with five discussing both.
Figure 1 displays the detailed search strategy and review process.
Prevalence
Prevalence is the proportion of a population living with a disease at a particular time. In our review, nine studies reported the prevalence of acute SCI. Of these, four provided national rates and five estimated prevalence in city centers or counties.8–16 Various methodologies were used to achieve
the closest approximation, including to 1) survey a portion of the population considered representative and, through inter-view, determine potential cases of SCI; 2) use the equation Prevalence = ID, where I is the annual incidence and D is the duration of disease; and 3) review available registers at rehabilitation centers, long-term care centers, and surgical departments. Table 2 displays how each study defined acute SCI and calculated prevalence.
The prevalence of SCI in the United States of America has been estimated by three studies. In 1975, John Kurtzke reported a prevalence of 525 per million by multiplying the incidence of 30 per million by an average life duration of 18 years.17 Since the age of peak incidence is typically
Table 1 Quality rating scale for incidence and prevalence studies
Checklist item original Comments/interpretations
1. was the primary objective of the study to estimate the incidence or prevalence of SCi?
Minor flaw if target population was not well defined. 2. what was the study design?
a. Cross-sectional b. Retrospective c. Prospective
Minor flaw if study design was retrospective.
3. How was SCI defined? a. iCD codes
b. Standard clinical definition
Minor flaw if definition was vague or did not include all relevant ICD codes. Minor flaw if definition of SCI was not provided.
4. Sampling methodology
a. Sampling subjects from the general population b. Nongeneral population sampling methods c. Nongeneral population-based sampling frame
Minor flaws if random sampling was restricted to a specific geographic area (a). Minor flaws if sampling methods were “convenient” or self-reported (b). Minor flaws if sampling was based on medical records, insurance claims, workplace, or health care-based (c).
5. is there sampling bias? if so, was it addressed in the analysis? Minor flaw if there was sampling bias.
Minor flaw if sampling bias was not reduced in analysis. 6. How was SCI identified or confirmed in population of interest?
a. Self-reported b. Proxy-reported
c. Objectively measured with diagnostic methods d. interviews
e. Obtained during clinical exam for the purpose of the study f. Obtained from medical records or administrative databases g. Obtained from registries
Minor flaws if self-reported or if data was mined from medical records or administrative databases.
7. were patients who died at the site of injury included? Minor flaw if incidence figures did not include these patients. 8. How was the incidence/prevalence reported? Minor flaw if point prevalence was reported.
9. is the precision of the estimate reported? Minor flaw if mean and variance of incidence or prevalence estimates were not reported (95% confidence intervals or standard error).
10. Are the estimates reliable? Minor flaw if reliability was not reported or if its evaluation was subjective.
Abbreviations: ICD, International Classification of Diseases; SCI, spinal cord injury.
Clinical Epidemiology downloaded from https://www.dovepress.com/ by 118.70.13.36 on 20-Aug-2020
Dovepress Singh et al
between 15 and 30 years of age, patients with a disease duration of 18 years would only live to be between 33 and 48 years. Using life expectancy tables, DeVivo et al first re-estimated the average postinjury life span of a patient as 30.2 years and calculated prevalence as 906 per million.8
Finally, Harvey et al proposed a mixed-mode sampling method to identify SCI cases in both a noninstitutional-ized and institutionalnoninstitutional-ized setting.9 First, 120 representative
primary sampling units were chosen and area segments within these locations were selected. Households were then surveyed to identify people living with SCI and to learn
about cases within the neighborhood or family. Second, a sample of nursing and long-term health care facilities from the primary sampling units were chosen and screened for potential cases. The total prevalence was estimated to be 721 per million.
Other countries that have quantified prevalence at a national level are Australia and Iceland.10,11 O’Connor used
current incidence and survival data from the Australian Spinal Cord Injury Register and estimated a prevalence of 681 per million in 1997.10 In Iceland, the crude prevalence
was 526 per million in 2009.11
Table 2 Prevalence studies
Region/state/country Definition of acute SCI Prevalence calculation Prevalence
United States of America (1988–1989)9
Medium
Not defined Mixed-model sampling design was used
to survey both noninstitutionalized and institutionalized populations.
Noninstitutionalized: area segments were selected with primary sampling units. institutionalized: nursing and long-term care health facilities within primary sampling units were sampled.
721 per million
United States of America8
Medium
Not defined Calculated by multiplying annual incidence
with life duration.
906 per million Olmsted County, Minnesota
(1935–1981)15
Medium
Definition coined by Kraus et al27
injuries extending from the foramen magnum to the cauda equina and complete nerve root avulsions were included
All Olmsted county residents with residual neurologic deficits from SCI. Includes patients who had their injuries prior to 1935 as well as those who moved to the county after injury.
Point prevalence: 220 per million in 1950 and 583 per million in 1981 Helsinki, Finland (1953–1998)12
Medium
iCD-9 codes 806, 952, and 9072A until 1995; ICD-10 codes S14.0-2, S24.0-2, S34.0-3, and T91.3 after 1995
Subjects were identified from the following sources: Kapyla Rehabilitation center, Department of Orthopedic Surgery at Helsinki University Central Hospital, local organization of the disabled, local health centers, residential service houses and published announcements.
280 per million
Rhone-Alpes Region, France (1970–1975)14
Low
Not defined Calculated by multiplying incidence by average life duration (Henry Gabrielle Hospital).
250 per million
Iceland (1975–2009)11
Medium
iCD-9 codes 806 and 952, and iCD-10 codes S14, S24, and S34 since 1997. Patients with isolated injuries of the nerve roots and patients with symptoms lasting for ,2 weeks were excluded
Prevalence was based on survival data on SCi patients included in study as well as 10 patients injured between 1973 and 1974.
526 per million
Western Norway (1952–2001)13
Medium
Clinical definition* Number of patients with SCi/100,000 inhabitants living in Hordaland and Sogn og Fjordane counties on January 1, 2002.
365 per million
Tehran, Iran (2007–2008)16
Medium
Not defined Two-stage survey strategy: detect all potential cases in study population and then confirm that patients had SCi.
Calculated by dividing the number of definite alive SCi cases by the total number of the study population.
Point prevalence: 440 per million
Australia (1986–1997)10
Medium
Not defined Calculated by multiplying current incidence by disease duration (Australian Spinal Cord Injury Register).
681 per million
Notes: For ICD-9/10 codes, see Table S2. *Acute, traumatic lesion of the spinal cord resulting in motor and/or sensory deficit and/or bowel/bladder dysfunction, either temporary or permanent.
Abbreviations: ICD, International Classification of Disease; SCI, spinal cord injury.
Clinical Epidemiology downloaded from https://www.dovepress.com/ by 118.70.13.36 on 20-Aug-2020
Dovepress Traumatic spinal cord injury
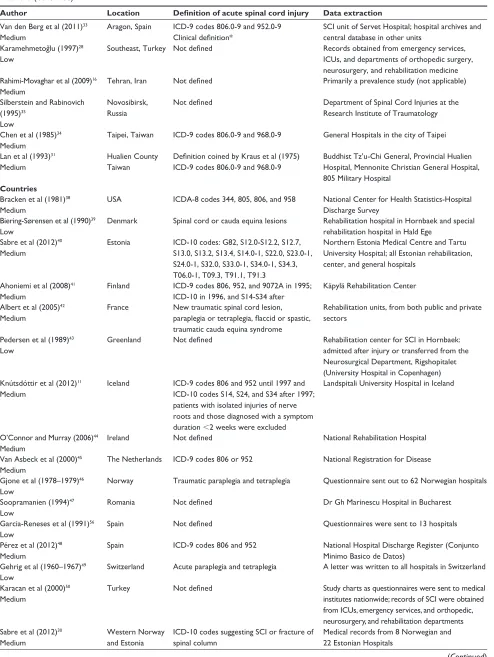
Table 3 incidence studies
Author Location Definition of acute spinal cord injury Data extraction
States and provinces of the United States or Canada Pickett et al (2003)20
High
Ontario, Canada iCD-9 codes N-806 or N-952 Ontario Trauma Registry McCammon and
Ethans (2011)21
Low
Manitoba, Canada Survival to hospital admission with SCi/ NTSCi or outpatient referral to a SCi rehabilitation specialist
winnipeg Rehabilitation Hospital and the Manitoba branch of the Canadian Paraplegic Association
Dryden et al (2003)19
Medium
Alberta, Canada iCD-9 codes 806.x or 952.x Clinical definition*
Alberta Health and wellness databases, Alberta Trauma Registry, Office of the Chief Medical Examiner
Lenehan et al (2012)18
Medium
British Columbia, Canada
iCD-9 codes 806.x and 952.x vancouver General Hospital
Provincial resources such as the British Columbia Trauma Registry
Price et al (1994)22
Medium
Oklahoma, USA Clinical definition* Multilevel surveillance system: physicians and hospitals reported acute injury, rehabilitation centers reported postacute injury, and State Medical Examiner reported fatal injury; SCI surveillance systems in Texas and Colorado reported Oklahoma residents injured in those states
Surkin et al (2000)25
Medium
Mississippi, USA iCD-9 codes 806.0-9 and 952.0-9 Additionally, 805.0-9 were used to identify potential cases
Clinical definition*
The Mississippi SCi surveillance system
Thurman et al (1994)24
Medium
Utah, USA iCD-9 codes 806.0-9 and 952.0-9 Clinical definition*
Statewide reporting system of the Utah Department of Health, Bureau of Epidemiology (discharge data from all acute care hospitals, list of patients with SCi from rehabilitation units and death certificates) Warren et al (1995)23
Medium
Alaska, USA iCD-9 codes 806.0-9 and 952.0-953.99 Clinical definition*
Alaska Trauma Registry, National Center for Health Statistics, US Centers for Disease Control and Prevention
Kraus et al (1975)27
Medium
California, USA Acute, traumatic lesion of the spinal cord, including trauma to the nerve roots, resulting in varying degrees of motor/ sensory deficit or paralysis
All hospitals and coroner’s offices in each county and from the records of the State of California Departments of Health, Rehabilitation, and industrial Relations
Fine et al (1979–1980)26
Low
Alabama, USA Not defined Model Regional SCi Center at the University of
Alabama Regions
Pickett et al (2006)37
Medium
London, Canada iCD-9 codes 952.x and 806.x London Health Sciences Center Burke et al (2001)32
Medium
Counties in Kentucky and indiana, USA
iCD-9 codes 806.0-9 and 952.0-9 University of Louisville Hospital SCi Trauma Registry and patient records
Griffin et al (1985)15
Medium
Olmsted County, Minnesota
Definition coined by Kraus et al27
injuries extending from the foramen magnum to the cauda equina and complete nerve root avulsions were included
Medical records-linkage system of the Rochester Project at the Mayo Clinic
Death certificates and autopsy protocols Minaire et al (1978–1979)14
Low
Rhone-Alpes region, France
Not defined Henry Gabrielle Hospital
Divanoglou and Levi (2009)36
High
Thessaloniki, Greece and Stockholm, Sweden
Acute traumatic injury of the spinal cord, including cauda equina and conus medullaris injuries, resulting in motor/sensory deficits and/or bladder/bowel dysfunction persisting for at least 72 hours post-trauma
Thessaloniki: four tertiary hospitals handling acute SCi
Stockholm: one hospital-based spinal injury unit, two inpatient rehabilitation centers, and one outpatient clinic for life-long follow-up Hagen et al (2010)13
Medium
Hordaland and Sogn og Fjordane, Norway
Clinical definition* Eight hospitals within the two counties; data collection was carried out according to a subset of the Nordic SCi registry
Martins et al (1998)29
Medium
Central region of Portugal
iCD-9 codes 806 and 952 Clinical definition*
Coimbra Hospital Center and Coimbra University Hospitals; Department of Legal Medicine to identify deaths resulting from trauma
(Continued)
Clinical Epidemiology downloaded from https://www.dovepress.com/ by 118.70.13.36 on 20-Aug-2020
Dovepress Singh et al
Table 3 (Continued)
Author Location Definition of acute spinal cord injury Data extraction
Van den Berg et al (2011)33
Medium
Aragon, Spain iCD-9 codes 806.0-9 and 952.0-9 Clinical definition*
SCI unit of Servet Hospital; hospital archives and central database in other units
Karamehmetog˘lu (1997)28
Low
Southeast, Turkey Not defined Records obtained from emergency services, iCUs, and departments of orthopedic surgery, neurosurgery, and rehabilitation medicine Rahimi-Movaghar et al (2009)16
Medium
Tehran, iran Not defined Primarily a prevalence study (not applicable)
Silberstein and Rabinovich (1995)35
Low
Novosibirsk, Russia
Not defined Department of Spinal Cord injuries at the
Research institute of Traumatology Chen et al (1985)34
Medium
Taipei, Taiwan iCD-9 codes 806.0-9 and 968.0-9 General Hospitals in the city of Taipei Lan et al (1993)31
Medium
Hualien County Taiwan
Definition coined by Kraus et al (1975) iCD-9 codes 806.0-9 and 968.0-9
Buddhist Tz’u-Chi General, Provincial Hualien Hospital, Mennonite Christian General Hospital, 805 Military Hospital
Countries Bracken et al (1981)38
Medium
USA iCDA-8 codes 344, 805, 806, and 958 National Center for Health Statistics-Hospital Discharge Survey
Biering-Sørensen et al (1990)39
Low
Denmark Spinal cord or cauda equina lesions Rehabilitation hospital in Hornbaek and special rehabilitation hospital in Hald Ege
Sabre et al (2012)40
Medium
Estonia iCD-10 codes: G82, S12.0-S12.2, S12.7, S13.0, S13.2, S13.4, S14.0-1, S22.0, S23.0-1, S24.0-1, S32.0, S33.0-1, S34.0-1, S34.3, T06.0-1, T09.3, T91.1, T91.3
Northern Estonia Medical Centre and Tartu University Hospital; all Estonian rehabilitation, center, and general hospitals
Ahoniemi et al (2008)41
Medium
Finland iCD-9 codes 806, 952, and 9072A in 1995; iCD-10 in 1996, and S14-S34 after
Käpylä Rehabilitation Center Albert et al (2005)42
Medium
France New traumatic spinal cord lesion, paraplegia or tetraplegia, flaccid or spastic, traumatic cauda equina syndrome
Rehabilitation units, from both public and private sectors
Pedersen et al (1989)43
Low
Greenland Not defined Rehabilitation center for SCi in Hornbaek:
admitted after injury or transferred from the Neurosurgical Department, Rigshopitalet (University Hospital in Copenhagen) Knútsdóttir et al (2012)11
Medium
iceland iCD-9 codes 806 and 952 until 1997 and iCD-10 codes S14, S24, and S34 after 1997; patients with isolated injuries of nerve roots and those diagnosed with a symptom duration ,2 weeks were excluded
Landspitali University Hospital in iceland
O’Connor and Murray (2006)44
Medium
ireland Not defined National Rehabilitation Hospital
Van Asbeck et al (2000)45
Medium
The Netherlands iCD-9 codes 806 or 952 National Registration for Disease Gjone et al (1978–1979)46
Low
Norway Traumatic paraplegia and tetraplegia Questionnaire sent out to 62 Norwegian hospitals Soopramanien (1994)47
Low
Romania Not defined Dr Gh Marinescu Hospital in Bucharest
Garcia-Reneses et al (1991)56
Low
Spain Not defined Questionnaires were sent to 13 hospitals
Pérez et al (2012)48
Medium
Spain iCD-9 codes 806 and 952 National Hospital Discharge Register (Conjunto Minimo Basico de Datos)
Gehrig et al (1960–1967)49
Low
Switzerland Acute paraplegia and tetraplegia A letter was written to all hospitals in Switzerland Karacan et al (2000)50
Medium
Turkey Not defined Study charts as questionnaires were sent to medical
institutes nationwide; records of SCI were obtained from iCUs, emergency services, and orthopedic, neurosurgery, and rehabilitation departments Sabre et al (2012)30
Medium
western Norway and Estonia
iCD-10 codes suggesting SCi or fracture of spinal column
Medical records from 8 Norwegian and 22 Estonian Hospitals
(Continued)
Clinical Epidemiology downloaded from https://www.dovepress.com/ by 118.70.13.36 on 20-Aug-2020
Dovepress Traumatic spinal cord injury
In Europe, prevalence has been estimated in Helsinki, Finland, Western Norway, and the Rhone-Alpes region in France.12–14 Patients with SCI living in Helsinki were
identi-fied using several sources: a list of in- or outpatients from the Kapyla Rehabilitation Center; ICD-9 or ICD-10 codes from the department of Orthopedic Surgery at Helsinki University Central Hospital; the membership of the local organization for the disabled; local health centers; residen-tial service houses; and published announcements.12 With
this information, the prevalence of SCI was reported to be 280 per million. In Western Norway, Hagen et al reviewed the records from eight hospitals within two Norwegian counties, Hordaland and Sogn og Fjordane.13 As of January 2002, the
crude prevalence in this region was 365 per million, with rates of 351 per million and 419 per million in Hordaland and Sogn og Fjordane County, respectively. Finally, in the
Rhone-Alpes region, the prevalence was extrapolated from the incidence using an average duration of life of 20 years and was 250 per million.14
The true prevalence of Olmsted County, Minnesota was calculated by counting all SCI patients with residual neuro-logical deficits living in this region in 1950, 1960, 1970, and 1980.15 This estimation also includes patients who moved to
the county after sustaining an injury elsewhere. The point prevalence increased over time from 220.1 per million in 1950, 242.7 per million in 1960, and 456.7 per million in 1970 to 582.5 per million in 1980.
In Tehran, Iran, a two-stage survey strategy was used to evaluate the point prevalence of SCI.16 The study population
was determined using random cluster sampling: 100 addresses were used as the starting point and 25 households around the same region were surveyed. If a potential case of SCI was
Table 3 (Continued)
Author Location Definition of acute spinal cord injury Data extraction
Otom (1997)51
Medium
Jordan Definition coined by Kraus et al (1975) Royal Jordanian Rehabilitation Centre and King Hussein Medical Centre
Shingu et al (1994)52
Low
Japan iCD-9 codes 806.0-9 and 952.0-9 Nerve root or plexus injuries were excluded
Questionnaire were sent to nationwide orthopedic and neurosurgery departments, rehabilitation units, and emergency medical service centers
O’Connor (2002)53
Medium
Australia Clinical definition* Australian SCi Register
Maharaj (1996)55
Low
Fiji islands Spinal cord paralysis as defined by ASIA Medical Rehabilitation Unit at Tamavua Hospital Dixon (1993)54
Medium
New Zealand iCD-9 codes: 806, 952 and 907.2, 342, 344, 805, 839, and 953
Health Statistics Services files of New Zealand
Notes: For ICD-8/9/10 codes, Table S2. *Acute, traumatic lesion of the spinal cord resulting in motor and/or sensory deficit and/or bowel/bladder dysfunction, either temporary or permanent.
Abbreviations: ASIA, American Spinal Injury Association score; ICU, intensive care unit; ICD, International Classification of Disease; NTSCI, nontraumatic SCI; SCI, spinal cord injury.
Total
5,875
5,833 excluded: did not report
either the prevalence or incidence of acute SCI at a regional, state/provincial, or national level EMBASE
2,106
Total included in the review:
47
MEDLINE
3,461
Cochrane register of controlled trials
3
MEDLINE in process
157
Cochrane database of systematic reviews
151
Relevant articles found after bibliography search:
5
Incidence studies:
43
Prevalence studies:
9
Prevalence and incidence studies:
5
Figure 1 Detailed search and review strategy.
Abbreviation: SCi, spinal cord injury.
Clinical Epidemiology downloaded from https://www.dovepress.com/ by 118.70.13.36 on 20-Aug-2020
Dovepress Singh et al
detected, a nurse would go to the house and conduct a thorough examination to confirm the presence of a SCI. Point prevalence was defined as the number of alive SCI patients divided by the total number of the study population. It was 440 per million.
incidence
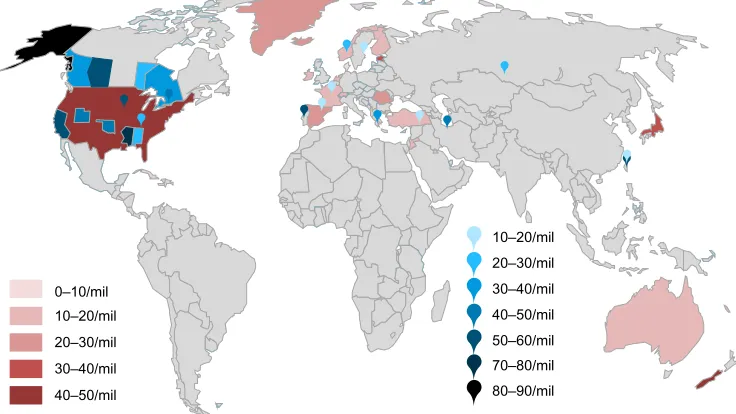
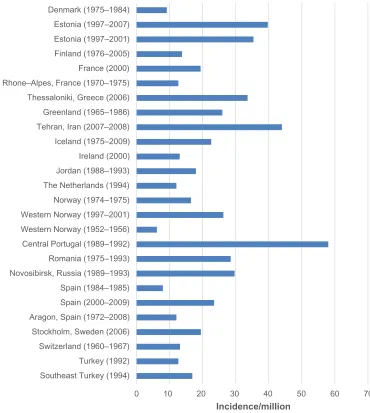
The incidence of a disease is the number of new cases in a pop-ulation at risk in a given time period. In this review, 44 studies reported on the incidence of SCI: 13 at a regional level, ten at a state or provincial level, and 21 at a national level. Figure 2 is a map of the world and highlights relative incidences. Figure 3 illustrates the incidence in countries, states/provinces, and regions of North America. Figure 4 displays the incidence in countries and regions of Asia Pacific (East Asia and Australia). Figure 5 presents the incidence in countries and regions of Europe and the Middle East. The majority of studies reported crude incidence, and therefore comparisons between countries, states/provinces, and regions could not be made.
Provincial/state
Ten studies assessed the incidence of SCI in North American states and provinces, including British Columbia, Alberta, Manitoba, and Ontario in Canada and Oklahoma, Mississippi, Utah, Alaska, Alabama, and California in the United States.18–27 Table 3 displays how each study defined
acute SCI and the resources or systems used to estimate inci-dence. In 1975, Kraus et al defined SCI as an acute, traumatic lesion of the spinal cord, including trauma to the nerve roots, resulting in varying degrees of motor and/or sensory deficit
or paralysis.27 Five studies used a slightly modified definition
proposed by the Center for Disease Control and Prevention: an acute, traumatic lesion of neural elements in the spinal canal (spinal cord or cauda equina) resulting in motor and/or sensory deficit or bowel/bladder dysfunction, either tempo-rary or permanent.19,22–25 In addition to the clinical definition,
the majority of studies used ICD-9 codes to identify cases of acute SCI.18–20,23–25 Specifically, codes 806 (fracture of
vertebral column with spinal cord lesion), 952 (spinal cord lesion without evidence of spinal bone injury), and 805 (frac-ture of the vertebral column without mention of spinal cord lesion) were deemed relevant. A detailed list of ICD codes is provided in Table S2.
In Canada, various resources were used to identify cases of SCI and to quantify an annual incidence. In Ontario, the Ontario Trauma Registry contains records for all acute care injury hospitalizations in the province and was searched for relevant diagnostic codes.20 Similarly, Alberta has a trauma registry that
provides detailed information on patient demographics, severity of injury, and causation.19 Two additional sources were used in
Alberta: 1) the Health and Wellness database, which contains records of all hospitals and medical services in the province, and 2) the Office of the Chief Medical examiner, which inves-tigates all unexplained deaths. To estimate incidence in British Columbia, only registers at the Vancouver General Hospital were reviewed, as this center represents the sole subspecialty SCI center in the province.18 Finally, in Manitoba, data from
the Canadian Paraplegic Association and the Winnipeg Rehabilitation center were used to identify cases.21
A.
0–10/mil 10–20/mil 20–30/mil 30–40/mil 40–50/mil
10–20/mil 20–30/mil 30–40/mil 40–50/mil 50–60/mil 70–80/mil 80–90/mil
Figure 2 Relative annual incidences of countries, states/provinces, and regions.
Notes: The red color scheme illustrates incidences of countries. The blue color scheme highlights incidences of states/provinces and regions.
Abbreviation: mil, million.
Clinical Epidemiology downloaded from https://www.dovepress.com/ by 118.70.13.36 on 20-Aug-2020
Dovepress Traumatic spinal cord injury
0 Ontario (1998–1999) Manitoba (2003–2007) British Columbia (2004) Alberta (1997–2000) NW Kentuky/S Indiana (1993–1998) Canada Olmstead County (1935–1981) Utah (1989–1991) Oklahoma (1988–1990) Mississippi (1992–1994) California (1970–1971) Alaska (1991–1993) Alabama (1973–) United States (1970–1977)
Incidence/million 90
80 70 60 50 40 30 20 10
Figure 3 Annual incidence of spinal cord injury in regions within the United States of America and Canada, including provinces and states.
Abbreviations: NW, Northwest; S, Southern.
0 Fiji (1985–1994) New Zealand (1979–1988) Australia (1998–1999) Taipei, Taiwan (1978–1981) Hualien County, Taiwan (1986–1990) Japan (1990)
Incidence/million
60 50
40 30
20 10
Figure 4 Annual incidence of spinal cord injury in regions and countries in Asia Pacific.
Many studies in the United States used extensive surveillance systems to accurately identify all cases of SCI. For example, in Oklahoma and Utah, information was obtained from acute care centers, rehabilitation units and either the state medical examiner or death certificates.22,24 In addition,
SCI surveillance systems in Texas and Colorado were used to detect Oklahoma residents who were injured in neighboring locations.22 Kraus et al also used several resources
includ-ing all hospitals and coroners in 18 Californian counties to identify all admitted SCI patients as well as those who died at the scene of the accident or during transfer.27 In contrast,
the study by Warren et al used the Alaska Trauma Registry and the National Center for Health Statistics to determine national rates.23
Table 4 displays the annual incidence of SCI per million, the male-to-female ratio, age of peak incidence, causation,
and level of injury in Canada and the United States of Amer-ica. Incidences across provinces cannot be compared, as the data were collected at varying time points; however, exploring relative changes is valuable. In Alberta and Ontario, the inci-dence of SCI has decreased over time.19,20 In Ontario, the
age-standardized incidence was 46.2 per million in 1994/1995 (95% confidence interval [CI]: 42.1–50.3) and was 37.2 per million in 1998/1999 (95% CI: 33.8–41.0).20 Over a 3-year
period, the estimated incidence in Alberta decreased from 57 per million in 1997–1998 to 47.9 per million in 1999–2000.19
In British Columbia, there was a downward trend from 42.2 per million in 1995 to 32.5 per million in 2004, although the lowest rate was 27.9 per million in 1999.18 In contrast, the
incidence progressively increased in Manitoba from 17.1 per million per year between 1981 and 1985 to 25.6 per million per year between 2003 and 2007.21 The five studies conducted
Clinical Epidemiology downloaded from https://www.dovepress.com/ by 118.70.13.36 on 20-Aug-2020
Dovepress Singh et al
in the United States did not present a summary of incidence over time. Within 5 years, the incidence of Oklahoma, Alaska, Utah, and Mississippi were estimated.22–25 Alaska and
Missis-sippi had much higher reported incidences of 83 per million and 77 per million, respectively, compared to incidence in Oklahoma (40 per million) and Utah (43 per million).
All studies showed a greater percentage of males with injuries compared to females. In Manitoba, however, the male-to-female ratio significantly decreased from the 1980s (12:1) to the 2000s (4.4:1) due to an increase in motor-vehicle-related injuries in females.21 The ratio in
Alaska was 5:1, which was larger than any other state or province.23 As expected, the age of peak incidence was
typically between 15 and 30 years of age. The age of peak incidence, however, was over 70 years of age for both
males and females in Ontario and over 85 years of age for females in British Columbia.18,20 In Alberta, Oklahoma, and
Alaska, the peak age of females was slightly younger than that of males.19,22,23
With respect to the etiology of SCI, studies used different definitions of traffic accidents, falls, violence, and sports. For example, motor vehicle accidents in British Columbia included all passengers, drivers, pedestrians, and cyclists injured during the accident.18 On the other hand, in Ontario,
a traffic incident was divided into motor vehicle (occupant, motorcyclist, pedestrian, and pedal cyclist), nonmotorized vehicle (pedal cyclist, rider of animal and pedestrian), and air, space, and water transport.20 With a view to
standardiz-ing etiological definitions, we combined various causations into single categories: 1) all car, plane, motorcycle, and
0 Southeast Turkey (1994)
Turkey (1992) Switzerland (1960–1967) Stockholm, Sweden (2006) Aragon, Spain (1972–2008) Spain (2000–2009) Spain (1984–1985) Novosibirsk, Russia (1989–1993) Romania (1975–1993) Central Portugal (1989–1992) Western Norway (1952–1956) Western Norway (1997–2001) Norway (1974–1975) The Netherlands (1994) Jordan (1988–1993) Ireland (2000) Iceland (1975–2009) Tehran, Iran (2007–2008) Greenland (1965–1986) Thessaloniki, Greece (2006) Rhone–Alpes, France (1970–1975) France (2000) Finland (1976–2005) Estonia (1997–2001) Estonia (1997–2007) Denmark (1975–1984)
Incidence/million
70 60
50 40 30 20 10
Figure 5 Annual incidence of spinal cord injury in regions and countries in Europe and the Middle East.
Clinical Epidemiology downloaded from https://www.dovepress.com/ by 118.70.13.36 on 20-Aug-2020
Dovepress Traumatic spinal cord injury
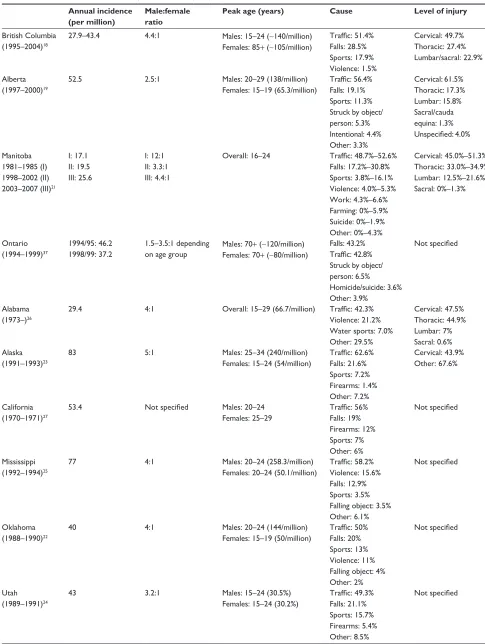
Table 4 incidence and causation of spinal cord injury in provinces and states of Canada and the United States of America
Annual incidence (per million)
Male:female ratio
Peak age (years) Cause Level of injury
British Columbia (1995–2004)18
27.9–43.4 4.4:1 Males: 15–24 (∼140/million)
Females: 85+ (∼105/million)
Traffic: 51.4% Falls: 28.5% Sports: 17.9% violence: 1.5%
Cervical: 49.7% Thoracic: 27.4% Lumbar/sacral: 22.9% Alberta
(1997–2000)19
52.5 2.5:1 Males: 20–29 (138/million)
Females: 15–19 (65.3/million)
Traffic: 56.4% Falls: 19.1% Sports: 11.3% Struck by object/ person: 5.3% intentional: 4.4% Other: 3.3%
Cervical: 61.5% Thoracic: 17.3% Lumbar: 15.8% Sacral/cauda equina: 1.3% Unspecified: 4.0% Manitoba
1981–1985 (I) 1998–2002 (II) 2003–2007 (III)21
i: 17.1 ii: 19.5 iii: 25.6
i: 12:1 ii: 3.3:1 iii: 4.4:1
Overall: 16–24 Traffic: 48.7%–52.6% Falls: 17.2%–30.8% Sports: 3.8%–16.1% violence: 4.0%–5.3% work: 4.3%–6.6% Farming: 0%–5.9% Suicide: 0%–1.9% Other: 0%–4.3%
Cervical: 45.0%–51.3% Thoracic: 33.0%–34.9% Lumbar: 12.5%–21.6% Sacral: 0%–1.3%
Ontario (1994–1999)37
1994/95: 46.2 1998/99: 37.2
1.5–3.5:1 depending on age group
Males: 70+ (∼120/million) Females: 70+ (∼80/million)
Falls: 43.2% Traffic: 42.8% Struck by object/ person: 6.5% Homicide/suicide: 3.6% Other: 3.9%
Not specified
Alabama (1973–)26
29.4 4:1 Overall: 15–29 (66.7/million) Traffic: 42.3%
violence: 21.2% water sports: 7.0% Other: 29.5%
Cervical: 47.5% Thoracic: 44.9% Lumbar: 7% Sacral: 0.6% Alaska
(1991–1993)23
83 5:1 Males: 25–34 (240/million)
Females: 15–24 (54/million)
Traffic: 62.6% Falls: 21.6% Sports: 7.2% Firearms: 1.4% Other: 7.2%
Cervical: 43.9% Other: 67.6%
California (1970–1971)27
53.4 Not specified Males: 20–24
Females: 25–29
Traffic: 56% Falls: 19% Firearms: 12% Sports: 7% Other: 6%
Not specified
Mississippi (1992–1994)25
77 4:1 Males: 20–24 (258.3/million)
Females: 20–24 (50.1/million)
Traffic: 58.2% violence: 15.6% Falls: 12.9% Sports: 3.5% Falling object: 3.5% Other: 6.1%
Not specified
Oklahoma (1988–1990)22
40 4:1 Males: 20–24 (144/million)
Females: 15–19 (50/million)
Traffic: 50% Falls: 20% Sports: 13% violence: 11% Falling object: 4% Other: 2%
Not specified
Utah (1989–1991)24
43 3.2:1 Males: 15–24 (30.5%)
Females: 15–24 (30.2%)
Traffic: 49.3% Falls: 21.1% Sports: 15.7% Firearms: 5.4% Other: 8.5%
Not specified
Clinical Epidemiology downloaded from https://www.dovepress.com/ by 118.70.13.36 on 20-Aug-2020
Dovepress Singh et al
other transport accidents, including pedestrians and cyclists involved in collision, were defined as “traffic”; stabbing, gun-shots, and assault were categorized as “violence”; all sport and recreation injuries, including diving, were considered “sports”; and intentional falls or self-inflicted injury were defined as “suicide.”
Traffic accidents (42.3%–62.6%) were the primary cause of SCI in all province and states, with the exception of Ontario, where falls were more prevalent. Falls, from either elevation or at ground level, were typically the second most common etiology. In Alabama and Mississippi, however, injuries due to violence made up a larger percentage (21.2% and 15.6%, respectively) than injuries due to falls.25,26 Only
1.5 to 5.3% of injuries in Canadian provinces were due to violence, a percentage significantly lower than in American states.18,21,22,25,26 Injuries due to sports and recreation,
includ-ing divinclud-ing, were the highest in British Columbia (17.9%) and Utah (15.7%) and the lowest in Mississippi (3.5%).18,24,25
Suicide-related SCIs were not reported everywhere, making it difficult to draw conclusions on differences in rates.
The most common anatomical region of injury was the cervical spine (43.9%–61.5%).
Regions
Nine studies reported on the incidence of various regions or counties, including Southeast Turkey; the central region of Portugal; Western Norway (n=2); the Rhone-Alpes region in France; Aragon, Spain; Hualien County, Taiwan; Northwest Kentucky and Southern Indiana; and Olmsted county in Minnesota.13–15,28–32 An additional five studies estimated the
incidence of SCI in cities: Tehran, Iran; Taipei, Taiwan; Novosibirsk, Russia; London, Canada; Stockholm, Sweden; and Thessaloniki, Greece.16,33–37
Table 3 illustrates how each study defined SCI and the sources used to obtain estimates of incidence. Studies by Griffin et al and Lan et al used the definition coined by Kraus et al27 and included patients with trauma to the nerve
roots.15,31 Many other studies used the modified definition
presented earlier and excluded patients with nerve root avulsions.13,29,33 In the study on Stockholm and Thessaloniki,
SCI was defined as an acute traumatic injury of the spinal cord, including cauda equina and conus medullaris injuries, resulting in motor/sensory deficits and/or bladder/bowel dysfunction persisting for at least 72 hours post-trauma.36
This 72-hour requirement was not specified in previous defi-nitions and likely excludes all patients who died at the scene of the accident or during transfer to an acute care center. The majority of studies also used ICD-9 codes to identify patients
diagnosed with SCI: 806 and 952 as well as 968 (spinal cord lesion without evidence of spine injury) in Taiwanese regions or cities.29,31–34,37
The majority of studies used information from acute care centers and regional general hospitals to identify patients. This methodology was deemed adequate as many cities or regions only have a few centers that are responsible for managing patients with SCI. For example, the University of Louisville Hospital services people located within a 50-mile radius, including 18 counties in Kentucky and eleven counties in Indiana.32 In the study by Burke et al,32 incidence was
cal-culated using information from the hospital’s trauma registry and the US Census Bureau population estimates. Similarly, in the central region of Portugal, all acute SCIs are treated at the Coimbra hospitals; data extraction from these hospitals should therefore provide an accurate estimate of incidence.29
In addition, the department of Legal Medicine was accessed to identify patients who died from traumatic causes. In the Rhone-Alpes region and Western Norway, patients who had died prior to hospital arrival were not included.13,14 Although
not specified, this was probably the case in many of the other studies included in this review.
Table 5 displays the annual incidence of SCI per million, the male-to-female ratio, age at peak incidence, causation, and level of injury for these regions. Again, these studies were conducted in different years and over varying lengths of time, making it challenging to compare estimates. The incidence of SCI significantly increased over time in Hordaland and Sogn og Fjordane County in Western Norway (6.2 per million in 1952–1956 to 26.3 per million in 1997–2001), Olmsted County in Minnesota (22.2 per million in 1935–1944 to 70.8 per million in 1975–1981), and in London, Ontario (21 per million in 1997 to 49 per million in 2000).13,15,37
There has also been a progressive increase in the number of SCI cases in the central region of Portugal, from 68 new cases in 1989 to 106 in 1992, likely reflecting an increase in incidence.29 In Aragon, Spain, following an increase
from 8.2 per million in 1972–1980 to 13.8 per million in 1981–1990, the incidence was relatively stable over the next 18 years.33 In the Rhone-Alpes region in France, there was
no upward or downward trend in the number of SCI cases between 1970 and 1975, although an actual incidence was not given for each of these 6 years.14
Within similar time periods, the incidence of SCI in the central region of Portugal (58 per million) was similar to that in Hualien County, Taiwan (56.1 per million).29,31
Ten years earlier, the incidence of SCI in Taipei, Taiwan (14.6 per million) was significantly lower.31,34 Some possible
Clinical Epidemiology downloaded from https://www.dovepress.com/ by 118.70.13.36 on 20-Aug-2020
Dovepress Traumatic spinal cord injury
Table 5 incidence and causation of spinal cord injury in cities and regions
Annual incidence (per million population)
Male:female ratio Peak age Causation Level of injury
London, Ontario, Canada (1997–2000)20
∼49 in 2000 3:1 Overall: 20–29 (20%) Traffic: 47%
Falls: 31% Sports: 9.3% work: 6.6% violence: 4.6% Suicide: 1.3%
Cervical: 75% Thoracic: 10% Lumbar: 9% Junctions: 6%
Central Portugal region (1989–1992)29
58 3.4:1 Males: 70–74 (285/million)
Females: 80–84 (64/million)
Traffic: 57.3% Falls: 37.4% Other: 5.3%
Cervical: 51.2% Thoracic: 41% Lumbar: 7.8% Hualien county, Taiwan
(1986–1990)31
56.1 4:1 Overall: 20–29 and 30–39
(19.2% each group)
Traffic: 61.6% Falls: 23.3% Sports: 6.1% Struck by object: 4% violence: 3% Suicide: 2%
Not specified
Taipei, Taiwan (1978–1981)34
14.6 4.9:1 Overall: 20–29 (31.8%) Traffic: 44.5%
Falls: 28.5%
Struck by object: 14.6% Sports: 3.4%
violence: 2.7% Suicide: 1.4% Other: 5.6%
Cervical: 46.8% Thoracic or below: 53.2%
Novosibirsk, Russia (1989–1993)35
29.7 3.6:1 Overall: 20–29 (38.3%) Falls: 37.3%
Sports: 32.9% Traffic: 25.1% Suicide: 3.1% violence: 1.6%
Cervical: 49.0% Thoracic: 27.5% Lumbar: 23.5%
Rhone-Alpes Region, France (1970–1975)14
12.7 3.7:1 Overall: 20–30 Traffic: 47.2%
Falls: 24.25% Sports: 7.8% Struck by object: 7.5% Suicide: 4.3% violence: 0.8% Other: 8.1%
Only specified by causation
Northwestern Kentucky and Southern indiana (1993–1998)32
25.2 3:1 Overall: 18–24 (78.3/million) Traffic: 54.7%
Falls: 23.0% violence: 14.2% Other: 8.1%
Cervical: 49.7% Thoracic: 35.3% Lumbar: 15.0%
Olmstead County, Minnesota (1935–1981)15
54.8 2.6:1 Not given Not given Not given
Aragon, Spain (1972–2008)33
12.1 3.9:1 Males: 20–29 (36.1/million)
Females: 20–29 (6.7/million)
Traffic: 57.0% Falls: 24.6% violence: 3.9% Sports: 1.9%
Cervical: 36.9% Thoracic: 37.4% Lumbar: 19.3% Sacral: 4.3% Southeast, Turkey
(1994)28
16.9 5.8:1 Overall: 40–49 (52.6/million) Falls/traffic/violence: 93.2% Struck by object: 5.2% Suicide: 1.3%
Not reported
Thessaloniki, Greece (2006)36
33.6 7:1 Overall: 16–30 (41%) Traffic: 51%
Falls: 37% Sports: 4% iatrogenic: 4% violence: 2% Other: 2%
Cervical: 48% Thoracic: 40% Lumbar/sacral: 12%
(Continued)
Clinical Epidemiology downloaded from https://www.dovepress.com/ by 118.70.13.36 on 20-Aug-2020
Dovepress Singh et al
Table 5 (Continued)
Annual incidence (per million population)
Male:female ratio Peak age Causation Level of injury
Stockholm, Sweden (2006)36
19.5 3:1 Overall: 61–75 (28%) Falls: 47%
Traffic: 23% Sports: 17% iatrogenic: 4% violence: 2% Other: 6%
Cervical: 43% Thoracic: 45% Lumbar/sacral: 11%
western Norway (1997–2001)13
26.3 3.4:1 Males: 70–79 (∼130/million)
Females: 20–29 (∼117/million)
Falls: 45.1% Traffic: 40.8% Sports: 9.9% Other: 4.2%
Cervical: 57.8% Thoracic: 21.1% Lumbar: 21.1% western Norway
(1952–2001)30
6.2 (1952–1956) 26.3 (1997–2001)
4.7:1 Males: 20–29
Females: 70–79
Falls: 45.5% Traffic: 34.2% Sports: 8.6% Other: 11.6%
Cervical: 52.4% Thoracic: 29.5% Lumbar/sacral: 18.2% Tehran, iran
(2007–2008)16
44 Not specified Not specified Not specified Not specified
explanations for this higher incidence in Hualien County are 1) motorcycles are the major transportation vehicle; 2) the Hualien region is a mountainous area with large mining and quarrying industries, resulting in an increased frequency of falls; and 3) alcoholism is much more common in rural regions of Taiwan than in urban city centers.31 The incidence
of SCI in Taipei was similar to that in the Rhone-Alpes region of France (12.7 per million), Aragon, Spain (12.1 per million), and Southeast Turkey (16.9 per million).14,28,33,34
In a study by Divanoglou et al, the incidence of SCI was compared between Stockholm, Sweden and Thessaloniki, Greece.36 The annual crude incidence was 33.6 per million
in Thessaloniki and was significantly higher than the inci-dence in Stockholm, Sweden (19.5 per million). The major difference between the two cities is that individuals from Thessaloniki were more frequently involved in transporta-tion accidents, suggesting a need for improved road safety in Greece.
In all studies, there was a greater percentage of males with SCI than females. Eighty-eight percent of patients in Thessaloniki, Greece were male, representing the largest male:female ratio (7:1).36 The smallest ratio was 2.6:1 in
Olmsted County, Minnesota.15 As expected, the age of peak
incidence was typically between 15–30 years of age or over 70 years for both sexes. An exception to this was Southeast Turkey, where the peak incidence occurred in the 40–49 age group.28
With respect to the etiology of injury, traffic accidents were the primary cause of SCI in all regions (44.5%–61.6%), except for Novosibirsk, Russia (25.1%), Stockholm, Sweden
(23%), and Western Norway (34.2%–40.8%), where falls were more prevalent. Falls, either from elevation or ground level, were typically the second most common cause of SCI. In Novosibirsk, Russia and Stockholm, Sweden, 32.9% and 17% of injuries were due to sports and recreation, respec-tively.35,36 The percentages of sports injuries in Taipei (3.4%),
Aragon, Spain (1.9%) and Thessaloniki, Greece (4%) were significantly lower.33,34,36 Fourteen percent of injuries were
due to violence in the Northwestern Kentucky and Southern Indiana region, a percentage much higher than in all other regions (0.8%–4.6%).32 Finally, the number of injuries due to
suicide attempts was typically very low.28,31,34,35,37 The region
with the highest percentage of injuries due to suicide attempts was the Rhone-Alpes region (4.3%).14
Injuries to the cervical spine were the most frequent in all regions and cities. In Stockholm, Sweden and Aragon, Spain, however, there was a greater number of thoracic injuries compared to cervical spine injuries.33,36
Countries
Twenty-one studies discussed the incidence of SCI at a national level, including in 13 European countries (Denmark, Estonia [n=2], Finland, France, Greenland, Iceland, Ireland, the Netherlands, Norway, Romania, Spain [n=2], Switzerland and Turkey), four Asia Pacific countries (Japan, New Zea-land, Australia, Fiji), Jordan, and the United States of America.11,30,38–56 Figure 6 is a map of injury causation.57
Table 3 displays how each study defined SCI and the sources used to estimate incidence. The majority used diag-nostic codes.11,30,38,40,41,45,48,52,54 In addition to ICD-9 806 and
Clinical Epidemiology downloaded from https://www.dovepress.com/ by 118.70.13.36 on 20-Aug-2020
Dovepress Traumatic spinal cord injury
952 codes, a study based in New Zealand used ICD-9 codes 907 (late effects of SCI), 342 (hemiplegia), 344 (other para-lytic syndromes), 805, 839 (other, multiple, and ill-defined dislocations), and 953 (injury to nerve roots and spinal plexus), and a study from Iceland used ICD-9 code 907 to detect other or incorrectly coded SCI cases.11,54 In the study
by Ahoniemi et al, ICD-9 codes were used in 1995, ICD-10 codes in 1996, and S14-S34 after 1996.41 In Estonia, SCI was
detected using an extensive list of ICD-10 codes.40
In the United States, the national incidence of SCI was estimated using data from the National Center for Health Statistics – Hospital Discharge Survey, which contains discharge records from selected nationwide hospitals.38
Many other studies identified SCI patients using records from several hospitals, rehabilitation units, orthopedic and neurosurgery departments, and emergency medical services. In contrast, some studies used information from a small list of hospitals or rehabilitation centers, as in some countries there are only a few facilities responsible for managing acute injuries. For example, in Ireland, data from the National Rehabilitation Hospital was used to determine incidence, as it receives all transfers from the main neurosurgery and ortho-pedic centers in Dublin and Cork.44 Interestingly, patients in
Greenland requiring specialized SCI treatment are referred to the Rigshospitalet in Denmark and transferred to Hornbaek following surgery. Similarly, all patients injured in Denmark
are admitted to either Hornbaek or Hald Ege rehabilitation institutions, depending on whether they live in East or West Denmark.39 Therefore, data from the Hornbaek center has
been used to estimate incidence of SCI in both Denmark and Greenland.
Table 6 displays the annual incidence of SCI per million, the male-to-female ratio, peak age, causation, and level of injury for these countries. There was an upward trend in the incidence of SCI in the United States from 29.1 per million in 1970 to 42.8 per million in 1977, with a peak incidence of 47.6 per million in 1977.38 In New Zealand and
Switzerland, there was also a steady increase in the inci-dence or number of cases (43.3 per million in 1979–1988 to 49 per million in 1988; 56 cases in 1960 to 81 in 1966, respectively).49,54 In Fiji, the incidence tripled from 5.6 per
million in 1986 to 17.9 per million in 1991.55 In contrast,
in Spain, there was a reduction in age-standardized inci-dence between 2000 and 2009.48 However, in comparison
to numbers estimated in the 1980s, there was a drastic increase from 8.0 per million in 1984–1985 to 23.5 per million between 2000 and 2009.56 In Romania, the number
of cases with SCI was relatively stable between 1981 and 1990 (233–270 new cases) but dropped significantly to 105 in 1991.47 There was no significant change in estimates in
Finland over three decades or in Iceland between 1980 and 1994.11,41 In Iceland between 2005 and 2009, however, the
Australia Japan
New-zealand Turkey
Fiji Estonia
Romania Finland Netherlands
Greenland
Denmark
Jordan Spain
South Africa Canada (Provinces)
Struck by object Falls Sports Violence Accidents (non-MVA) Work-related Alaska
41%
42%
Iceland 50%
39%
54% 43%
45% 49%
36%
Switzerland 59% 49%
56% 63%
California 51%
British columbia
49% Utah
58%
Mississippi 42%
Alabama 56%
Alberta
43%
Ontario 50%
36%
44%
62%
Traffic (MVA) Ireland
Oklahoma 49%
Manitoba
33%
47%
Other Suicide USA (States)
Europe Africa Asia Pacific Middle East
Region
Etiology
(X axis)
Y axis =% 52%
Figure 6 Causation of spinal cord injury in various countries.
Notes: A global map illustrating the causation of SCi between regions. The y-axis of the bar graphs indicates the percentage of contribution, while the x-axis categorizes the reported etiologies from highest to lowest from left to right (except for other causes, which is represented on the far right). Sports included diving. Violence included both gunshot and stab wounds resulting in SCI. Accidents represent all nontraffic accidents, including falling weight and crushing accidents.
Abbreviations: MVA, motor vehicle accidents; SCI, spinal cord injury.
Clinical Epidemiology downloaded from https://www.dovepress.com/ by 118.70.13.36 on 20-Aug-2020
Dovepress Singh et al
Table 6 incidence and causation of spinal cord injury in countries
Annual incidence (per million)
Male:female ratio
Peak age Causation Level of injury
United States of America (1970–1977)38
40.1 2.25:1 Overall: 15–24 (68.0/million) Not specified Not specified
Denmark (1975–1984)39 9.2 3.3:1 Overall: 15–24 (40%) Traffic: 47%
Falls: 26% Sports: 12% Suicide: 8% Struck by object: 3% Crushing accident: 2% violence: 2% Other: 1%
Cervical: 51% Thoracic: 28% Lumbar: 21%
Estonia (1997–2001)30 35.4 6:1 Males: 50–59 (∼32/million)
Females: 30–39 (∼15/million)
Falls: 36.5% Traffic: 30.3% Sports: 13.9% Other: 19.3%
Cervical: 60.5% Thoracic: 18.9% Lumbar: 20.6% Estonia (1997–2007)40 39.7 5.5:1 Males: 20–29 (133.9/million)
Females: 30–39 (18.3/million)
Falls: 41.0% Traffic: 29.4%
Cervical: 59.4% Thoracic: 18.3% Lumbar/sacral: 22.3%
Finland (1976–2005)41 13.8 4.5–5.1:1 Males: 16–34
Females: 16–34
Falls: 41.2% Traffic: 39.5% Diving: 6.6% violence: 2.7% Other: 10.0%
Not specified
France (2000)42 19.4 Not specified Not specified Not specified Not specified
Greenland (1965–1986)43 26 2.86:1 Not specified Falls: 33.3%
Suicide: 26% Accidental shot: 15% violence: 11% Struck by object: 7.4% Sports: 3.7% Traffic: 3.7%
Not specified
Iceland (1975–2009)11 22.6 2.6:1 Overall: #30 (43%) Traffic: 42.5%
Falls: 30.9% Sports: 19% Other: 8%
Cervical: 57% Thoracic/lumbar: 43%
Ireland (2000)44 13.1 6.7:1 Overall: 20–29 Traffic: 50%
Falls: 35% Sports: 9% Suicide: 2% work-related: 2% iatrogenic: 2%
Cervical: 50% Thoracic: 41% Lumbar: 9%
The Netherlands (1994)45 12.1 3.3:1 Overall: 21–30 (24.8%) Falls: 48.7%
Traffic: 31.0% Sports: 8.9% Occupational: 4.4% Other: 3.5% Unknown: 3.5%
Not specified
Norway (1974–1975)46 16.5 4.9:1 Overall: 20–40 (39%) Not specified Cervical: 53%
Thoracic: 26% Lumbar: 12%
Conus/cauda equina: 9%
Romania (1975–1993)47 28.5 3.35:1 Overall: 51–60 (21.4%) Falls: 59%
Traffic: 16% Falling weight: 10% Sports: 7% Other: 8%
Cervical: 57.2% Thoracic: 29.3% Lumbar: 13.0% Sacral: 0.4%
(Continued)
Clinical Epidemiology downloaded from https://www.dovepress.com/ by 118.70.13.36 on 20-Aug-2020
Dovepress Traumatic spinal cord injury
Table 6 (Continued)
Annual incidence (per million)
Male:female ratio
Peak age Causation Level of injury
Spain (1984–1985)56 8.0 Not specified
for traumatic cases alone
Not specified for traumatic cases alone
Traffic: 52% Falls: 27.5% Stroke: 6% Surgical: 4% Sports: 3% Projectile: 3% Others: 4.5%
Not specified for traumatic cases alone
Spain (2000–2009)48 23.5 Not specified Not specified Traffic: 35.5% Not specified
Switzerland (1960–1967)49 ∼15 ∼5:1 Overall: 20–29 (29%) Traffic: 36%
work: 35% Suicide: 9.67% Sports: 9.67% Other: 9.67%
Not specified
Turkey (1992)50 12.7 2.5:1 Overall: 20–29 (23/million) Traffic: 48.8%
Falls: 36.5% violence: 5.2% Sports: 1.2%
Cervical: 31.7% Thoracic: 26.6% Lumbar: 28.1%
Jordan (1988–1993)51 18 5.8:1 Overall: 21–30 (35.8%) Traffic: 44.4%
violence: 27.8% Falls: 21.2%
Struck by object: 3.3% Sports: 2.6% Suicide: 0.7%
Cervical: 31.8% Thoracic/lumbar: 68.2%
Japan (1990)52 39.4 4.3:1 Overall: 50–59 (21.2%) Traffic: 44.6%
Falls: 41%
Struck by object: 6.0% Sports: 5.3% Suicide: 1.7% Other: 1.4%
Cervical: 74.3% Thoracic or below: 25.5% Unknown: 0.2%
Australia (1998–1999)53 14.5 3.2:1 Males: 15–24 (∼38/million)
Females: 15–24 (∼16/million)
Traffic: 43% Falls: 31% Sports: 5%
Cervical: 57.7% Thoracic: 24.9% Lumbar: 16.6% Sacral: 0.75% New Zealand (1979–1988)54 49.1 Not specified Overall: 15–29 (104/million
in 1988); 96.7/million in 1979–1988
Traffic: 54% Falls: 24% Sports: 11% Machinery: 3% Exertion: 3% Struck by object: 2% violence: 2% Other: 2%
Cervical: 52.3% Thoracic: 25.2% Lumbar: 21.8% Sacral: 0.66%
Fiji (1985–1994)55 10.0 6.7:1 Males: 16–30
Females: 16–30
Falls: 38.7% Sports: 32% Traffic: 25.3% Other: 4%
Not specified for traumatic cases alone
incidence significantly increased to 33.5 per million from 21 per million in 2000–2004.11
The countries with the highest reported incidences were the United States (40.1 per million), Estonia (35.4 per million and 39.7 per million), Japan (39.4 per million), and New Zealand (49.1 per million).30,38,40,52,54 In Japan, there
is an increased prevalence of ossification of the posterior
longitudinal ligament (OPLL) in the elderly and congeni-tal stenosis.52 The population is therefore at an increased
risk of sustaining a SCI following a traumatic accident. In Estonia, it is speculated that the rates are higher because there is less regulation and enforcement of road safety rules, higher alcohol consumption, and a flatter landscape, enabling vehicles to drive at more dangerous speeds.30
Clinical Epidemiology downloaded from https://www.dovepress.com/ by 118.70.13.36 on 20-Aug-2020