Superheavy-element spectroscopy:
Correlations along element 115 decay
chains
D. Rudolph, U. Forsberg, L.G. Sarmiento, P. Golubev, and C. Fahlander
Department of Physics, Lund University, 22100 Lund, Sweden
Abstract
Following a brief summary of the region of the heaviest atomic nu-clei yet created in the laboratory, data on more than hundredα-decay chains associated with the production of element 115 are combined to investigate time and energy correlations along the observed decay chains. Several of these are analysed using a new method for statistical assessments of lifetimes in sets of decay chains.
1
Introduction
“More than 40 years ago, an island of stability of superheavy nuclei was predicted by nuclear structure theorists (see, e.g., Ref. [2]). This is-land rests on increased nuclear stability due to anticipated magic proton and neutron numbers at spherical nuclear shape (see, e.g., Ref. [3]), while surrounding archipelagos may also arise from increased nuclear binding of deformed atomic nuclei [4, 5]. Even today theoreticians face the challenge – or have the freedom – to extrapolate over several tens of mass units towards the island, based on quite reliable spectroscopic information in the region around nobelium and rutherfordium [6].
Along their way, experimentalists have not only been producing heavier and heavier atomic nuclei, but also added more and more chemical elements to the Periodic Table. Present-day research builds upon one-atom-at-a-time creation and observation. In this context, ‘time’ refers to typically a day, a week, or as much as several months – and it is at this tiny rate that detailed spectroscopic information needs to be obtained.
During the past 15 years, correlated α-decay chains have been observed in a number of experiments performed at the Flerov Laboratory of Nuclear Reactions (FLNR) in Dubna, Russia. Beams of 48Ca (Z = 20) impinged on actinide targets (Z = 92-98). The decay chains were interpreted to start from isotopes of elements Z = 112-118, produced via the mechanism of fusion-evaporation reactions [7, 8]. Theα-decays of nuclei with even proton number,Z, and even mass number, A, typically proceed from ground-state to ground-state. The decay energies along such decay chains are thus char-acteristic for a given decay step and can be used as a fingerprint for a given isotope of a certain element [9].
Decay patterns are usually much more complex forαdecays of odd-Aor especially odd-odd nuclei. Theirα decays usually proceed to excited states in the daughter nucleus [10]. On the one hand, decay into excited states hampersindirectmethods of determiningZ, not least because decay chains along the same isotopes may follow different decay paths depending on the starting point of a certain isotopic decay sequence. On the other hand, the possibility arises to observeX-ray photons in the course of electromag-netic internal conversion decays of the excited states in α-decay daughter nuclei [11]. X-ray energies are predicted with high precision even for the heaviest elements since long (see, e.g., Ref. [12]), and they are characteristic for a given proton, hence atomic, number [13]. In addition, high-resolution
Z
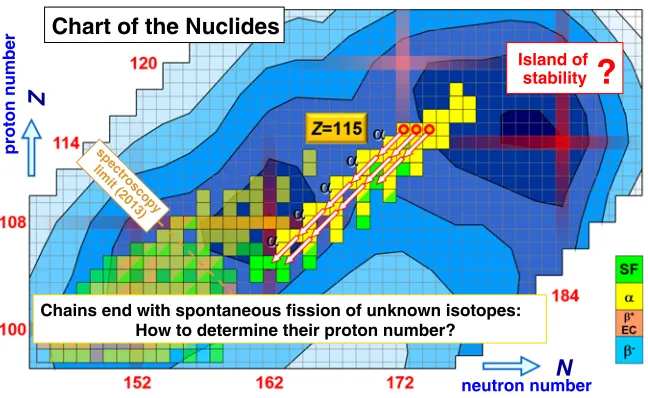
neutron numberN Island of stability
?
Chains end with spontaneous fission of unknown isotopes: How to determine their proton number?
proton number spectroscopy limit (2013)
Chart of the Nuclides
Figure 1: Upper end of the chart of atomic nuclei. Each square in this two-dimensional chart represents a certain isotope comprising Z protons and N neu-trons. Red lines denote possible ’magic numbers’. The combination ofZ=114 and N=184 is one of several long-standing predictions for the centre of the island of stability [2]. Bright shading indicates observed isotopes, with α-decay chains of element 115 indicated by diagonal arrows. The darker the blue background, the more stable the isotopes are predicted to be. A coarse ‘2013α-photon spectroscopy limit’ is indicated by a dashed orange line.
The status of the field is coarsely illustrated in fig. 1, and detailed from the point of view of theTascacollaboration1 in, for instance, Refs. [16, 17]. Independent confirmation of the production of elements up to Z = 117 has been achieved [18], months-long search experiments for elements 119 and 120 conducted, and gas-phase chemistry of flerovium, Z = 114, being tackled [19]. The subject of this article is an extended analysis of correlations of decay times and decay energies along element 115 decay chains.
2
Correlation analysis
Until now, experimental data on in total 113 α-decay chains associated with the direct production of isotopes of element 115 (placeholder name ununpentium, Uup) have been published [14, 20-23]. Following the first observation of four decay chains of element 115 at the Dubna gas-filled
1“TransActinide Separator and Chemistry Apparatus” at GSI Helmholtzzentrum f¨ur
recoil separator (DGFRS) [20], decay energies and correlation times from 37 element 115 “Dubna chains” are summarized in tables II, III, and IV of ref. [21]. More recently, high-resolutionα-photon coincidence data taken at the TASCA facility at GSI Darmstadt resulted in 30 element 115 “TASCA chains” (cf. supplemental material of ref. [14] and table I of ref. [22]), while a similar experiment conducted at the Berkeley gas-filled separator gave rise to additional 46 element 115 “Berkeley chains” (cf. supplemental material of ref. [23]) — and 37 + 30 + 46 = 113. The most relevant observables are decay energies, Ei, for a given decay step i along an α-decay chain, and correlation times between
• the implantation of a recoiling element 115 nucleus into a position sensitive silicon-detector arrangement and the firstα decay, Δt1, • betweennsubsequent α decays, Δti,i= 2, ..., n,
• and between the last correlatedαdecay and a spontanous fission (SF) event terminating the chain aftern α-decay steps, Δtn+1.
Note that decay energies, Ei, can involve summing related to α-particle emission and subsequent prompt emission of conversion electrons in caseα decay feeds excited states in the daughter nucleus, which can quickly decay into lower-lying states by electromagnetic decay processes [24].
Out of these in total 113 decay chains of directly produced evaporation residues (ER) of element 115, 4 + 7 + 3 = 14 chains are of type ER-α
(-α)-SF (n = 1,2), while the remaining 33 + 23 + 43 = 99 chains comprise five subsequent α decays (n = 5), before SF events conclude the chains after typically several hours [14, 21, 23]. Note that it until now has not been possible to experimentally decide whether or not these SF events are preceded by an electron capture (EC) decay.
Inspecting the correlation times and decay energies observed for each individual decay step and eventually applying statistical measures such as the “Schmidt test” [25] yields that these 99 n = 5 chains are consistent with two different decay sequences. See, for instance, ref. [15] for the latest numerical compilation. Folding the mean excitation energy of the compound nucleus291115 into the picture, 2+1+0 = 3 decay chains are associated with the production of287115, i.e. the 4-neutron (4n) evaporation channel, while the vast majority of 31 + 22 + 43 = 96 chains are considered to represent the production of288115 in the 3n-evaporation channel.
0.01 0.1 1 10.0
10.5
0.01 0.1 1 10
9.5 10.0
0.01 0.1 1
0.01 0.1 1 10
0.01 0.1 1
0.01 0.1 1 10
0.01 0.1 1 10
0.01 0.1 1 10
0.01 0.1 1 10
0.01 0.1 1 10
0.01 0.1 1 10
0.01 0.1 1 10
0.01 0.1 1 10
9.5 10.0
E
1 vs.'
t
1E
2vs.'
t
2vs.
'
t
4'
t
3vs.
'
t
3'
t
2E
4 vs.'
t
4vs.
'
t
2'
t
1Particle energy (MeV)
(a)
(c)
(e)
(b)
(d)
(f)
Correlation time (s)
Correlation time (s)
Correlation time (s)
Particle energy (MeV)
Particle energy (MeV)
Correlation time (s)
Correlation time (s)
Figure 2: Two-dimensional histograms of measured decay energies and correlation times of decay step 1 [panel (a)], decay step 2 [panel (c)], and decay step 4 [panel (e)] of in total 113α-decay chains associated with isotopes of element 115 [14, 21-23]. Filled black circles correspond to data from 96 five-α-decay long chains of
288115 and filled green squares to data from 3 five-α-decay long chains of 287115.
the first time in this superheavy regime,α-photon coincidence spectroscopy, give rise to first glimpses of solid experimental information for detailed nu-clear structure assessments of the heaviest atomic nuclei. This implies decay schemes including excited states, γ-ray decays, and α-decay hindrance fac-tors, to name but a few [14, 15, 23, 26].
Prior to more comprehensive statistical assessments of decay chains as a whole (cf. next section and ref. [22]), relations between correlation times and decay energies of a given decay step or two correlation times of, for instance, subsequent decay steps can be used to identify candidates for different en-sembles of decay chains. The six panels shown in fig. 2 are examples of such a graphical analysis.
The data points of the 96 chains associated with 288115, displayed as filled black circles in fig. 2, can be considered to form a reference for any of the other element 115 decay chains. For instance, due to the broad range of decay energies and similar correlation times – and, thus, half-lives, T1/2 [14, 15, 21, 23] – data for decay step 1 [panels (a) and (b)] does not allow to distuingish the three chains associated with287115, displayed as filled green squares, from the 288115 reference. However, a clear trend becomes visible in decay step 2 [panels (c) and (d)] due to somewhat higher decay energies as well as shorter correlation times. Finally, data associated with decay step 4 [panels (e) and (f)] allow for an apparent visual distinction, which can also be turned into a significant statistical distinction due to significantly higher decay energies and shorter correlation times. The statement is backed up by the fact that the three 287115 chains are observed at higher excitation energies of the compound nucleus291115, as mentioned earlier [14, 21].
While this situation for the long n = 5 element 115 decay chains is rather straightforward and undisputed, the interpretation of the remaining 14 “short chains” (0 + 2 + 2 = 4 ER-α-SF,n= 1, and 4 + 5 + 1 = 10 ER-α
-α-SF,n= 2) is less clear. Twelve of these chains are shown in fig. 2 as blue diamonds, while the chains denoted D3 and D4 (cf. table III in ref. [21]) are emphasized as red triangles and turquoise diamonds, respectively.
In fact, arguments based on reaction cross sections and compound nucleus excitation energies suggest that these short chains are shared about 50:50 between288115 and 289115 [22].
Two short chains deserve special attention. Chain D4 [21], represented by turquoise diamonds in fig. 2, is indistinguishable from the black circles and blue diamonds as far as decay step 1 is concerned [panels (a) and (b)]. However, the energy of decay step 2 [panel (c)] as well as the decay-time correlation between steps 2 and 3 [panel (d)] places this chain in the vicinity of the three long decay chains associated with287115 (green squares). A def-inite assignment to any of the isotopes of element 115 is not possible though. Finally, the decay characteristics reported for chain D3 [21], represented by red triangles in fig. 2(a)-(d), suggest that it has a different origin than any other of the 113 chains associated with element 115. The red triangles show up in the upper right corner of panels (b) and (d) and in the lower right corner of panel (c), This is due to three exceptionally long correlation times and one exceptionally low decay energy, i.e. due to four unusual out of five possible parameters, clearly indicating that this chain is distinct. It may form a second, independent decay sequence of289115 [17, 22].
3
Statistical assessments
However, this measure only applies to one decay step at the time. Hence, not all of the available information is considered. For example, a data set containing one exceptionally long correlation time in each step can be cor-rectly judged sound using the test, while there might still be reasons to question the assignment if the long correlation times all come from the very same chain. Therefore, we propose a generalisation of the test.
Assume thatmchains have been observed and that each chainicontains
ndecay steps. Letθij be the logarithm of thej:th lifetime in chaini. Then, the measure
ξm,n =
2
mi=1 n
Πnj=1(θij −θ¯j)2
m , θ¯j =
m
i=1θij
m (1)
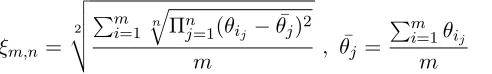
will take into account correlation times observed along decaychains rather than in single decay steps. By multiplying the deviations (θij−θ¯j)2with each other, all data on correlation times from one chain are considered jointly. Introducing the roots of order n allows for a further generalisation to be introduced later.
Figure 3 shows simulated distributions of ξm,n form = 14 and n= 1,2 and 3. Two million sets of correlation times have been randomly drawn from exponential PDFs. This measure, just like the one proposed by Schmidt, is independent from the half-life. When more decay stepsnare considered, the distributions of ξm,n get more narrow. Varying the number of chains
m modifies the shape as well, with larger sets of chains leading to more narrow distributions. For eachm andn the expectation value and the 90% confidence intervals can be tabulated. Some values are given in the left part of table 1.
Applying this generalised test to the short n = 1,2 chains associated with element 115 is unfortunately not straight forward due to the fact that the chains are of different length. This motivates a further generalisation of eq. 1, where the number of decays in chain iisni:
ξm,ni =
2
mi=1 ni
Πni
j=1(θij−θ¯j)2
m (2)
Table 1: Left: Expectation valuesξ, 90% confidence intervals (5% of the probabil-ity densprobabil-ity lies below “5%↓” and 5% lies above “↑”) ofξfor various values ofm,n, andl. The upper left part of the table relates toξm,n, i.e. sets where all chains have equally many decay steps. The lower left part refers toξm,n,l, where l chains end earlier. The right part presentsξm,ni values when the respective chain is excluded
from the data set. Those marked with * should be compared withξm=13,n=3,l=3, and the others withξm=13,n=3,l=4. See text for details.
m n l < ξ > 5%↓ 5%↑ Chain ξm,ni Chain ξm,ni
14 2 - 0.93 0.65 1.27 D1 1.34 C4 1.22
13 2 - 0.93 0.64 1.28 D2 1.34 C5 1.35
10 3 - 0.82 0.57 1.12 D3 1.03 C6 1.35
9 3 - 0.81 0.55 1.13 D4 1.33 C7 1.34
14 3 4 0.86 0.62 1.15 C1 1.36* B1 1.35
13 3 4 0.86 0.61 1.16 C2 1.34* B2 1.34*
13 3 3 0.85 0.61 1.15 C3 1.34 B3 1.18*
12 3 3 0.85 0.60 1.16
11 3 3 0.85 0.58 1.17
m,n,l [
/
m,n [
0.4 0.6 0.8 1.0 1.2 1.4 1.6
counts per bin
10 20 30 40 50
3
10
u
m=14, n=1
m=14, n=2
m=14, n=3
m=14, n=3, l=4
consider the case when l out of m chains have only two decays, while the rest are “complete” (ni =n= 3) with three decays. In fig. 3 the distribution of ξm,n,l is shown for m = 14, n = 3, andl = 4. Increasing l from zero to
m, the distribution gradually changes from the respective distributions from
ξm,n=3 toξm,n=2. Some relevant 90% confidence intervals are presented in
the left part of table 1.
For the complete set of m = 14 short chains the value of ξm,ni is 1.30 – well above the corresponding 90% confidence interval [0.62,1.15] obtained forξ14,3,4. Therefore, it is very unlikely that it is a mistake to conclude that not all chains originate from the same radioactive species. To investigate the data set more carefully, one chain at the time was excluded from the full set. The resulting values ofξm,ni are given in the first column in table 1 behind the respectiveexcludedchain. When interpreting the values, attention must be paid to the fact that l changes when a chain with only two decays is excluded. The values marked with * should thus be compared with the interval [0.61,1.15] (ξ13,3,3) and the others with [0.61,1.16] (ξ13,3,4). The
only way to reach the 90% confidence interval by excludingonly one chain is to exclude chain D3.
Excluding chains B3 or C4 also diminishesξm,ni somewhat, which draws the attention to those chains. If chains C4 and B3 are both excluded, the twelve remaining chains lead toξm,ni = 1.06. This is within the 90% confi-dence interval [0.60,1.16] forξ12,3,3. Hence the exclusion of thesetwo chains pose an alternative to excluding D3.
When excluding all three chains D3, C4 and B3 the value becomesξm,ni = 0.71. This is below the expectation value 0.85. Since it is within the corresponding interval [0.58,1.17], there is no strong argumentnotto exclude all of them. However, since smaller changes to the data set are sufficient to account for the 90% confidence interval, such trimming of the data cannot be motivated by only an analysis of the spread of correlation times.
4
Summary
Modern spectroscopy provide first glimpses of solid experimental informa-tion for detailed nuclear structure assessments of the heaviest atomic nuclei available today. Furthermore, the increasing number of decay chains asso-ciated with element 115 allows extended assessments of the data, which is relevant for assigning a given decay chain to a certain isotope (or isomer of an isotope). Such studies lead to possible EC or SF branches of otherwise long element 115 decay chains and/or parallel decay sequences starting from the same isotope. Ultimately, all these features have to find their explanation in the underlying nuclear structure of the heaviest elements.
Acknowledgements
NN2015 attendance and these Proceedings are supported by the Swedish Re-search Council and the Royal Physiographic Society in Lund. The assembly of TASISpec would have been impossible without generous grants from the Royal Physiographic Society in Lund and support from the Euroball Own-ers Committee. The GSI experiment on element 115 was supported by the European Community FP7 – Capacities ENSAR No. 262010.
References
[1] M. Sch¨adel, Phil. Trans. R. Soc. A373, 20140191 (2015). [2] S.G. Nilssonet al., Nucl. Phys.A131, 1 (1969).
[3] M. Bender, W. Nazarewicz, and P.-G. Reinhard, Phys. Lett.B515, 42 (2001). [4] S. ´Cwiok, P.H. Heenen, and W. Nazarewicz, Nature433, 705 (2005).
[5] J. Dvoraket al., Phys. Rev. Lett.97, 242501 (2006).
[6] R.-D. Herzberg and P.T. Greenlees, Prog. Part. Nucl. Phys.61, 674 (2008). [7] Y.T. Oganessian, J. Phys. G34, R165 (2007); Radiochim. Acta99, 429 (2011). [8] Y.T. Oganessianet al., Phys. Rev. C87, 054621 (2013).
[9] R.C. Barberet al., Pure Appl. Chem.83(7), 1485 (2011).
[10] G.T. Seaborg and W.D. Loveland, The Elements Beyond Uranium (Wiley-Interscience, New York, 1990).
[11] C.E. Bemis, Jr.et al., Phys. Rev. Lett.31, 647 (1973).
[12] T.A. Carlssonet al., Nucl. Phys.A135, 57 (1969); At. Data Nucl. Data Ta-bles19, 153 (1977).
[13] H.G.J. Moseley, Phil. Mag.26, 1024 (1913).
[14] D. Rudolphet al., Phys. Rev. Lett.111, 112502 (2013).
[16] Ch.E. D¨ullmann, Proc.5thInternational Conference on Fission and Properties
of Neutron-Rich Nuclei, 2012, Sanibel Island, Florida, Eds. J.H. Hamilton and
A.V. Ramayya, World Scientific, Singapore (2013), p. 271. [17] D. Rudolphet al., JPS Conf. Proc.6, 010026 (2015).
[18] J. Khuyagbaataret al., Phys. Rev. Lett.112, 172501 (2014). [19] A. Yakushevet al., Inorg. Chem. 53, 1624 (2014).
[20] Yu. Ts. Oganessianet al., Phys. Rev. C69, 021601(R) (2004). [21] Yu. Ts. Oganessianet al., Phys. Rev. C87, 014302 (2013). [22] U. Forsberget al., submitted to Nucl. Phys. A;
http://arxiv.org/abs/1502.03030.
[23] J.M. Gateset al., Phys. Rev. C92, 021301(R) (2015).
[24] F.P. Heßbergeret al., Nucl. Instrum. Meth. A274, 522 (1989). [25] K.-H. Schmidt, Eur. Phys. J. A8, 141 (2000).
![Figure 2: Two-dimensional histograms of measured decay energies and correlationtimes of decay step 1 [panel (a)], decay step 2 [panel (c)], and decay step 4 [panelThe chains denoted D3 and D4 (cf](https://thumb-us.123doks.com/thumbv2/123dok_us/8161244.1361642/5.482.61.394.54.494/figure-dimensional-histograms-measured-energies-correlationtimes-panelthe-denoted.webp)