Full-Density Fused Deposition Modeling
Dimensional Error as a Function of Raster Angle and
Build Orientation: Large Dataset for Eleven Materials
Sherri L. Messimer1, Tais Rocha Pereira1,2, Albert E. Patterson1,3,∗ , Maliha Lubna1, and Fabiano O. Drozda2
1 Department of Industrial & Systems Engineering and Engineering Management, University of Alabama in Huntsville, Technology Hall N143, 300 Sparkman Drive, Huntsville, Alabama, 35899, USA:
[email protected] (T.R.P.); [email protected] (M.L.); [email protected] (S.L.M.)
2 Department of Production Engineering, Federal University of Paraná, Rue XV de Novembro, 1299-Centro,
Curitiba 80060-000, Brazil; [email protected]
3 Department of Industrial and Enterprise Systems Engineering, University of Illinois at Urbana-Champaign,
117 Transportation Building, 104 South Mathews Avenue, Urbana, IL 61801, USA * Correspondence: [email protected]; Tel.: +1-217-333-2731
Abstract:This report describes the collection of a large dataset (6930 measurement) on dimensional error in the fused deposition modeling (FDM) additive manufacturing process for full-density parts. Three different print orientations were studied, as well as seven raster angles (0◦, 15◦, 30◦, 45◦, 60◦, 75◦, and 90◦) for the rectilinear infill pattern. All measurements were replicated ten times on ten different samples to ensure a comprehensive dataset. Eleven polymer materials were considered: acrylonitrile butadiene styrene (ABS), polylactic acid (PLA), high-temperature PLA, wood-composite PLA, carbon-fiber-composite PLA, copper-composite PLA, aluminum-composite PLA, high-impact polystyrene (HIPS), polyethylene terephthalate glycol-enhanced (PETG), polycarbonate, and synthetic polyamide (nylon). The samples were ASTM-standard impact testing samples, since this geometry allows the measurement of error on three different scales; the nominal dimensions were 3.25mmthick, 63.5mmlong, and 12.7mmwide. This dataset is intended to give engineers and product designers a benchmark for judging the accuracy and repeatability of the FDM process for use in manufacturing of end-user products.
Dataset:Attached with manuscript
Dataset License:CC-BY
Keywords: Additive manufacturing; fused deposition modeling; FDM; dimensional accuracy; manufacturing process repeatability; polymer testing
1. Summary
As additive manufacturing (AM) technologies becomes more widely used for manufacturing, it is increasingly necessary to consider their impact on engineering design methods. In contrast with more traditional subtractive and formative processes, AM produces geometry by depositing the raw material in layers and fusing those layers together using some mechanism (typically heat or chemical reaction) [1–3]. There are a wide variety of processes available, divided roughly into seven families [2,3] based on the state of the raw material, the method of producing layers, and the method of layer fusion. There are many benefits to using AM processes in manufacturing of end-user parts, including the ability to produce extremely complex geometry directly from digital models [4,5] and the freedom from formal tooling requirements [6,7]. Various AM methods can process a wide variety of polymer, metal, and ceramic materials; some hybrid processes have recently emerged [8–12] which can use more than one class of material in the same part and process.
However, there are some limitations and problems that need to be considered and addressed when using AM, dimensional accuracy [13,14], process and geometric repeatability [15–17], and material defects [18–20] being the primary considerations. While all of these are important to examine, the most important from the perspective of engineering design are the dimensional accuracy and repeatability of the final parts. It has been observed that most of the problems with the dimensional accuracy in AM are due to the material behavior [13,21–23] and to the limitations and mechanics of the processing equipment [24–26]. Since most AM processes involve heating the material past the glass transition temperature, shrinkage of the material is a concern; this shrinkage can both destroy the dimensional integrity of the part and introduce residual stresses, potentially reducing the material fatigue life as well. Vibration and mechanical compliance are the primary sources of error from the processing equipment, but the effects of this vary significantly from process-to-process.
One of the most common and important AM processes for processing polymer and polymer-composite materials is the extrusion-based Fused Deposition Modeling (FDM) process. Originally developed primarily as a simple prototyping process, it has seen much development in recent years and has become suited for manufacturing of end-user products in some industries. FDM works by selectively extruding a bead or molten or near-molten material to build up the part in layers (Figure1). The raw material is put into the machine in the form of a filament, the layering is done via the deposition from the extruder, and the fusion is done by chemical reaction as the deposited material cools onto the previous layer [27–32].
Figure 1. Fused deposition modeling (FDM) (a) process diagram, (b) work-flow, and (c) extruder carriage example [27]
study. The actual optimization of this parameter has not yet been explored in-depth in the literature, but is something that should be examined further in future work.
It was observed that a dimensional error as low as 0.15% could be accomplished for FDM with the correct settings [13,33–40], but this is highly dependent on the size of the samples in question; smaller samples showed a much higher error. In terms of raw dimensional error, most studies showed the capability to build parts with an error under 200µmregardless of the specimen size. While most studies reported the error as a percentage of the sample dimensions, it is clear from the data presented that the error is related more to the raw dimensions, and so different sample sizes will show different percentage errors for the same material and parameters.
To further study the aspects of FDM dimensional accuracy and repeatability, a large dataset of observed dimensional errors for various materials and printing parameters was collected using a large number of relatively simple identical parts; the summary, major considerations, and the collection procedure are discussed in the proceedings sections. This dataset is intended to assist designers and process engineers in evaluating the feasibility of FDM as an end-product manufacturing process. Interpretation of the data was not part of this study, as this work focused on collecting useful data which can be used to guide the solutions to a wide variety of design and manufacturing problems. A number of factors were considered for their influence on the two main variables for a large number of materials, so this dataset can be used to study correlations between the parameters, the material properties, and accuracy/repeatability of FDM. Each datapoint was repeated ten times, so reliable values of the sample mean and variance can be found easily, allowing the calculation of probability distributions for sections of the dataset. This data will also be useful as a training input for finite element analyses, for optimization algorithms, and for machining learning processes that evaluate FDM.
2. Data Description
2.1. Overview and Experiment Considerations
Previous FDM dimensional accuracy studies and design approaches [13,27–40] have mainly focused on establishing the dimensional integrity of complex features; these are very useful studies for predicting the accuracy relative to process parameters and for one-off complex parts. However, as FDM begins to be a viable option for end-product manufacturing, a large dataset derived from relatively simple specimens is needed, one that can be used for statistical analysis in order to determine the expected accuracy and repeatability over a large number of parts. Such a dataset could be especially useful in the establishment of tolerance constraints on parts during design, as well as finding correlations between the basic process parameters and the accuracy/repeatability. A subset of the possible process parameters can be considered (the exact values of these parameters are given in Section3) most important for the study presented in this report:
• Print Orientation: Print orientations corresponding to the three Cartesian axes were used • Density: All parts were printed full-density (100% infill) for all materials; all gaps in the
mesostructure were set to zero in the processing gcode for the samples. • Infill pattern: A standard rectilinear infill pattern was used
• Print velocity: Printing velocity was set at a standard value, unless a lower setting was necessitated by material behavior
• Jerk: The print jerk was fixed at the same value for all specimens and materials
• Processing temperatures: Appropriate extruder and build plate temperatures were used for each of the materials
• Enclosure: Some materials that were sensitive to warping, emitted odors, or were sensitive to humidity were printed inside of an enclosure, while the rest were printed on a standard open-bed machine in a conditioned environment
• Layer resolution: All samples for all materials used the same layer resolution
• Bed interface: All samples were printed using rafts on heated glass or polycarbonate build plates, as appropriate for the material
• Experimental environment: All samples were manufactured and tested in a climate-controlled environment at least 40 hours before measuring, as recommended by several ASTM standards for testing polymeric materials
Even though eleven different materials were used in this study, the difference in material was not considered to be an experimental factor; different materials required different printing parameters and had different reactions on cooling after the processing. Some materials were very stable and some were not; the difference between materials in this was obvious in the collected data, as presented later in this paper. With this in mind, it difficult to justify considering material choice as a factor and therefore, each material is considered to be a separate experiment with the same variables. In each case, the raster angle (due to the rectilinear print pattern; see Figure2) and print orientation were considered as the variables, while all other parameters were fixed. The fixed parameters varied somewhat between materials due to the optimal printing parameters needed for each material. Only open-source raw material and processing equipment built and calibrated by the authors were used for this study in order to be able to take the maximum amount of control during processing. All print nozzles, relevant belts and bearings, and printer firmware were updated or replaced before making the samples to ensure that these things did not introduce unnecessary error into the specimens; the purpose of this was to isolate the observed error sources to material behavior and process mechanics.
Figure 2. Rectilinear infill pattern for (a) a single layer, (b) multiple layers, and (c) observed in a manufactured sample at a raster angle of 30◦and 100% density
While varying the raster angle is an effective way to study the influence of the infill on the dimensional accuracy, the influence of the part shell needs to be studied by varying the print orientation. There are three basic potential sources of error from the shell, namely the build direction, the distance from the build plate, and the ratio of the shell to infill for each layer. In FDM, all the layers are deposited parallel to the build plate, with the shell being the first and most vital section of the part slice to be deposited, so the percentage of each layer that is shell should have a large influence on accuracy. Similarly, the distance from the build plate affects the heat distribution in the part, as a taller part will be warmer on the bottom during processing than the top. This heat differential can introduce residual stresses and cause cracks and warping in the shell.
Table 1.Materials, composition, and source
Material Composition Filament Source/Brand
1 ABS Acrylonitrile butadiene styrene Hatchbox ABS
2 PLA Polylactic acid Hatchbox PLA
3 HTPLA High-temperature PLA MakerGeeks Raptor PLA
4 HIPS High-impact polystyrene Monoprice premium natural
5 Nylon Synthetic polyamide eSUN ePA
6 PETG Polyethylene terephthalate glycol-enhanced Inland white
7 PC Polycarbonate eSUN black PC
8 APLA PLA + 40% aluminum powder SainSmart aluminum
9 CPLA PLA + 5% copper powder GizmoDorks copper
10 WPLA PLA + 30%wood fiber Hatchbox wood
11 CFPLA PLA + 15% chopped carbon fibers 3DSolutech carbon fiber
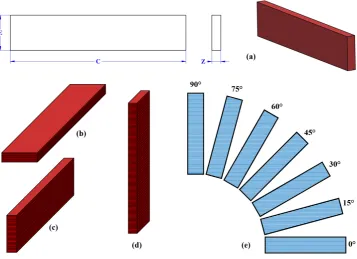
Eleven materials were studied, as shown in Table1. The sample design was that of the standard specimen for ASTM polymer impact testing [41]; this was chosen so that three different dimension scales of the same type of “feature” could be studied for each case to give a better understanding of the dimensional error observed. As a secondary consideration, this design was selected so that the samples could be re-used for other studies after testing and not wasted; they were not damaged during measurement, so they were suited for re-use. The specimen geometry is shown in Figure3a below, where the nominal dimensions are:
Z=3.25mm, C=63.5mm, E=12.7mm
The three print orientations selected were flat (Figure3b), horizontal (Figure3c), and vertical (Figure3d). Two shells were used for each part, with a an infill percentage of each layer for the flat case estimated to be approximately 95%, while the infill percentages of the horizontal and vertical cases were found to be about 80% and 50%, respectively. Also for each material, a 90-degree sweep of raster angles in 15 degree increments was defined for the infill (Figure3e). With the seven raster angles and three orientations, 21 unique combinations were produced. The decision was made to test each material case ten times to ensure a comprehensive dataset. This involved manufacturing and measuring 210 separate samples for each material, for a total of 2310 specimens and 6930 measurements. As with the parameter values, the measurement technique and assumptions are discussed in Section3.
2.2. Calculation and Data Presentation
Figure 3.Specimen configurations: (a) standard geometry, (b) flat printing orientation, (c) horizontal printing orientation, (d) vertical printing orientation, and (e) raster angles
of each combination for each material, the three dimensions were measured and the dataset was summarized into four basic measures (Tables 2-12):
1. Sample meanµ: The average observed value of the dimension(samplesizen=10)
2. Nominal error|δ|: The difference between the mean observed value and the nominal value 3. Standard errorSE: Standard error based on the sample size and the standard deviation 4. Mean percent errorMPE: Mean percent error of the dataset
Each of these measures assesses an important aspect about the dimensional accuracy of the samples. The full (raw) dataset is attached with this manuscript and can be viewed by the reader on demand. For each combination of print orientation and raster angle, the nominal error was defined as the absolute value of the difference between the mean and the nominal value such that
|δ|=|Xnom−µ| (1)
whereXnomis the nominal value andµis the mean of thensample values. Next, the standard error was calculated as
SE=S/√n (2)
whereSis the standard deviation of the sample measurements andnis the number of measurements. Finally, the mean percent error was calculated as
MPE= 100% n
n
∑
t=1 at−ft
where at is the observed value and ft is the nominal dimension. After the set of measures were
taken for each combination, a “combined” error measurement was take for all three of the measured dimensions such that:
|∆|= q
|δZ|2+|δC|2+|δE|2 (4)
The purpose of the nominal error (|δ|) calculation was to find the deviation of the mean observed value from the nominal value; note that it is an absolute value and is only a measure of themagnitude of the error. The standard error (SE) measured the deviation from the sample mean and described the spread of the data, related to the observed values and not to the nominal values. Finally, the mean percent error (MPE) was a measure of the average deviation from the nominal value on the level of each sample in the set; note that it is directional, noting both positive and negative errors.
Each of the materials under study are presented in the preceding sections, each consisting of three parts: a color image showing the 21 samples for one replication of the experiment, a set of plots showing|δ|andMPEfor each of the dimensional measurements, and a table summarizing the statistical measures described above.
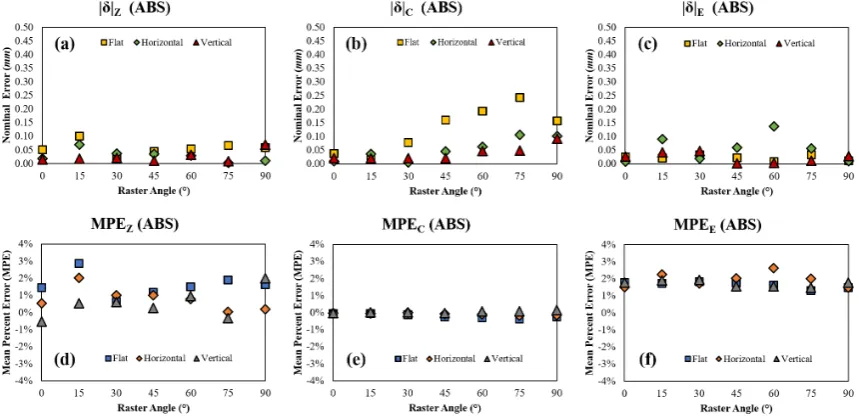
2.3. Acrylonitrile Butadiene Styrene (ABS)
Figure 4.ABS specimen set for one replication of measurements
Table 2.Mean,|δ|, SE, MPE, and|∆|for ABS as a function of print orientation and raster angle
Material: ABS (all dimensions inmmunless otherwise specified)
PO Angle Z (n=10) C (n=10) E (n=10) |∆|
µ |δ| SE MPE µ |δ| SE MPE µ |δ| SE MPE
F 0◦ 3.30 0.05 0.034 1.45% 63.46 0.04 0.024 -0.06% 12.73 0.03 0.014 1.77% 0.07
F 15◦ 3.35 0.10 0.040 2.86% 63.48 0.02 0.065 -0.03% 12.72 0.02 0.015 1.74% 0.10
F 30◦ 3.28 0.03 0.043 0.64% 63.42 0.08 0.029 -0.12% 12.73 0.03 0.018 1.83% 0.09
F 45◦ 3.29 0.04 0.042 1.19% 63.34 0.16 0.033 -0.25% 12.72 0.02 0.013 1.75% 0.17
F 60◦ 3.30 0.05 0.040 1.50% 63.31 0.19 0.033 -0.31% 12.71 0.01 0.023 1.63% 0.20
F 75◦ 3.32 0.07 0.040 1.89% 63.26 0.24 0.047 -0.38% 12.67 0.03 0.026 1.31% 0.25
F 90◦ 3.31 0.06 0.043 1.64% 63.34 0.16 0.038 -0.25% 12.69 0.01 0.013 1.48% 0.17
H 0◦ 3.27 0.02 0.015 0.53% 63.49 0.01 0.015 -0.02% 12.69 0.01 0.018 1.50% 0.02
H 15◦ 3.32 0.07 0.027 2.02% 63.46 0.04 0.014 -0.06% 12.79 0.09 0.024 2.26% 0.12
H 30◦ 3.29 0.04 0.036 1.02% 63.50 0.00 0.014 -0.01% 12.72 0.02 0.015 1.73% 0.04
H 45◦ 3.29 0.04 0.031 1.01% 63.45 0.05 0.015 -0.07% 12.76 0.06 0.021 2.04% 0.08
H 60◦ 3.28 0.03 0.033 0.79% 63.44 0.06 0.012 -0.10% 12.84 0.14 0.026 2.63% 0.15
H 75◦ 3.25 0.00 0.024 0.04% 63.39 0.11 0.015 -0.17% 12.76 0.06 0.015 2.01% 0.12
H 90◦ 3.26 0.01 0.038 0.19% 63.40 0.10 0.030 -0.16% 12.69 0.01 0.033 1.49% 0.10
V 0◦ 3.24 0.01 0.026 -0.52% 63.48 0.02 0.042 -0.03% 12.73 0.03 0.013 1.78% 0.04
V 15◦ 3.27 0.02 0.023 0.54% 63.52 0.02 0.028 0.03% 12.74 0.04 0.015 1.91% 0.05
V 30◦ 3.27 0.02 0.016 0.62% 63.52 0.02 0.037 0.03% 12.75 0.05 0.011 1.94% 0.06
V 45◦ 3.26 0.01 0.019 0.28% 63.48 0.02 0.029 -0.03% 12.70 0.00 0.018 1.56% 0.02
V 60◦ 3.28 0.03 0.022 0.96% 63.55 0.05 0.049 0.07% 12.70 0.00 0.014 1.55% 0.06
V 75◦ 3.24 0.01 0.023 -0.32% 63.55 0.05 0.054 0.08% 12.69 0.01 0.018 1.49% 0.05
V 90◦ 3.32 0.07 0.030 2.01% 63.59 0.09 0.044 0.15% 12.73 0.03 0.009 1.79% 0.12
2.4. Polylactic Acid (PLA)
Figure 7.PLA (a) nominal error inZ, (b) nominal error inC, (c) nominal error inE, (d) mean percent error inZ, (e) mean percent error inC, and (f) mean percent error inEwith respect to raster angle and orientation
Table 3.Mean,|δ|, SE, MPE, and|∆|for PLA as a function of print orientation and raster angle
Material: PLA (all dimensions inmmunless otherwise specified)
PO Angle Z (n=10) C (n=10) E (n=10) |∆|
µ |δ| SE MPE µ |δ| SE MPE µ |δ| SE MPE
F 0◦ 3.33 0.08 0.044 2.10% 63.43 0.07 0.014 -0.11% 12.74 0.04 0.019 1.87% 0.11
F 15◦ 3.30 0.05 0.045 1.20% 63.40 0.10 0.017 -0.17% 12.71 0.01 0.028 1.62% 0.11
F 30◦ 3.32 0.07 0.052 1.98% 63.51 0.01 0.012 0.01% 12.71 0.01 0.016 1.62% 0.07
F 45◦ 3.34 0.09 0.043 2.58% 63.50 0.00 0.011 0.00% 12.67 0.03 0.019 1.37% 0.09
F 60◦ 3.37 0.12 0.043 3.54% 63.60 0.10 0.031 0.16% 12.65 0.05 0.026 1.16% 0.17
F 75◦ 3.35 0.10 0.033 2.93% 63.64 0.14 0.020 0.22% 12.69 0.01 0.027 1.50% 0.17
F 90◦ 3.35 0.10 0.041 2.91% 63.72 0.22 0.021 0.34% 12.70 0.00 0.017 1.57% 0.24
H 0◦ 3.25 0.00 0.032 0.01% 63.45 0.05 0.020 -0.07% 12.73 0.03 0.031 1.80% 0.06
H 15◦ 3.31 0.06 0.039 1.60% 63.47 0.04 0.022 -0.06% 12.80 0.10 0.054 2.33% 0.12
H 30◦ 3.26 0.01 0.025 0.31% 63.50 0.00 0.012 -0.01% 12.76 0.06 0.039 2.02% 0.06
H 45◦ 3.28 0.03 0.025 0.74% 63.63 0.13 0.027 0.20% 12.65 0.05 0.063 1.13% 0.14
H 60◦ 3.23 0.02 0.020 -0.65% 63.56 0.06 0.028 0.10% 12.77 0.07 0.019 2.10% 0.09
H 75◦ 3.26 0.01 0.010 0.27% 63.76 0.26 0.055 0.40% 12.74 0.04 0.023 1.89% 0.26
H 90◦ 3.25 0.00 0.018 0.00% 63.73 0.23 0.059 0.37% 12.70 0.00 0.025 1.59% 0.23
V 0◦ 3.29 0.04 0.032 1.20% 63.85 0.35 0.024 0.55% 12.77 0.07 0.028 2.08% 0.36
V 15◦ 3.28 0.03 0.023 0.93% 63.73 0.23 0.050 0.36% 12.78 0.08 0.039 2.17% 0.25
V 30◦ 3.27 0.02 0.020 0.55% 63.85 0.35 0.024 0.54% 12.75 0.05 0.019 1.93% 0.35
V 45◦ 3.25 0.00 0.021 -0.13% 63.75 0.25 0.053 0.39% 12.81 0.11 0.032 2.42% 0.27
V 60◦ 3.27 0.02 0.027 0.58% 63.74 0.24 0.051 0.37% 12.76 0.06 0.030 2.02% 0.25
V 75◦ 3.28 0.03 0.020 0.85% 63.81 0.31 0.025 0.48% 12.80 0.10 0.032 2.32% 0.33
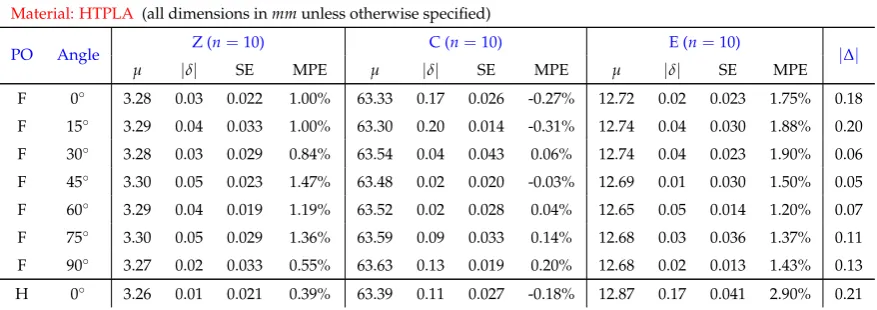
2.5. High-Temperature PLA (HTPLA)
Figure 8.HTPLA specimen set for one replication of measurements
Figure 9.HTPLA (a) nominal error inZ, (b) nominal error inC, (c) nominal error inE, (d) mean percent error inZ, (e) mean percent error inC, and (f) mean percent error inEwith respect to raster angle and orientation
Table 4.Mean,|δ|, SE, MPE, and|∆|for HTPLA as a function of print orientation and raster angle
Material: HTPLA (all dimensions inmmunless otherwise specified)
PO Angle Z (n=10) C (n=10) E (n=10) |∆|
µ |δ| SE MPE µ |δ| SE MPE µ |δ| SE MPE
F 0◦ 3.28 0.03 0.022 1.00% 63.33 0.17 0.026 -0.27% 12.72 0.02 0.023 1.75% 0.18
F 15◦ 3.29 0.04 0.033 1.00% 63.30 0.20 0.014 -0.31% 12.74 0.04 0.030 1.88% 0.20
F 30◦ 3.28 0.03 0.029 0.84% 63.54 0.04 0.043 0.06% 12.74 0.04 0.023 1.90% 0.06
F 45◦ 3.30 0.05 0.023 1.47% 63.48 0.02 0.020 -0.03% 12.69 0.01 0.030 1.50% 0.05
F 60◦ 3.29 0.04 0.019 1.19% 63.52 0.02 0.028 0.04% 12.65 0.05 0.014 1.20% 0.07
F 75◦ 3.30 0.05 0.029 1.36% 63.59 0.09 0.033 0.14% 12.68 0.03 0.036 1.37% 0.11
F 90◦ 3.27 0.02 0.033 0.55% 63.63 0.13 0.019 0.20% 12.68 0.02 0.013 1.43% 0.13
H 15◦ 3.28 0.03 0.018 0.80% 63.44 0.06 0.024 -0.10% 12.89 0.19 0.027 3.01% 0.20
H 30◦ 3.27 0.02 0.007 0.52% 63.44 0.06 0.019 -0.09% 12.84 0.14 0.040 2.62% 0.15
H 45◦ 3.24 0.01 0.010 -0.44% 63.53 0.03 0.011 0.04% 12.86 0.16 0.036 2.78% 0.16
H 60◦ 3.24 0.01 0.012 -0.26% 63.55 0.05 0.022 0.07% 12.85 0.15 0.025 2.69% 0.15
H 75◦ 3.25 0.00 0.024 -0.17% 63.64 0.14 0.022 0.22% 12.84 0.14 0.023 2.67% 0.20
H 90◦ 3.25 0.00 0.013 -0.11% 63.64 0.14 0.033 0.21% 12.84 0.14 0.037 2.66% 0.20
V 0◦ 3.29 0.04 0.019 1.03% 63.71 0.20 0.077 0.32% 12.69 0.01 0.019 1.50% 0.21
V 15◦ 3.26 0.01 0.009 0.24% 63.76 0.26 0.036 0.41% 12.68 0.02 0.011 1.40% 0.26
V 30◦ 3.24 0.01 0.010 -0.29% 63.74 0.24 0.082 0.38% 12.71 0.01 0.006 1.64% 0.24
V 45◦ 3.27 0.02 0.012 0.54% 63.82 0.32 0.038 0.51% 12.73 0.03 0.016 1.78% 0.32
V 60◦ 3.23 0.02 0.012 -0.57% 63.80 0.30 0.061 0.47% 12.70 0.00 0.018 1.55% 0.30
V 75◦ 3.21 0.04 0.014 -1.17% 63.71 0.21 0.075 0.32% 12.70 0.00 0.013 1.57% 0.21
V 90◦ 3.24 0.01 0.006 -0.44% 63.74 0.24 0.047 0.38% 12.71 0.01 0.006 1.63% 0.24
2.6. High-Impact Polystyrene (HIPS)
Figure 10.HIPS (a) nominal error inZ, (b) nominal error inC, (c) nominal error inE, (d) mean percent error inZ, (e) mean percent error inC, and (f) mean percent error inEwith respect to raster angle and orientation
Table 5.Mean,|δ|, SE, MPE, and|∆|for HIPS as a function of print orientation and raster angle
Material: HIPS(all dimensions inmmunless otherwise specified)
PO Angle Z (n=10) C (n=10) E (n=10) |∆|
µ |δ| SE MPE µ |δ| SE MPE µ |δ| SE MPE
F 0◦ 3.23 0.02 0.034 -0.78% 63.42 0.08 0.030 -0.12% 12.78 0.08 0.050 2.19% 0.11
F 15◦ 3.23 0.02 0.026 -0.77% 63.42 0.09 0.027 -0.13% 12.82 0.12 0.048 2.45% 0.15
F 30◦ 3.19 0.06 0.020 -1.79% 63.48 0.02 0.035 -0.03% 12.81 0.11 0.041 2.38% 0.12
F 45◦ 3.22 0.04 0.022 -1.13% 63.42 0.08 0.030 -0.13% 12.78 0.08 0.041 2.19% 0.12
F 60◦ 3.22 0.03 0.028 -0.94% 63.40 0.10 0.031 -0.15% 12.76 0.06 0.040 2.03% 0.12
F 75◦ 3.22 0.03 0.035 -1.13% 63.34 0.16 0.032 -0.26% 12.79 0.09 0.049 2.22% 0.19
F 90◦ 3.17 0.08 0.026 -2.68% 63.44 0.06 0.027 -0.09% 12.76 0.06 0.055 2.01% 0.12
H 0◦ 3.25 0.00 0.011 -0.07% 63.49 0.02 0.023 -0.02% 12.68 0.02 0.028 1.41% 0.03
H 15◦ 3.26 0.01 0.016 0.38% 63.48 0.02 0.020 -0.04% 12.67 0.03 0.016 1.35% 0.04
H 30◦ 3.25 0.00 0.008 0.06% 63.53 0.03 0.015 0.05% 12.72 0.02 0.020 1.70% 0.04
H 45◦ 3.23 0.02 0.013 -0.63% 63.48 0.02 0.016 -0.04% 12.70 0.00 0.028 1.54% 0.03
H 60◦ 3.24 0.01 0.007 -0.44% 63.46 0.04 0.016 -0.06% 12.72 0.02 0.026 1.75% 0.05
H 75◦ 3.25 0.00 0.010 0.08% 63.49 0.01 0.024 -0.02% 12.70 0.00 0.024 1.60% 0.01
H 90◦ 3.24 0.01 0.009 -0.25% 63.51 0.01 0.012 0.01% 12.70 0.00 0.018 1.57% 0.01
V 0◦ 3.21 0.04 0.011 -1.26% 63.34 0.16 0.043 -0.25% 12.72 0.02 0.016 1.70% 0.16
V 15◦ 3.25 0.00 0.008 -0.04% 63.35 0.15 0.045 -0.24% 12.77 0.07 0.023 2.09% 0.17
V 30◦ 3.23 0.02 0.009 -0.53% 63.34 0.16 0.039 -0.25% 12.72 0.02 0.017 1.75% 0.16
V 45◦ 3.27 0.02 0.006 0.49% 63.36 0.14 0.036 -0.22% 12.73 0.03 0.012 1.83% 0.15
V 60◦ 3.28 0.03 0.009 0.94% 63.33 0.17 0.030 -0.27% 12.78 0.08 0.020 2.15% 0.19
V 75◦ 3.30 0.05 0.015 1.59% 63.31 0.19 0.028 -0.30% 12.75 0.05 0.024 1.94% 0.20
V 90◦ 3.28 0.03 0.014 0.87% 63.35 0.15 0.045 -0.24% 12.74 0.04 0.014 1.91% 0.16
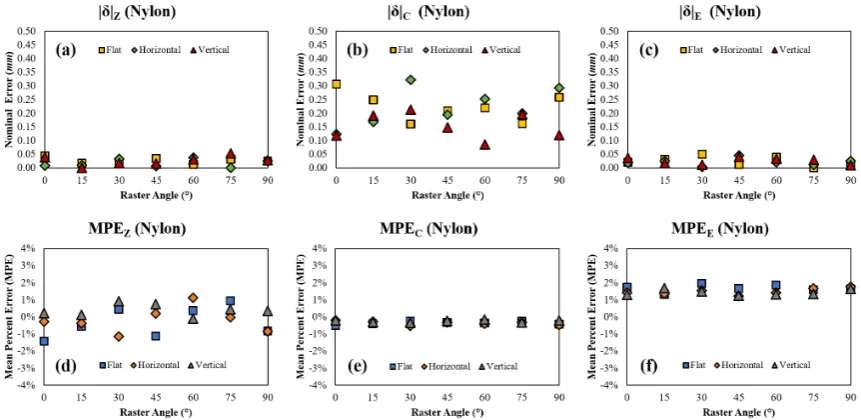
2.7. Synthetic Polyamide (Nylon)
Figure 13.Nylon (a) nominal error inZ, (b) nominal error inC, (c) nominal error inE, (d) mean percent error inZ, (e) mean percent error inC, and (f) mean percent error inEwith respect to raster angle and orientation
Table 6.Mean,|δ|, SE, MPE, and|∆|for nylon as a function of print orientation and raster angle
Material: Nylon(all dimensions inmmunless otherwise specified)
PO Angle Z (n=10) C (n=10) E (n=10) |∆|
µ |δ| SE MPE µ |δ| SE MPE µ |δ| SE MPE
F 0◦ 3.21 0.04 0.020 -1.41% 63.19 0.31 0.105 -0.49% 12.72 0.02 0.028 1.73% 0.31
F 15◦ 3.23 0.02 0.018 -0.55% 63.25 0.25 0.100 -0.40% 12.67 0.03 0.031 1.33% 0.25
F 30◦ 3.27 0.01 0.016 0.44% 63.34 0.16 0.086 -0.25% 12.75 0.05 0.028 1.96% 0.17
F 45◦ 3.22 0.04 0.016 -1.11% 63.29 0.21 0.102 -0.33% 12.71 0.01 0.024 1.67% 0.21
F 60◦ 3.26 0.01 0.014 0.38% 63.28 0.22 0.121 -0.35% 12.74 0.04 0.032 1.87% 0.22
F 75◦ 3.28 0.03 0.016 0.95% 63.34 0.16 0.114 -0.26% 12.70 0.00 0.016 1.58% 0.17
F 90◦ 3.22 0.03 0.015 -0.83% 63.24 0.26 0.103 -0.41% 12.71 0.01 0.038 1.64% 0.26
H 0◦ 3.24 0.01 0.021 -0.28% 63.38 0.12 0.110 -0.20% 12.68 0.02 0.018 1.43% 0.13
H 15◦ 3.24 0.01 0.025 -0.36% 63.33 0.17 0.093 -0.27% 12.67 0.03 0.022 1.37% 0.17
H 30◦ 3.22 0.03 0.031 -1.14% 63.18 0.32 0.095 -0.51% 12.70 0.00 0.009 1.55% 0.32
H 45◦ 3.26 0.01 0.017 0.19% 63.31 0.20 0.100 -0.31% 12.66 0.05 0.021 1.22% 0.20
H 60◦ 3.29 0.04 0.022 1.12% 63.25 0.25 0.111 -0.40% 12.68 0.02 0.018 1.41% 0.26
H 75◦ 3.25 0.00 0.018 -0.03% 63.30 0.20 0.093 -0.32% 12.71 0.01 0.016 1.66% 0.20
H 90◦ 3.22 0.03 0.024 -0.86% 63.21 0.29 0.092 -0.47% 12.73 0.03 0.013 1.77% 0.30
V 0◦ 3.26 0.01 0.019 0.21% 63.38 0.12 0.061 -0.19% 12.66 0.04 0.012 1.29% 0.12
V 15◦ 3.25 0.00 0.010 0.12% 63.31 0.19 0.045 -0.30% 12.72 0.02 0.034 1.70% 0.19
V 30◦ 3.28 0.03 0.013 0.93% 63.29 0.21 0.063 -0.34% 12.69 0.01 0.028 1.49% 0.22
V 45◦ 3.28 0.02 0.014 0.75% 63.35 0.15 0.073 -0.23% 12.66 0.04 0.013 1.26% 0.16
V 60◦ 3.25 0.00 0.009 -0.10% 63.41 0.09 0.054 -0.14% 12.67 0.03 0.025 1.31% 0.09
V 75◦ 3.27 0.01 0.005 0.46% 63.30 0.20 0.055 -0.31% 12.67 0.03 0.014 1.34% 0.20
2.8. Polyethylene Terephthalate Glycol-Enhanced (PETG)
Figure 14.PETG specimen set for one replication of measurements
Figure 15.PETG (a) nominal error inZ, (b) nominal error inC, (c) nominal error inE, (d) mean percent error inZ, (e) mean percent error inC, and (f) mean percent error inEwith respect to raster angle and orientation
Table 7.Mean,|δ|, SE, MPE, and|∆|for PETG as a function of print orientation and raster angle
Material: PETG (all dimensions inmmunless otherwise specified)
PO Angle Z (n=10) C (n=10) E (n=10) |∆|
µ |δ| SE MPE µ |δ| SE MPE µ |δ| SE MPE
F 0◦ 3.21 0.04 0.023 -1.26% 63.45 0.05 0.042 -0.08% 12.70 0.00 0.015 1.54% 0.07
F 15◦ 3.21 0.04 0.020 -1.22% 63.49 0.01 0.013 -0.01% 12.72 0.02 0.015 1.69% 0.04
F 30◦ 3.26 0.01 0.006 0.18% 63.45 0.05 0.044 -0.08% 12.71 0.01 0.018 1.61% 0.05
F 45◦ 3.24 0.01 0.014 -0.26% 63.41 0.09 0.034 -0.14% 12.65 0.05 0.019 1.19% 0.10
F 60◦ 3.27 0.02 0.010 0.51% 63.29 0.21 0.036 -0.34% 12.68 0.02 0.013 1.45% 0.21
F 75◦ 3.25 0.00 0.009 0.05% 63.25 0.25 0.046 -0.40% 12.71 0.01 0.026 1.66% 0.25
F 90◦ 3.28 0.02 0.017 0.74% 63.22 0.28 0.069 -0.44% 12.69 0.01 0.012 1.48% 0.28
H 15◦ 3.24 0.01 0.013 -0.29% 63.52 0.02 0.024 0.03% 12.69 0.01 0.018 1.51% 0.02
H 30◦ 3.24 0.01 0.013 -0.48% 63.53 0.03 0.029 0.05% 12.73 0.03 0.020 1.83% 0.05
H 45◦ 3.23 0.02 0.009 -0.72% 63.49 0.01 0.015 -0.01% 12.70 0.00 0.029 1.54% 0.03
H 60◦ 3.24 0.01 0.010 -0.38% 63.43 0.07 0.034 -0.11% 12.73 0.03 0.015 1.81% 0.08
H 75◦ 3.23 0.02 0.011 -0.72% 63.44 0.06 0.056 -0.10% 12.73 0.03 0.028 1.81% 0.08
H 90◦ 3.23 0.02 0.008 -0.56% 63.45 0.05 0.053 -0.08% 12.70 0.00 0.010 1.58% 0.05
V 0◦ 3.24 0.01 0.010 -0.32% 63.77 0.27 0.031 0.42% 12.70 0.00 0.019 1.55% 0.27
V 15◦ 3.23 0.02 0.006 -0.59% 63.76 0.26 0.040 0.41% 12.70 0.00 0.019 1.57% 0.26
V 30◦ 3.21 0.04 0.013 -1.26% 63.80 0.30 0.042 0.47% 12.68 0.02 0.021 1.43% 0.31
V 45◦ 3.21 0.04 0.011 -1.38% 63.81 0.31 0.045 0.49% 12.67 0.03 0.015 1.36% 0.32
V 60◦ 3.20 0.05 0.007 -1.50% 63.81 0.31 0.051 0.48% 12.69 0.01 0.014 1.53% 0.31
V 75◦ 3.22 0.03 0.015 -0.95% 63.79 0.29 0.027 0.45% 12.71 0.01 0.010 1.64% 0.29
V 90◦ 3.22 0.04 0.017 -1.11% 63.82 0.31 0.019 0.49% 12.72 0.02 0.024 1.71% 0.32
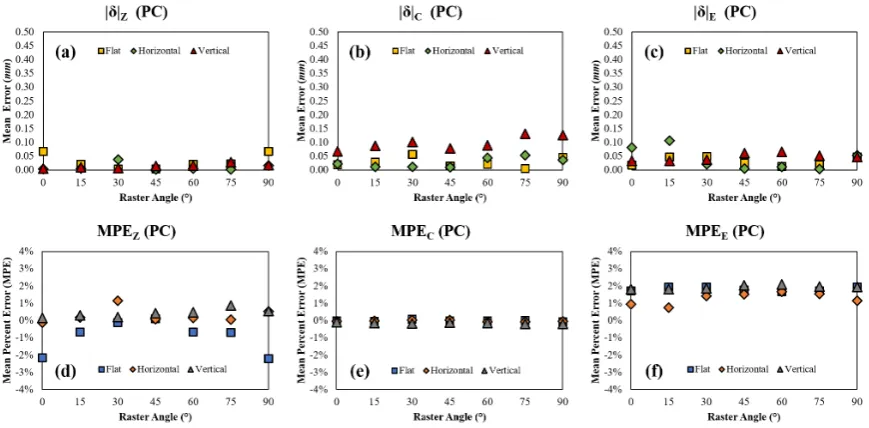
2.9. Polycarbonate (PC)
Figure 16.PC specimen set for one replication of measurements
Table 8.Mean,|δ|, SE, MPE, and|∆|for PC as a function of print orientation and raster angle
Material: PC (all dimensions inmmunless otherwise specified)
PO Angle Z (n=10) C (n=10) E (n=10) |∆|
µ |δ| SE MPE µ |δ| SE MPE µ |δ| SE MPE
F 0◦ 3.18 0.07 0.017 -2.16% 63.48 0.02 0.031 -0.03% 12.72 0.02 0.016 1.71% 0.07
F 15◦ 3.23 0.02 0.009 -0.66% 63.47 0.03 0.023 -0.04% 12.75 0.05 0.017 1.94% 0.06
F 30◦ 3.25 0.00 0.010 -0.13% 63.56 0.06 0.034 0.09% 12.75 0.05 0.021 1.95% 0.08
F 45◦ 3.25 0.00 0.010 0.11% 63.49 0.01 0.030 -0.02% 12.73 0.03 0.013 1.77% 0.03
F 60◦ 3.23 0.02 0.012 -0.66% 63.48 0.02 0.034 -0.03% 12.71 0.01 0.010 1.67% 0.03
F 75◦ 3.23 0.02 0.014 -0.70% 63.49 0.01 0.014 -0.01% 12.72 0.02 0.019 1.73% 0.03
F 90◦ 3.18 0.07 0.029 -2.22% 63.45 0.05 0.027 -0.07% 12.75 0.05 0.016 1.94% 0.10
H 0◦ 3.25 0.00 0.004 -0.12% 63.48 0.02 0.015 -0.04% 12.62 0.08 0.031 0.94% 0.08
H 15◦ 3.26 0.01 0.009 0.18% 63.49 0.01 0.014 -0.02% 12.59 0.11 0.030 0.74% 0.11
H 30◦ 3.29 0.04 0.014 1.14% 63.51 0.01 0.013 0.02% 12.68 0.02 0.022 1.41% 0.05
H 45◦ 3.25 0.00 0.007 0.09% 63.51 0.01 0.015 0.02% 12.69 0.01 0.018 1.53% 0.01
H 60◦ 3.26 0.01 0.009 0.15% 63.46 0.04 0.029 -0.07% 12.71 0.01 0.014 1.67% 0.05
H 75◦ 3.25 0.00 0.008 0.06% 63.45 0.05 0.024 -0.08% 12.70 0.00 0.016 1.54% 0.05
H 90◦ 3.27 0.02 0.008 0.51% 63.46 0.04 0.024 -0.06% 12.65 0.05 0.029 1.15% 0.07
V 0◦ 3.26 0.01 0.010 0.15% 63.43 0.07 0.029 -0.11% 12.73 0.03 0.006 1.83% 0.08
V 15◦ 3.26 0.01 0.006 0.30% 63.41 0.09 0.022 -0.14% 12.73 0.03 0.008 1.83% 0.09
V 30◦ 3.26 0.01 0.004 0.21% 63.40 0.10 0.014 -0.16% 12.74 0.04 0.012 1.87% 0.11
V 45◦ 3.26 0.01 0.011 0.42% 63.42 0.08 0.027 -0.12% 12.76 0.06 0.015 2.04% 0.10
V 60◦ 3.27 0.02 0.008 0.49% 63.41 0.09 0.017 -0.14% 12.77 0.07 0.013 2.08% 0.11
V 75◦ 3.28 0.03 0.012 0.87% 63.37 0.13 0.032 -0.21% 12.75 0.05 0.013 1.98% 0.14
V 90◦ 3.27 0.02 0.006 0.55% 63.37 0.13 0.028 -0.20% 12.75 0.05 0.009 1.94% 0.14
2.10. Aluminum-Composite PLA (APLA)
Figure 19.APLA (a) nominal error inZ, (b) nominal error inC, (c) nominal error inE, (d) mean percent error inZ, (e) mean percent error inC, and (f) mean percent error inEwith respect to raster angle and orientation
Table 9.Mean,|δ|, SE, MPE, and|∆|for APLA as a function of print orientation and raster angle
Material: APLA (all dimensions inmmunless otherwise specified)
PO Angle Z (n=10) C (n=10) E (n=10) |∆|
µ |δ| SE MPE µ |δ| SE MPE µ |δ| SE MPE
F 0◦ 3.25 0.00 0.021 -0.07% 63.27 0.23 0.034 -0.37% 12.70 0.00 0.019 1.55% 0.23
F 15◦ 3.26 0.01 0.023 0.23% 63.30 0.20 0.031 -0.32% 12.71 0.01 0.028 1.62% 0.20
F 30◦ 3.30 0.05 0.047 1.37% 63.34 0.16 0.027 -0.25% 12.68 0.02 0.025 1.45% 0.17
F 45◦ 3.28 0.03 0.023 0.96% 63.48 0.02 0.034 -0.03% 12.64 0.06 0.029 1.10% 0.07
F 60◦ 3.29 0.04 0.032 0.98% 63.56 0.06 0.034 0.09% 12.66 0.04 0.032 1.25% 0.08
F 75◦ 3.30 0.05 0.031 1.43% 63.56 0.06 0.019 0.09% 12.66 0.04 0.029 1.23% 0.09
F 90◦ 3.27 0.02 0.023 0.48% 63.62 0.12 0.039 0.19% 12.66 0.04 0.030 1.23% 0.13
H 0◦ 3.25 0.00 0.013 0.05% 63.41 0.09 0.021 -0.14% 12.72 0.02 0.020 1.74% 0.09
H 15◦ 3.26 0.01 0.013 0.38% 63.43 0.07 0.013 -0.11% 12.73 0.03 0.020 1.78% 0.08
H 30◦ 3.26 0.01 0.013 0.32% 63.51 0.01 0.016 0.01% 12.75 0.05 0.026 1.94% 0.05
H 45◦ 3.21 0.04 0.018 -1.37% 63.55 0.05 0.017 0.08% 12.75 0.05 0.035 1.92% 0.08
H 60◦ 3.22 0.03 0.022 -1.04% 63.64 0.14 0.022 0.22% 12.73 0.03 0.018 1.78% 0.14
H 75◦ 3.24 0.01 0.016 -0.36% 63.67 0.17 0.029 0.26% 12.76 0.06 0.030 2.01% 0.18
H 90◦ 3.24 0.01 0.027 -0.46% 63.77 0.27 0.022 0.42% 12.72 0.02 0.025 1.76% 0.27
V 0◦ 3.28 0.03 0.016 0.98% 63.83 0.33 0.032 0.51% 12.69 0.01 0.024 1.49% 0.33
V 15◦ 3.30 0.05 0.032 1.34% 63.82 0.32 0.062 0.50% 12.74 0.04 0.036 1.90% 0.33
V 30◦ 3.26 0.01 0.020 0.33% 63.79 0.29 0.040 0.45% 12.70 0.00 0.027 1.59% 0.29
V 45◦ 3.26 0.01 0.022 0.29% 63.80 0.30 0.041 0.47% 12.75 0.05 0.028 1.98% 0.30
V 60◦ 3.26 0.01 0.019 0.40% 63.68 0.18 0.097 0.29% 12.71 0.01 0.036 1.61% 0.18
V 75◦ 3.26 0.01 0.022 0.26% 63.72 0.22 0.083 0.35% 12.76 0.06 0.030 2.03% 0.23
2.11. Copper-Composite PLA (CPLA)
Figure 20.CPLA specimen set for one replication of measurements
Figure 21.CPLA (a) nominal error inZ, (b) nominal error inC, (c) nominal error inE, (d) mean percent error inZ, (e) mean percent error inC, and (f) mean percent error inEwith respect to raster angle and orientation
Table 10.Mean,|δ|, SE, MPE, and|∆|for CPLA as a function of print orientation and raster angle
Material: CPLA(all dimensions inmmunless otherwise specified)
PO Angle Z (n=10) C (n=10) E (n=10) |∆|
µ |δ| SE MPE µ |δ| SE MPE µ |δ| SE MPE
F 0◦ 3.26 0.01 0.006 0.37% 63.35 0.15 0.024 -0.24% 12.71 0.01 0.018 1.64% 0.15
F 15◦ 3.26 0.01 0.006 0.21% 63.26 0.24 0.017 -0.37% 12.67 0.03 0.015 1.34% 0.24
F 30◦ 3.25 0.00 0.013 -0.14% 63.45 0.05 0.016 -0.08% 12.67 0.03 0.014 1.35% 0.06
F 45◦ 3.25 0.00 0.010 0.08% 63.52 0.02 0.009 0.03% 12.60 0.10 0.017 0.82% 0.10
F 60◦ 3.26 0.01 0.009 0.30% 63.56 0.06 0.010 0.09% 12.62 0.08 0.011 0.97% 0.10
F 75◦ 3.26 0.01 0.008 0.27% 63.60 0.10 0.016 0.16% 12.62 0.08 0.011 0.96% 0.13
F 90◦ 3.25 0.00 0.007 0.03% 63.68 0.17 0.021 0.27% 12.68 0.03 0.016 1.38% 0.18
H 15◦ 3.22 0.04 0.010 -1.10% 63.33 0.17 0.022 -0.27% 12.80 0.10 0.011 2.31% 0.20
H 30◦ 3.20 0.05 0.010 -1.70% 63.47 0.03 0.020 -0.04% 12.78 0.08 0.015 2.15% 0.10
H 45◦ 3.19 0.06 0.007 -1.85% 63.60 0.10 0.027 0.15% 12.73 0.03 0.008 1.80% 0.12
H 60◦ 3.18 0.07 0.010 -2.08% 63.60 0.10 0.024 0.15% 12.76 0.06 0.008 2.03% 0.13
H 75◦ 3.16 0.09 0.007 -2.88% 63.63 0.13 0.025 0.21% 12.76 0.06 0.011 2.03% 0.17
H 90◦ 3.26 0.01 0.008 0.27% 63.65 0.15 0.023 0.24% 12.74 0.04 0.012 1.91% 0.16
V 0◦ 3.27 0.02 0.010 0.72% 63.72 0.22 0.023 0.35% 12.67 0.03 0.010 1.31% 0.23
V 15◦ 3.25 0.00 0.004 0.06% 63.74 0.24 0.022 0.38% 12.69 0.01 0.013 1.48% 0.24
V 30◦ 3.25 0.00 0.007 0.00% 63.67 0.17 0.024 0.26% 12.71 0.01 0.007 1.68% 0.17
V 45◦ 3.27 0.02 0.005 0.49% 63.71 0.21 0.017 0.33% 12.64 0.06 0.014 1.12% 0.22
V 60◦ 3.28 0.03 0.030 0.81% 63.67 0.17 0.020 0.26% 12.70 0.00 0.012 1.54% 0.17
V 75◦ 3.26 0.01 0.006 0.24% 63.65 0.15 0.024 0.23% 12.69 0.01 0.015 1.52% 0.15
V 90◦ 3.25 0.00 0.008 -0.07% 63.68 0.18 0.013 0.28% 12.73 0.03 0.009 1.81% 0.18
2.12. Wood-Composite PLA (WPLA)
Figure 22.WPLA specimen set for one replication of measurements
Table 11.Mean,|δ|, SE, MPE, and|∆|for WPLA as a function of print orientation and raster angle
Material: WPLA (all dimensions inmmunless otherwise specified)
PO Angle Z (n=10) C (n=10) E (n=10) |∆|
µ |δ| SE MPE µ |δ| SE MPE µ |δ| SE MPE
F 0◦ 3.29 0.04 0.014 1.08% 63.53 0.03 0.007 0.05% 12.82 0.12 0.016 2.47% 0.13
F 15◦ 3.26 0.01 0.009 0.36% 63.48 0.02 0.030 -0.03% 12.77 0.07 0.034 2.09% 0.07
F 30◦ 3.26 0.01 0.009 0.36% 63.62 0.12 0.017 0.19% 12.79 0.09 0.020 2.25% 0.15
F 45◦ 3.25 0.00 0.015 0.01% 63.55 0.05 0.022 0.08% 12.73 0.03 0.014 1.78% 0.06
F 60◦ 3.28 0.03 0.010 1.00% 63.64 0.14 0.020 0.22% 12.74 0.04 0.017 1.87% 0.15
F 75◦ 3.27 0.02 0.012 0.66% 63.77 0.27 0.021 0.42% 12.73 0.03 0.016 1.79% 0.27
F 90◦ 3.28 0.03 0.014 0.90% 63.81 0.31 0.018 0.48% 12.72 0.02 0.010 1.71% 0.31
H 0◦ 3.30 0.04 0.013 1.35% 63.36 0.14 0.052 -0.22% 12.70 0.00 0.021 1.58% 0.14
H 15◦ 3.36 0.11 0.014 3.20% 63.51 0.01 0.043 0.01% 12.70 0.00 0.022 1.56% 0.11
H 30◦ 3.30 0.04 0.010 1.36% 63.53 0.03 0.025 0.05% 12.71 0.01 0.028 1.65% 0.06
H 45◦ 3.31 0.06 0.013 1.80% 63.66 0.16 0.034 0.25% 12.74 0.04 0.025 1.85% 0.17
H 60◦ 3.25 0.00 0.015 -0.11% 63.63 0.13 0.049 0.20% 12.71 0.01 0.017 1.67% 0.13
H 75◦ 3.28 0.03 0.012 0.78% 63.70 0.20 0.041 0.32% 12.72 0.02 0.017 1.71% 0.20
H 90◦ 3.28 0.03 0.013 0.96% 63.67 0.17 0.028 0.26% 12.71 0.01 0.019 1.66% 0.17
V 0◦ 3.24 0.01 0.008 -0.22% 63.71 0.21 0.021 0.33% 12.63 0.07 0.014 0.99% 0.22
V 15◦ 3.23 0.02 0.011 -0.75% 63.75 0.25 0.025 0.40% 12.68 0.02 0.015 1.39% 0.26
V 30◦ 3.23 0.02 0.019 -0.53% 63.76 0.26 0.020 0.41% 12.70 0.00 0.019 1.57% 0.26
V 45◦ 3.22 0.03 0.008 -1.00% 63.75 0.25 0.015 0.39% 12.73 0.03 0.018 1.79% 0.25
V 60◦ 3.21 0.04 0.013 -1.32% 63.73 0.23 0.020 0.36% 12.65 0.05 0.018 1.20% 0.24
V 75◦ 3.21 0.04 0.010 -1.32% 63.79 0.29 0.025 0.45% 12.69 0.01 0.014 1.47% 0.29
V 90◦ 3.21 0.04 0.017 -1.34% 63.72 0.22 0.015 0.35% 12.74 0.04 0.017 1.91% 0.23
2.13. Carbon-Fiber-Composite PLA (CFPLA)
Figure 25. CFPLA (a) nominal error inZ, (b) nominal error inC, (c) nominal error inE, (d) mean percent error inZ, (e) mean percent error inC, and (f) mean percent error inEwith respect to raster angle and orientation
Table 12.Mean,|δ|, SE, MPE, and|∆|for CFPLA as a function of print orientation and raster angle
Material: CFPLA (all dimensions inmmunless otherwise specified)
PO Angle Z (n=10) C (n=10) E (n=10) |∆|
µ |δ| SE MPE µ |δ| SE MPE µ |δ| SE MPE
F 0◦ 3.24 0.01 0.019 -0.37% 63.29 0.21 0.035 -0.33% 12.71 0.01 0.016 1.67% 0.21
F 15◦ 3.25 0.00 0.022 -0.01% 63.38 0.13 0.028 -0.20% 12.72 0.02 0.024 1.72% 0.13
F 30◦ 3.26 0.01 0.019 0.19% 63.36 0.14 0.033 -0.22% 12.68 0.02 0.035 1.42% 0.14
F 45◦ 3.24 0.01 0.020 -0.47% 63.44 0.06 0.022 -0.09% 12.67 0.03 0.044 1.29% 0.07
F 60◦ 3.29 0.04 0.025 1.04% 63.53 0.03 0.033 0.05% 12.68 0.02 0.027 1.44% 0.05
F 75◦ 3.29 0.04 0.025 1.22% 63.62 0.12 0.020 0.19% 12.68 0.02 0.020 1.45% 0.13
F 90◦ 3.27 0.02 0.028 0.61% 63.65 0.15 0.025 0.23% 12.68 0.02 0.021 1.42% 0.15
H 0◦ 3.25 0.00 0.015 0.04% 63.41 0.09 0.032 -0.14% 12.83 0.13 0.035 2.54% 0.15
H 15◦ 3.25 0.00 0.011 0.02% 63.39 0.11 0.030 -0.17% 12.82 0.12 0.031 2.51% 0.16
H 30◦ 3.24 0.01 0.007 -0.19% 63.50 0.01 0.025 -0.01% 12.84 0.14 0.025 2.62% 0.14
H 45◦ 3.21 0.04 0.008 -1.22% 63.52 0.02 0.048 0.03% 12.81 0.11 0.031 2.41% 0.12
H 60◦ 3.21 0.04 0.012 -1.23% 63.56 0.06 0.045 0.09% 12.79 0.09 0.026 2.23% 0.11
H 75◦ 3.22 0.03 0.008 -1.00% 63.55 0.05 0.048 0.07% 12.78 0.08 0.028 2.17% 0.10
H 90◦ 3.20 0.05 0.007 -1.57% 63.66 0.16 0.042 0.25% 12.81 0.11 0.030 2.45% 0.20
V 0◦ 3.25 0.00 0.017 -0.03% 63.75 0.25 0.053 0.39% 12.67 0.03 0.018 1.35% 0.25
V 15◦ 3.22 0.03 0.008 -0.81% 63.73 0.23 0.040 0.36% 12.66 0.04 0.021 1.28% 0.23
V 30◦ 3.28 0.03 0.023 0.84% 63.64 0.14 0.088 0.22% 12.62 0.08 0.019 0.96% 0.16
V 45◦ 3.21 0.04 0.011 -1.38% 63.75 0.25 0.037 0.39% 12.69 0.01 0.019 1.50% 0.25
V 60◦ 3.23 0.02 0.016 -0.73% 63.75 0.25 0.039 0.40% 12.66 0.04 0.024 1.28% 0.26
V 75◦ 3.24 0.01 0.020 -0.44% 63.72 0.21 0.052 0.34% 12.70 0.00 0.013 1.54% 0.22
3. Methods
3.1. Choice of Materials
The set of materials chosen for this study is given in Table1in Section2. This is not an exhaustive set of materials that can be processed using FDM, but these are the most common "hard" polymer materials used. Note that all materials used were available open-source and were not proprietary blends; this was done to ensure that the composition of the material was known and that manufacturer infill and additives were not used. Two other materials were examined during initial setup of the experiment (polyvinyl alcohol (PVA), thermoplastic polyurethane (TPU)) but these were found to be too soft and flexible after printing to accurately be measured. Each of the materials in the set were chosen specifically, the main reasons being:
• ABSandPLA: These are the most common FDM materials and therefore were the first two selected
• HTPLA: Standard PLA is quite sensitive to printing temperature and can be strengthened by printing at a higher temperature. However, standard PLA begins to burn and break down at a relatively low temperature above its melting point. Recently, high-temperature versions of the material have been in development; this has not been characterized in the literature yet, but the material appears to be about 20% tougher than standard PLA. It was selected because this authors believe it will become more widely used.
• HIPS: HIPS is a common construction material when molded; its primary use in AM is in the printing of support material. However, the authors have successfully used it as a standard AM material and it appears to have properties similar to ABS but with much less tenancy to shrink and warp on cooling. It is a useful, if not common, material for FDM and was therefore included in the set.
• Nylon, PETG, andPC: These are becoming very common FDM materials, overtaking ABS and PLA for some applications. There are stronger and generally more stable for many uses, particularly those involving fracture and fatigue. They are standard materials that should be included in every large dataset for this reason.
• Composite PLAs: As the use of PLA expands, particularly in green production and medical devices, ways to improve its properties have been a topic of much recent research. There are a large number of composite PLAs available, and a subset of four that have different types of composite infill were selected for testing. The authors were particularly interested in metal-powder PLA (5% (CPLA) and 40% (APLA)), in soft material infill (WPLA), and in chopped fiber infill (CFPLA) cases.
3.2. Setup and Printing Parameters
The printing parameters for each of the materials are shown in Table13below. The authors are very experienced using all of these materials and so used standard print settings for these materials. The settings recommended by the filament manufacturers were used at first and these adjusted to produce the best combination of part quality and print speed. Note that these settings were developed over hundreds of parts for each material, so they are known to work well and produce the best possible results for each material used. The samples were printed in batches (Figure X) to ensure that the minimal residual error possible was present and that all significant error observed came from material behavior and the mechanical behavior of the printers.
the materials. The pre-processing software used was Utlimaker Cura for the open-bed printer and an open-source version of XYZWare Pro for the DaVinci printer; both allowed complete control of the printing parameters shown in Table13. All layer thicknesses were set at 200µmfor all samples; appropriate filament retraction settings were used to both avoid messy extruder and to avoid gaps and voids in the part infill. Rafts were used as well to ensure that the printing surface itself did not introduce error into the measurements. The Prusa-frame machine used a heated aluminum-polycarbonate build plate [27] and the DaVinci machine used a heated aluminum-glass build plate as a base. Tests were run on both printers before making the samples to ensure that the extruders and build plates were producing the correct temperatures; both a type-K thermocouple reader and a infrared thermometer were used.
Table 13.Specimen manufacturing parameters
Material Velocity (mm/s) Jerk (mm/s) Textruder(◦C) Tprintbed(◦C) Nozzle Type Environment
ABS 50 8 225 90 0.4mmBrass Enclosed
PLA 60 8 200 50 0.4mmSteel Open
HTPLA 60 8 245 50 0.4mmSteel Open
HIPS 60 8 240 90 0.4mmBrass Enclosed
Nylon 50 8 250 70 0.4mmBrass Enclosed
PETG 60 8 240 80 0.4mmSteel Open
PC 30 8 260 90 0.4mmBrass Enclosed
APLA 60 8 200 50 0.4mmSteel Open
CPLA 60 8 205 50 0.4mmSteel Open
WPLA 60 8 210 50 0.4mmSteel Open
CFPLA 40 8 200 50 0. 4mmSteel Open
3.3. Data Collection
Since the purpose of this study was to collect a large dataset on the overall dimensional accuracy and repeatability for FDM, the measurement of complex features and surface roughness were not needed. Therefore, the measurement process was very simple: all measurements were made using a set of good quality vernier calipers with a resolution of 1/100mm, as shown in Figure27below.
Figure 27.Vernier calipers for measurement (a) tared before using, (b) measuringZ, (c) measuringC, and (d) measuringE
All samples were checked before measurement and any clearly defective samples discarded from the set. These defects were very rare, however, with only seven defective (and replaced) specimens observed from a population of over 2000 samples.
Supplementary Materials:Please fill in after posting the dataset with the manuscript
Author Contributions:TRP, AEP, and SLM conceived the idea for the dataset, TRP and AEP collected the data, ML, AEP, and FOD helped to organize and interpret the data and do the basic statistical analysis, FOD and SLM provided supervision and advice on the project, TRP and AEP manufactured the specimens, and SLM provided raw materials. All authors assisted with writing and revising the manuscript. Author order was agreed by all authors prior to manuscript submission.
Funding:This work received no external funding
Conflicts of Interest:The authors declare no conflict of interest. No external funding was used to perform the work described in this study. Opinions and conclusions presented in this work are solely those of the authors.
References
1. Gibson, I.; Rosen, D.; Stucker, B.Additive Manufacturing Technologies: 3D Printing, Rapid Prototyping, and Direct Digital Manufacturing; Springer, 2016.
2. Guo, N.; Leu, M.C. Additive manufacturing: technology, applications and research needs.Frontiers of Mechanical Engineering2013,8, 215–243. doi:10.1007/s11465-013-0248-8.
4. Yang, S.; Zhao, Y.F. Additive manufacturing-enabled design theory and methodology: a critical review. The International Journal of Advanced Manufacturing Technology2015,80, 327–342.
doi:10.1007/s00170-015-6994-5.
5. Yang, S.; Tang, Y.; Zhao, Y.F. A new part consolidation method to embrace the design freedom of additive manufacturing. Journal of Manufacturing Processes2015,20, 444–449. doi:10.1016/j.jmapro.2015.06.024.
6. Ford, S.; Despeisse, M. Additive manufacturing and sustainability: an exploratory study of the advantages and challenges.Journal of Cleaner Production2016,137, 1573–1587. doi:10.1016/j.jclepro.2016.04.150.
7. Tofail, S.A.; Koumoulos, E.P.; Bandyopadhyay, A.; Bose, S.; O’Donoghue, L.; Charitidis, C. Additive manufacturing: scientific and technological challenges, market uptake and opportunities. Materials Today 2018,21, 22–37. doi:10.1016/j.mattod.2017.07.001.
8. Falck, R.; Goushegir, S.; dos Santos, J.; Amancio-Filho, S. AddJoining: A novel additive manufacturing approach for layered metal-polymer hybrid structures. Materials Letters2018,217, 211–214.
doi:10.1016/j.matlet.2018.01.021.
9. Cunico, M.W.M.; de Carvalho, J. Development of additive manufacturing technology based on selective metal-polymer composite formation.Rapid Prototyping Journal2018,24, 52–68.
doi:10.1108/rpj-12-2016-0200.
10. Khatri, B.; Lappe, K.; Noetzel, D.; Pursche, K.; Hanemann, T. A 3D-Printable Polymer-Metal Soft-Magnetic Functional Composite—Development and Characterization.Materials2018,11, 189.
doi:10.3390/ma11020189.
11. Gonzalez-Gutierrez, J.; Cano, S.; Schuschnigg, S.; Kukla, C.; Sapkota, J.; Holzer, C. Additive
Manufacturing of Metallic and Ceramic Components by the Material Extrusion of Highly-Filled Polymers: A Review and Future Perspectives. Materials2018,11, 840. doi:10.3390/ma11050840.
12. Silva, M.; Felismina, R.; Mateus, A.; Parreira, P.; Malça, C. Application of a Hybrid Additive Manufacturing Methodology to Produce a Metal/Polymer Customized Dental Implant. Procedia Manufacturing2017,12, 150–155. doi:10.1016/j.promfg.2017.08.019.
13. Lee, P.H.; Chung, H.; Lee, S.W.; Yoo, J.; Ko, J. Review: Dimensional Accuracy in Additive Manufacturing Processes. ASME 2014 International Manufacturing Science and Engineering Conference collocated with the JSME 2014 International Conference on Materials and Processing and the 42nd North American Manufacturing Research Conference, June 9-13, 2014, Detroit, Michigan, USA: V001T04A045. ASME, 2014. doi:10.1115/msec2014-4037.
14. Guessasma, S.; Zhang, W.; Zhu, J.; Belhabib, S.; Nouri, H. Challenges of additive manufacturing technologies from an optimisation perspective.International Journal for Simulation and Multidisciplinary Design Optimization2015,6, A9. doi:10.1051/smdo/2016001.
15. Kirsch, K.L.; Snyder, J.C.; Stimpson, C.K.; Thole, K.A.; Mongillo, D. Repeatability in Performance of Micro Cooling Geometries Manufactured with Laser Powder Bed Fusion. 53rd AIAA/SAE/ASEE Joint Propulsion Conference. American Institute of Aeronautics and Astronautics, 2017.
doi:10.2514/6.2017-4706.
16. Rebaioli, L.; Fassi, I. A review on benchmark artifacts for evaluating the geometrical performance of additive manufacturing processes.The International Journal of Advanced Manufacturing Technology2017, 93, 2571–2598. doi:10.1007/s00170-017-0570-0.
17. Zongo, F.; Tahan, A.; Aidibe, A.; Brailovski, V. Intra- and Inter-Repeatability of Profile Deviations of an AlSi10Mg Tooling Component Manufactured by Laser Powder Bed Fusion.Journal of Manufacturing and Materials Processing2018,2, 56. doi:10.3390/jmmp2030056.
18. Taheri, H.; Shoaib, M.R.B.M.; Koester, L.W.; Bigelow, T.A.; Collins, P.C.; Bond, L.J. Powder-based additive manufacturing - a review of types of defects, generation mechanisms, detection, property evaluation and metrology. International Journal of Additive and Subtractive Materials Manufacturing2017,1, 172.
19. Günther, J.; Brenne, F.; Droste, M.; Wendler, M.; Volkova, O.; Biermann, H.; Niendorf, T. Design of novel materials for additive manufacturing - Isotropic microstructure and high defect tolerance.Scientific Reports 2018,8. doi:10.1038/s41598-018-19376-0.
20. Gordeev, E.G.; Galushko, A.S.; Ananikov, V.P. Improvement of quality of 3D printed objects by elimination of microscopic structural defects in fused deposition modeling. PLOS ONE2018,13, e0198370.
doi:10.1371/journal.pone.0198370.
21. Dimitrov, D.; van Wijck, W.; Schreve, K.; de Beer, N. Investigating the achievable accuracy of three dimensional printing. Rapid Prototyping Journal2006,12, 42–52. doi:10.1108/13552540610637264.
22. Yaman, U. Shrinkage compensation of holes via shrinkage of interior structure in FDM process. The International Journal of Advanced Manufacturing Technology2017,94, 2187–2197.
doi:10.1007/s00170-017-1018-2.
23. Schmutzler, C.; Zimmermann, A.; Zaeh, M.F. Compensating Warpage of 3D Printed Parts Using Free-form Deformation. Procedia CIRP2016,41, 1017–1022. doi:10.1016/j.procir.2015.12.078.
24. Agrawal, S.; Dhande, S.G. Analysis of mechanical error in a fused deposition process using a stochastic approach.International Journal of Production Research2007,45, 3991–4012. doi:10.1080/00207540600791624.
25. Bochmann, L.; Bayley, C.; Helu, M.; Transchel, R.; Wegener, K.; Dornfeld, D. Understanding error generation in fused deposition modeling. Surface Topography: Metrology and Properties2015,3, 014002. doi:10.1088/2051-672x/3/1/014002.
26. Lieneke, T.; Denzer, V.; Adam, G.A.; Zimmer, D. Dimensional Tolerances for Additive Manufacturing: Experimental Investigation for Fused Deposition Modeling.Procedia CIRP2016,43, 286–291.
doi:10.1016/j.procir.2016.02.361.
27. Messimer, S.L.; Patterson, A.E.; Muna, N.; Deshpande, A.P.; Pereira, T.R. Characterization and Processing Behavior of Heated Aluminum-Polycarbonate Composite Build Plates for the FDM Additive
Manufacturing Process.Journal of Manufacturing and Materials Processing2018,2, 12. doi:10.3390/jmmp2010012.
28. Turner, B.N.; Strong, R.; Gold, S.A. A review of melt extrusion additive manufacturing processes: I. Process design and modeling. Rapid Prototyping Journal2014,20, 192–204. doi:10.1108/rpj-01-2013-0012.
29. Turner, B.N.; Gold, S.A. A review of melt extrusion additive manufacturing processes: II. Materials, dimensional accuracy, and surface roughness.Rapid Prototyping Journal2015,21, 250–261.
doi:10.1108/rpj-02-2013-0017.
30. Mohamed, O.A.; Masood, S.H.; Bhowmik, J.L. Optimization of fused deposition modeling process parameters: a review of current research and future prospects.Advances in Manufacturing2015,3, 42–53. doi:10.1007/s40436-014-0097-7.
31. Mohamed, O.; Masood, S.; Bhowmik, J. Analytical Modelling and Optimization of the
Temperature-Dependent Dynamic Mechanical Properties of Fused Deposition Fabricated Parts Made of PC-ABS.Materials2016,9, 895. doi:10.3390/ma9110895.
32. Sood, A.K.; Ohdar, R.; Mahapatra, S. Parametric appraisal of mechanical property of fused deposition modelling processed parts. Materials & Design2010,31, 287–295. doi:10.1016/j.matdes.2009.06.016.
33. Chang, D.Y.; Huang, B.H. Studies on profile error and extruding aperture for the RP parts using the fused deposition modeling process.The International Journal of Advanced Manufacturing Technology2010, 53, 1027–1037. doi:10.1007/s00170-010-2882-1.
34. Saqib, S.; Urbanic, J. An Experimental Study to Determine Geometric and Dimensional Accuracy Impact Factors for Fused Deposition Modelled Parts. InEnabling Manufacturing Competitiveness and Economic Sustainability; Springer Berlin Heidelberg, 2011; pp. 293–298. doi:10.1007/978-3-642-23860-4_48.
35. Sood, A.K.; Ohdar, R.; Mahapatra, S. Improving dimensional accuracy of Fused Deposition Modelling processed part using grey Taguchi method. Materials & Design2009,30, 4243–4252.
36. Sahu, R.K.; Mahapatra, S.; Sood, A.K. A Study on Dimensional Accuracy of Fused Deposition Modeling (FDM) Processed Parts using Fuzzy Logic. Journal for Manufacturing Science & Production2013,13. doi:10.1515/jmsp-2013-0010.
37. Equbal, A.; Sood, A.K.; Mahapatra, S. Prediction of dimensional accuracy in fused deposition modelling: a fuzzy logic approach. International Journal of Productivity and Quality Management2011,7, 22.
doi:10.1504/ijpqm.2011.037730.
38. Pennington, R.C.; Hoekstra, N.L.; Newcomer, J.L. Significant factors in the dimensional accuracy of fused deposition modelling. Proceedings of the Institution of Mechanical Engineers, Part E: Journal of Process Mechanical Engineering2005,219, 89–92. doi:10.1243/095440805x6964.
39. Huynh, H.N.; Nguyen, A.T.; Ha, N.L.; Thai, T.T.H. Application of fuzzy Taguchi method to improve the dimensional accuracy of Fused Deposition Modeling processed product. 2017 International Conference on System Science and Engineering (ICSSE). IEEE, 2017. doi:10.1109/icsse.2017.8030847.
40. Pérez, C.J.L. Analysis of the surface roughness and dimensional accuracy capability of fused deposition modelling processes. International Journal of Production Research2002,40, 2865–2881.
doi:10.1080/00207540210146099.