a
Corresponding author: [email protected]
CFD analysis of wing trailing edge vortex generator using serrations
H. A. Alawadhi1,a, A. G. Alex1, and Y. H. Kim2 1
Emirates Aviation College, Aeronautical Engineering Department, 53044, Dubai, UAE 2
Emirates Aviation College, Faculty of Aerodynamics, Aeronautical Engineering Department, 53044, Dubai, UAE
Abstract. This study presents computational results of a NACA0012 base wing with the trailing edge modified to incorporate triangular serrations. The effect of the serrations were investigated in three stages, the deflection angle of the serration with respect to the wing chord were examined from -90° to 90° at 10° intervals; the results obtained showed that although larger deflection induces a stronger vorticity magnitude, the strength of the vortex decays faster than compared to smaller deflections. Moreover, the vorticity profile downstream of the wing varies with deflection angle of the serration. Next, the addition of a Clark Y flap to the base wing to analyze the flow pattern and the effect on the flow separation; without serrations attached to the base wing trailing edge, at a high angle of attack, the flow will separate early and would render the flap less effective. The Vortex generator energizes the boundary layer and encourages the flow to remain attached to the flap, allowing for a greater range flap deflection. A wind tunnel experiment was developed and conducted to substantiate the computational analysis in a real world scenario. There was a positive correlation between the results obtained experimentally and computationally.
Nomenclature
lift coefficient Re Reynolds Number V Free stream Velocity ī Circulation
L Lift
įs Serration Deflection Re Reynolds Number ls Length of serration ȟ Vorticity Ȧ Angular Velocity
1 Introduction
The research performed by Knepper [1] was to inspect 3 high lift (technology) which is used on civil aircraft. This examination would shorten the complication in trailing edge device if executed. The main goal of the research progress is to examine the influence of technologies on the development of boundary layer and provide aerodynamic improvement in the configuration of the high lift devices.
Research was performed on serrations of triangular geometries. Serrations of flat plate trailing edge plate which were relied on the deflection angle as well as the flap gap influenced the flow development on a rear placed flap which is single slotted. The serrations seemed
effective during low deflection of the flap angle mainly with the serration length in relation with 13 percent of the flap chord.
Research shows the affect of vortices generated from triangular serrations; which decreases the upper surface boundary layer when serrations are placed at the lower surface leading edge [2]. The same idea of serration showed similar results in some studies when positioned on trailing edges. Thus, the affect of trailing edge serrations on the aerodynamic characteristics of the wing is the primary focus of this research paper.
This study focuses on the computational results for the flow characteristics due to serrations which are also then compared to the experimental results obtained by previous group of Emirates Aviation College undergraduate researchers. These computation results are obtained using Computational Fluid Dynamics software ANSYS FLUENT. The analysis was carried on NACA 0012 airfoil with different configurations of trailing edge serrations and the deflection of the serration angle.
1.1 Experiments with Serrations
Graham’s study of ornithology in the early 1932s projected that the formation of slots by the outer flight separation during gliding and flapping were compared aerodynamically to a wing which is multi slotted. In addition, slots reduced the incidence angle and prevented C
Owned by the authors, published by EDP Sciences, 2014
the stall of the trailing edge at high incidence angle. His study in flight of owl enlightened the importance of aerodynamic in the geometry of the wing of both leading and trailing edge. After a subsequent research and by performing experiments on aural resonance, he authenticated that the noise generation were reduced in the engines of gas turbine, propellers as well as the rotor by using serrations [1].
1.2 Effect of Trailing-Edge Serrations on a Wing with a Sharp Trailing-Edge
Vijgen et al performed studies on the blunt trailing edge for the combination of wing body which was full span AR (High Aspect ratio) mounted on the tapered shape wing. The research on serrations here was involved with the planar serrations. The section of the airfoil was based on the NASA NLF (1)-0414F which had a sharp thickness in the trailing edge. The thickness was about (δTE) = 0.0038c. Transition was set about 5%c on the lower and the upper surface of the span. Extension of the trailing edge was attached on the lower surface which had a thickness of about 0.0008c on the baseline model. This model was outboard across the semi span which was about 78 percent able to accommodate plain and were scalloped or geometries with 60 degree triangular serration
1.3 Effect of Trailing Edge Serrations on a Deployed Single Slotted Flap
Brennan [3] performed studies on 2 dimensional models consisting of a plate flattened and a single trailing edge slotted flap. The chord of the plate was 1.5m with thickness ranging to a maximum of 0.05 m. in order to prevent separation in the leading edge, 6:1 elliptical shaped wooden leading edge were formed for 0.1 c. Behind this point provided the consistency for the upper surface due to the flat plates geometry. The thickness for the lower surface was maintained from 0.1 to 0.62c behind of which there was a tapered geometry with a trailing edge of about 0.55 mm based on the airfoil section of NACA 0012 [3]. A trailing edge of modular aluminum component was extended behind the 0.1m of flattened plate. This smoothened the progress plain interchange, 10 as well as 20mm 60° triangular serrations. A single slotted aluminum flap with a cord of 0.15 m was placed behind the trailing edge flap.
This analysis proved qualitative showing that the serrations influence on the flow which were developed over the flap which was single slotted were purely dependent on the flaps position relative to the serration of the trailing edge although the result of variation in the flap is not quantified. In addition, Brennan also identified that during the vertical distance between the trailing edge of the flat plate, there was an extension in the flap which was more than 25 mm and 2 distinct formation of wake occurred on the flaps downstream [3].
2 Methodology
2.1 Aerodynamics Criteria
Vorticity magnitude, also known as curl of velocity signifies the measure of the local rotation of fluid air. For instance in the case of solids we don’t consider vorticity of an object but instead its angular velocity. These two concepts vorticity and angular velocity are both related but whereas in the case of objects that deform like fluid does, using vorticity is more useful.
The vorticity of a velocity field within a plane is calculated by selecting any two orthogonal axis in that plane and then adding it with the angular velocity of each axis. In a fluid that rotates like an object, the vorticity is distinguished by twice of the angular velocity since each axis is rotating at the same rate. However, this doesn’t mean that the two axis does not rotate at different rate, it can rotate at different rates and different directions. It is even possible for the axis to rotate but still the net vorticity will remain zero.
ȟ =
ȟ = 2Ȧ (2)
Vorticity is defined to be the curl of velocity or twice of angular velocity, and is normally denoted by the symbol ȟ [4].
Another important factor of fluid dynamics that is related to the vorticity is Circulation. Vorticity is a local property which is defined at every point where as circulation is a global property that is defined by integrating a property of the fluid. In any closed contour the circulation around the contour which is in a counter clockwise direction is a scalar quantity. The Kutta’s condition states that an airfoil with sharp trailing edge which is moving through air will create circulation by itself with sufficient strength that is good enough to hold the rear stagnation point at the trailing edge [5].
ī Ł − CV Â ds = − C (Â ds (3)
The circulation around an airfoil increases as the angle of attack of an airfoil increases. Circulation is defines as the integral of velocity around a closed loop. The Kutta’s condition is significant when calculating the lift generated by an airfoil by using the Kutta-Joukowski theorem [5].
The main purpose of using vortex generator is to delay the flow separation by energizing the flow, primarily it is effective when used in conjunction with a high lift device such as a flap. Usually this function is performed during takeoff and landing conditions, where the limited flap deflection and aircraft lift off angle plays a major role in take off performance.
Boeing-717, DC and MD models. Boeing has recommended an average engine take-off rotation rate of 2 - 3 degrees per second, which is sufficient enough to provide tail clearance margin with a target lift of altitude accomplished just after about 3 – 4 seconds [6].
However not all aircraft will have the same angle of attack during takeoff or landing; there are many factors such as local temperature, pressure, elevation and pitch of runway, aircraft payload. These are some of the external variables that contributes to the angle for convenience the angle of attack assumed for the analysis is 8º.
The free stream velocity for lift off and touchdown varies for different aircraft, however the discrepancy has many contributing factors as mentioned previously in the case of lift off angle, the average velocity was assumed for 75m/s.
2.2 Optimization of serration deflection angle
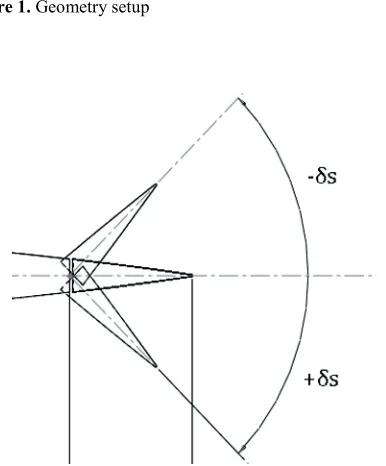
The models were designed using Solidworks CAD software, figure 1 is the setup of the wing for CFD analysis, where as figure 2 shows a close up of the trailing edge of the NACA0012 wing with triangular serrations that can be deflected upwards (-δs) and downwards (+δs).
Figure 1. Geometry setup
Figure 2. Trailing Edge serration deflection
2.3 Optimization of Flap location
Figure 3. Geometry Setup with Clrak Y Flap
Using the same conditions as before, but this time fixing the serration deflection to 30°, the flap was deflected until the flow begins to separate.
2.4 Parameter Selection and Geometry
The parameters selected are listed below in the following tables.
Table 1. Parameters for Wing setup
Angle of Attack 8
Free stream Velocity 75 m/s
Table 2 lists the angles at which the serrations are deflected relative to the airfoil's chord. The step interval assigned is 10º between each angle.
Table 2. Parameter for Serration Deflection
Ser
ra
tio
n
Def
lectio
n
Upwards (-įs) Downwards (+įs) -10 10 -20 20 -30 30 -40 40 -50 50 -60 60 -70 70 -80 80 -90 90
Table 3 defines the chosen flap locations for analysis.
Table 3. Parameter for Flap Location
% of chord Length Interval Position in X 5% to 20% 5%
3 Results and Discussion
3.1 Vorticity Magnitude
The simulation was conducted at a Re = 6.17×10⁶ at sea level condition. From Fig 4, at maximum serration deflection angle (įs = -90), the effective camber of the airfoil becomes slightly negative and another stagnation point is created causing a minor loss in lift and encourages the flow to decelerate and separate before reaching the serration.
Moreover the resulting spike in vorticity magnitude is attributed to the fast deceleration and not the actual vortex generation, resulting in rapid decay in vorticity magnitude downstream of the flow.
Figure 4. Vorticity Magnitude (-90įs -50)
Figure 5. Vorticity Magnitude (-40įs -10)
However Fig 6 indicates at lower deflection angles (-30 < įs < -20) the vorticity build up is much slower and has a lower decay rate. At downward deflection (įs > 0) a similar trend was observed with a minor increase in lift due to increased effective camber; the vortex build up is slightly more energetic from the range of 70% to 100% of the airfoil chord. Further observation includes the position of vortex swirls is determined by the serration deflection i.e. deflecting upwards (-90 < įs < 0) Fig 4
& Fig 5 would shift the location of the vortex swirls above the airfoil and vice versa.
Figure 6. Vorticity Magnitude (0įs 40)
Figure 7. Vorticity Magnitude (50įs 90)
Another interesting characteristic observed was the development of vorticity profile in the downstream of the wing.
Figure 9. Vorticity Profile at 140% of chord (įs = 40)
The figure below highlights the flow over the airfoil and flap. As the flow passes around the airfoil the air from the upper surface does not mix with the air coming from underneath the airfoil, therefore there is no interaction with the flap and we can see that the flow over the airfoil is accelerating which indicates a low pressure zone. As the serration is deflected, the flow mixes and completely envelopes the flap. Our main criteria is to have the vortex to stay attached to the upper surface of the flap.
Figure 10. Comparison of flow interaction with flap
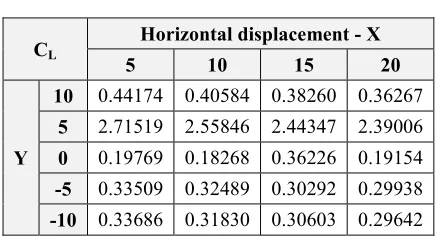
The ANSYS simulation carried out for 20 different flap configurations helped in obtaining the data results for optimizing the effectiveness of the vortex generator's interaction with the flap, this has been carried by increasing the flap deflection until lift Coefficient starts to drop indicating the flap has stalled, which was futher validated by generating streamlines to understand where the flow separation occurs on the flap (see figure 12 & 13). Therefore the overall Lift Coefficient and overall Drag Coefficient result of each model configuration was extracted from ANSYS to generate graphs using spreadsheet.
Table 4. Lift Coefficient data results
CL
Horizontal displacement - X
5 10 15 20
Y
10 0.44174 0.40584 0.38260 0.36267
5 2.71519 2.55846 2.44347 2.39006
0 0.19769 0.18268 0.36226 0.19154
-5 0.33509 0.32489 0.30292 0.29938
-10 0.33686 0.31830 0.30603 0.29642
Table 5. Drag Coefficient data results
CD Horizontal displacement - X
5 10 15 20
Y
10 1.16475 1.13127 1.10750 1.09216
5 0.95625 0.91475 0.88563 0.87243
0 1.10575 1.08407 1.05860 1.02862
-5 1.05234 0.98236 0.97849 0.95892
-10 0.96025 0.95057 0.94344 0.93162
For further evaluation the data results of Lift coefficient will be used to generate graph. To get a clear understanding on the variation of Lift Coefficient across the X and Y axis as the Flap is displaced, keeping the serrated airfoil constant with the decided parameters.
Figure 11. Lift Coefficient
The above Figure presents the variation in overall Lift Coefficient when the flap is displaced across the x and y axis. The graph shows at X(5) & Y(5) flap configuration with maximum lift coefficient.
Figure 12. Flow separation without trailing edge serration
Figure 13. Flow separation with trailing edge serration deflected
Figure 14 below presents the pressure contour generated for the chosen configuration.
Figure 14. Pressure contour. Configuration X(5) & Y(5)
Figure 15. Close up of pressure contour
Figure 16. Vortex cores. Configuration X(5) & Y(5) [7]
However with all underlining procedures taken to conduct the CFD analysis, there were several limitations faced during the simulation, in order to shorten the time required for simulation to run the wing span had to be shorten from 6.0 m to 4.0 m. This length was chosen to speed up calculation of results and also to not let the tip vortices (see figure 16) to envelope more than 10% of the flap surface area. Data points were generated in the span between the tip vortices, these data were exported to MATLAB were the average maximum vortex strength between each serration were taken and subsequently averaged.
4 Experimentation
4.1 Flow visualization
A wind tunnel model was manufactured to conduct flow visualization to substantiate the computational analysis conducted on ANSYS software. Due to the limited resources and facility a surface flow visualization was conducted with the help of a subsonic wind tunnel. The surface flow visualization was conducted by the mixture of china clay and kerosene in a 1:10 composition which was applied to the surface of the model. By using this flow analysis when the model is placed in the wind tunnel and switched on, the mixture moves in the flow direction and in the meantime the kerosene evaporates allowing the china clay to dry in the direction of the air flow around the models.
4.2 Model
Figure 17. Geometry setup [7]
Figure 18. Flap stand [7]
4.3 Experiment setup
The experimental models were set up and placed in the manner as shown below. After which the china clay and kerosene mixture was applied to the models. The models were placed at different position along the wind tunnel and the height of the flap was adjusted to see the best position where the vortex is still attached to the flap.
Figure 19. Wind tunnel test section with model installed [7]
4.4 Results
After careful wind tunnel testing it was found that both the computational analysis and wind tunnel testing gave similar results which revalidated the research conducted.
The picture below shows the vortex generated on to the flap which is similar to the analysis conducted on ANSYS. The image shows the serration on the base wing and as the flow passes through the serration, it developed the vortex shown on the flap.
Figure 20. Flow visualization using kerosene and china clay [7]
Figure 21. Close up of triangular serrations [7]
Conclusion
Finally, the computational analysis was plotted using Tecplot which was used to compare the impact of the computational analysis and experimental techniques using the wind tunnel. To further, test the ability of the serration the flaps were deflected at a higher angle of attack which showed the formation of reversed flow around the flap surface as depicted below in the image.
In addition, the experiments with appropriated configuration were repeated twice to thrice to see any variation in the observation. Although the results were not as favorable as obtained from the tech plot, the reasons might be due to the reduced velocity obtained from the wind tunnel.
Figure 22. Flow Stream lines [7]
Figure 23. Flow separation on flaps [7]
5. References
1. M. Knepper, Examination of Three Candidate Technologies for High-Lift Devices on an Aircraft Wing. Cranfield University (2005)
2. P. T. Soderman, Aerodynamic Effects of Leading-Edge Serrations on a Two-Dimensional Airfoil. NASA (1972)
3. S. Brennan. A wind tunnel investigation into the effect of a serrated trailing. MSc Thesis. Cranfield University (2002).
4. B. J. Hoskins, M. E. Mcintyre, A. W. Robertson. RMS, On the use and significance of isentropic potential vorticity maps. 111, 470 (1985)
5. J. D. Anderson. Introduction to Flight. 368-370 (2008).
6. Boeing. AERO, Exceeding Tire Speed Rating During Takeoff. (2009).

![Figure 16. Vortex cores. Configuration X(5) & Y(5) [7]](https://thumb-us.123doks.com/thumbv2/123dok_us/8205883.1370791/6.595.311.535.68.230/figure-vortex-cores-configuration-x.webp)
![Figure 18. Flap stand [7]](https://thumb-us.123doks.com/thumbv2/123dok_us/8205883.1370791/7.595.56.250.71.417/figure-flap-stand.webp)
![Figure 22. Flow Stream lines [7]](https://thumb-us.123doks.com/thumbv2/123dok_us/8205883.1370791/8.595.55.285.69.252/figure-flow-stream-lines.webp)
