Event-by-event mean
p
Tfluctuations in pp and Pb–Pb collisions at the LHC
Stefan Heckel1,aon behalf of the ALICE Collaboration
1Institut für Kernphysik, Goethe-Universität, Max-von-Laue-Str. 1, 60438 Frankfurt am Main, Germany
Abstract.The ALICE detector at the LHC is used to study the properties of the Quark-Gluon Plasma produced in heavy-ion collisions. As a reference measurement, also the analysis of proton-proton (pp) collisions is very important. In the study presented here, event-by-event fluctuations of the mean transverse momentum are analysed in pp collisions at √s=0.9, 2.76 and 7 TeV, and Pb–Pb collisions at √sNN=2.76 TeV as a function of the charged-particle multiplicity. In both systems, dynamical fluctuations beyond the statistical expectation are observed. In pp collisions, no significant dependence on collision energy is found, even in comparison to inclusive results at much lower collision energies. Likewise, central A–A collisions show only little dependence on collision energy. The multiplicity dependence observed in peripheral Pb–Pb data is in agreement with that in pp collisions. Going to more central Pb–Pb collisions, a clear deviation from this trend is found, reaching a significant reduction of the fluctuations in most central collisions. Comparisons to Monte Carlo event generators show good agreement in pp, but rather large differences in Pb–Pb collisions.
1 Introduction
At LHC energies, not only heavy-ion (A–A) collisions, but also pp collisions produce a large number of particles in the final state. The ALICE detector [1] is well suited for the investigation of both systems and can cope in partic-ular with the very large number of particles produced in central Pb–Pb collisions. Its main purpose is the study of the Quark-Gluon Plasma, where the quarks and glu-ons are believed to exist in a quasi-free state and are re-combined into colorless objects at the phase transition to a Hadron Gas. This phase transition may go along with crit-ical fluctuations of thermodynamic quantities which could be observed via event-by-event fluctuation measurements. These analyses may also reveal collective effects like the onset of thermalization of a system and are therefore pro-posed for the investigation of the hot and dense matter gen-erated in heavy-ion collisions [2–5].
Recently, ALICE has measured event-by-event fluc-tuations of the mean transverse momentum (hpTi) of final-state charged particles as a function of the aver-age charged-particle multiplicity density (hdNch/dηi) [6]. Many kinds of correlations among the transverse mo-menta of the final-state particles may lead to such fluc-tuations, e.g. jets, resonance decays and quantum correla-tions. These are already present in pp collisions, which can hence serve as a model-independent baseline of the inves-tigation of additional effects in A–A collisions. We present results for pp collisions at √s=0.9, 2.76 and 7 TeV, and Pb–Pb collisions at √sNN=2.76 TeV together with a com-parison of both systems. Furthermore, we compare to
pre-ae-mail: sheckel@ikf.uni-frankfurt.de
vious measurements at lower collision energies and to sev-eral Monte Carlo (MC) event generators.
2 ALICE detector and analysis details
The results presented are based on data measured at the CERN Large Hadron Collider (LHC) [7] with the ALICE detector [1] taking into account 19×106Pb–Pb events at √s
NN =2.76 TeV, and 6.9×10⁶, 66×106and 290×106 pp events at √s=0.9, 2.76 and 7 TeV, respectively.
Charged-particle tracking is performed with the Time Projection Chamber (TPC) [8] in the pseudo-rapidity range |η| < 0.8. The transverse momentum range is
re-stricted to 0.15<pT <2 GeV/c, both to guarantee a good tracking efficiency and momentum resolution and because the focus of this study is on bulk particle production. With the upperpTcut, highpTparticles originating from initial hard scatterings are reduced.
For the determination of the primary vertex, the In-ner Tracking System (ITS) is used in addition to the TPC. Events are only accepted in the analysis, when at least one charged-particle track is contributing to the primary ver-tex reconstruction, which itself has to be within±10 cm from the nominal interaction point along the beam direc-tion to ensure a uniform pseudo-rapidity acceptance within the TPC. In Pb–Pb collisions, an additional requirement of at least 10 reconstructed tracks inside the acceptance re-moves the largest fraction of non-hadronic events. The two forward scintillator systems VZERO-A (2.8 < η < 5.1)
and VZERO-C (−3.7< η <−1.7) are used for the
central-ity determination in Pb–Pb as outlined in [9].
On the level of single charged particles, a set of dif-ferent track selection criteria assures a good quality of the
accepted tracks. The number of accepted tracks in one event within theηandpTranges given above is denoted as Nacc.
The determination of a quantity like the mean trans-verse momentumhpTi on an event-by-event level is sub-ject to efficiency loss of particle tracks as well as to the fi-nite momentum resolution. Therefore, the event-by-event mean transverse momentum is approximated by the mean value MEbE(pT)k of the transverse momenta pT,i of the
Nacc,kaccepted charged particles in eventk:
MEbE(pT)k= N1
acc,k NXacc,k
i=1
pT,i. (1)
In general, both statistical and dynamical fluctuations of MEbE(pT)k are present. A measure for only the
dy-namical contribution is the two-particle correlator C = h∆pT,i,∆pT,ji[10–12]. In this analysis, the correlatorCm
is used, which is defined in multiplicity classes m. The mean transverse momentum of all tracks in all events of classmis denoted asM(pT)mand defined as
M(pT)m=Pnev,m1 k=1 Nacc,k
nev,m
X
k=1
NXacc,k
i=1 pT,i
=Pnev,m1
k=1 Nacc,k
nev,m
X
k=1
Nacc,k·MEbE(pT)k. (2)
Furthermore,nev,mis the number of events in multiplicity
classmandNkpairs =0.5·Nacc,k·(Nacc,k−1) is the number
of particle pairs in eventk. With this, the two-particle cor-relatorCm, which is the mean of covariances of all pairs
of particlesiand jin the same event with respect to the inclusiveM(pT)m, can be defined as
Cm=Pnev,m1 k=1 N
pairs
k
·
nev,m
X
k=1
NXacc,k
i=1
NXacc,k
j=i+1
(pT,i−M(pT)m)·(pT,j−M(pT)m). (3)
By construction, Cm vanishes, if only statistical
fluctua-tions are present. The dimensionless ratio √Cm/M(pT)m
is used for the presentation of the results which quantifies the strength of the dynamical fluctuations in units of the average transverse momentumM(pT)m.
3 Results in pp collisions
The inclusive relative dynamical fluctuation √C/M(pT),
which is not subdivided into multiplicity classes m, is shown as a function of √sin figure 1 for pp collisions at √s=0.9, 2.76 and 7 TeV. Significant dynamicalM(pT) fluctuations are observed with a magnitude of about 12 % ofM(pT), independent of the collision energy.
The ALICE results are compared to a similar quan-tityRmeasured by the Split Field Magnet (SFM) detector at the ISR in pp collisions at much lower collision ener-gies of √s=30.8, 45, 52, and 63 GeV [13]. Ris deter-mined by extrapolating the multiplicity-dependent disper-sionD(MEbE(pT)k) to infinite multiplicity and
normaliza-tion by the inclusive mean transverse momentum. This
(GeV)
s 2
10 103 104
) fluctuations T
p
(
M
Relative
0 0.02 0.04 0.06 0.08 0.1 0.12 0.14 0.16
pp
)
T p
(
M
/
C
ALICE:
R
ISR: pp
)
T p
(
M
/
C
ALICE:
R
ISR:
Figure 1. Relative dynamical mean transverse momentum fluc-tuations in pp collisions as a function of √s. The ALICE results for √C/M(pT) are compared to the quantityRmeasured at the ISR (see text and [13]).
〉 η
/d
ch N
d
〈
0 10 20 30 40 50
m
) T
p
(
M
/
m
C
0 0.02 0.04 0.06 0.08 0.1 0.12 0.14 0.16
ALICE pp = 7 TeV
s
= 2.76 TeV
s
= 0.9 TeV
s
ALICE pp = 7 TeV
s
= 2.76 TeV
s
= 0.9 TeV
s
ALICE pp = 7 TeV
s
= 2.76 TeV
s
= 0.9 TeV
s
ALICE pp = 7 TeV
s
= 2.76 TeV
s
= 0.9 TeV
s
ALICE pp = 7 TeV
s
= 2.76 TeV
s
= 0.9 TeV
s
ALICE pp = 7 TeV
s
= 2.76 TeV
s
= 0.9 TeV
s
| < 0.8
η
|
c
< 2 GeV/
T p
0.15 <
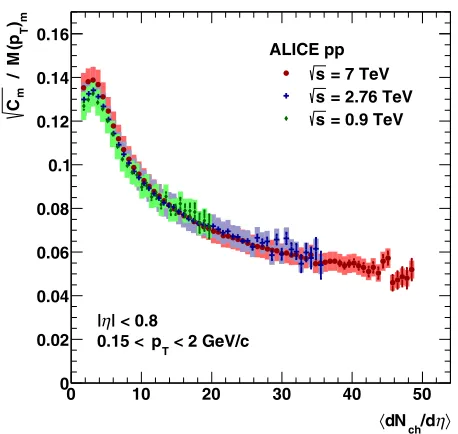
Figure 2. Relative fluctuation √Cm/M(pT)m as a function of hdNch/dηiin pp collisions at √s=0.9, 2.76 and 7 TeV.
is an alternative estimate of dynamical mean transverse momentum fluctuations. The comparison of ALICE and ISR results at collision energies separated by two orders of magnitude does not reveal any significant dependence of the fluctuations on the collision energy.
〉 η
/d
ch N
d
〈
1 10
m
) T
p
(
M
/
m
C
0.05 0.06 0.07 0.08 0.09 0.1 0.2
= 7 TeV
s
pp: ALICE
PYTHIA6 Perugia-0 PHOJET
PYTHIA8.150
PYTHIA6 Perugia-11 default PYTHIA6 Perugia-11 NOCR
= 7 TeV
s
pp: ALICE
PYTHIA6 Perugia-0 PHOJET
PYTHIA8.150
PYTHIA6 Perugia-11 default PYTHIA6 Perugia-11 NOCR
= 7 TeV
s
pp: ALICE
PYTHIA6 Perugia-0 PHOJET
PYTHIA8.150
PYTHIA6 Perugia-11 default PYTHIA6 Perugia-11 NOCR
= 7 TeV
s
pp: ALICE
PYTHIA6 Perugia-0 PHOJET
PYTHIA8.150
PYTHIA6 Perugia-11 default PYTHIA6 Perugia-11 NOCR
= 7 TeV
s
pp: ALICE
PYTHIA6 Perugia-0 PHOJET
PYTHIA8.150
PYTHIA6 Perugia-11 default PYTHIA6 Perugia-11 NOCR
= 7 TeV
s
pp: ALICE
PYTHIA6 Perugia-0 PHOJET
PYTHIA8.150
PYTHIA6 Perugia-11 default PYTHIA6 Perugia-11 NOCR
= 7 TeV
s
pp: ALICE
PYTHIA6 Perugia-0 PHOJET
PYTHIA8.150
PYTHIA6 Perugia-11 default PYTHIA6 Perugia-11 NOCR
| < 0.8
η
|
c
< 2 GeV/
T p
0.15 <
〉 η
/d
ch N
d
〈
0 5 10 15 20 25 30 35 40
(ALICE)
m
) T
p
(
M
/
m
C
(MC) /
m
) T
p
(
M
/
m
C
0.6 0.8 1 1.2 1.4
= 7 TeV
s
pp:
PYTHIA6 Perugia-0 PHOJET
PYTHIA8.150
PYTHIA6 Perugia-11 default PYTHIA6 Perugia-11 NOCR
= 7 TeV
s
pp:
PYTHIA6 Perugia-0 PHOJET
PYTHIA8.150
PYTHIA6 Perugia-11 default PYTHIA6 Perugia-11 NOCR
= 7 TeV
s
pp:
PYTHIA6 Perugia-0 PHOJET
PYTHIA8.150
PYTHIA6 Perugia-11 default PYTHIA6 Perugia-11 NOCR
= 7 TeV
s
pp:
PYTHIA6 Perugia-0 PHOJET
PYTHIA8.150
PYTHIA6 Perugia-11 default PYTHIA6 Perugia-11 NOCR
= 7 TeV
s
pp:
PYTHIA6 Perugia-0 PHOJET
PYTHIA8.150
PYTHIA6 Perugia-11 default PYTHIA6 Perugia-11 NOCR
= 7 TeV
s
pp:
PYTHIA6 Perugia-0 PHOJET
PYTHIA8.150
PYTHIA6 Perugia-11 default PYTHIA6 Perugia-11 NOCR
| < 0.8
η
|
c
< 2 GeV/
T p
0.15 <
Figure 3.Left: Relative dynamical fluctuation √Cm/M(pT)mfor data and different event generators in pp collisions at √s=7 TeV as a
function ofhdNch/dηi. Right: Ratio models to data. The red error band indicates the statistical and systematic data uncertainties added in quadrature.
collisions at √s=0.9, 2.76 and 7 TeV. In figure 2, the rela-tive dynamical fluctuation √Cm/M(pT)mis presented as a
function ofhdNch/dηifor all three collision energies. Dy-namical fluctuations are observed over the entire multiplic-ity range. At low multiplicities, the fluctuation strength reaches values of 12–14 %, similar to the inclusive results, but with increasing multiplicity the fluctuations decrease to about 5 % at the highest multiplicities. It is the first time, thatM(pT) fluctuations in pp collisions are analysed as a function of multiplicity and that this substructure underly-ing the inclusive values is observed. The independence of the results on the collision energy is preserved when going to the multiplicity dependent results.
In pp collisions at very high energies as reached at the LHC the occurence of multiple hard scatterings in a sin-gle collision may be possible, due to the large number of partons within the ultra-relativistically moving particles. High-multiplicity events in pp collisions at LHC energies are believed to be driven by such multi-parton interactions (MPIs) [14]. These multiple hard scatterings are indepen-dent processes in the initial state of the collision. How-ever, the particles originating from different hard scatter-ings may be recombined via the color-reconnection mech-anism, which could lead to correlations in the final state.
These mechanisms cannot be studied directly in the experimental results. Instead, a comparison with several Monte Carlo (MC) event generators is performed in pp collisions at √s=7 TeV. PHOJET [15] and several ver-sions and tunes of PYTHIA [16, 17] are used, in partic-ular PYTHIA6 with the Perugia-0 and Perugia-11 tunes and PYTHIA8. In the case of PYTHIA6 Perugia-11, the default tune is compared with another version, where the color-reconnection mechanism is switched off. In PYTHIA, color reconnections are responsible for the
in-crease of M(pT) with multiplicity [18, 19] which hence could lead to interesting results in the case ofM(pT) fluc-tuations.
The relative dynamical fluctuation √Cm/M(pT)m as
a function of the charged-particle multiplicity density hdNch/dηifrom ALICE in pp collisions at √s=7 TeV is compared to the MC generators in figure 3 (left panel) and the ratio of the MC generators to ALICE data is shown in figure 3 (right panel). √Cm/M(pT)m as function of
hdNch/dηi shows a power-law behavior in data which is
reproduced by most of the MC generators. A power-law fit to the ALICE data in the interval 5 <hdNch/dηi <30
yieldsb =−0.431±0.001 (stat.)±0.021 (syst.). A simple
superposition scenario, as would be expected in the case of independent MPIs, would lead to a power-law index of b=−0.5, which is clearly not found. An interesting
obser-vation is, that both PYTHIA6 Perugia-0 tunes – with and without the color-reconnection mechanism – show a very similar behavior and are both in agreement with the data. Unlike the behavior in M(pT), where color reconnections are necessary to describe the increase with multiplicity, in M(pT) fluctuations the color-reconnection mechanism seems to have no significant influence.
4 From pp to heavy-ion collisions
(GeV)
NN s
10 102 103
) T
p
(
M
/
C
0 0.002 0.004 0.006 0.008 0.01 0.012 0.014 0.016
ALICE Pb-Pb, 0-5% STAR Au-Au, 0-5% CERES Pb-Au, 0-6.5% ALICE Pb-Pb, 0-5% STAR Au-Au, 0-5% CERES Pb-Au, 0-6.5% ALICE Pb-Pb, 0-5% STAR Au-Au, 0-5% CERES Pb-Au, 0-6.5%
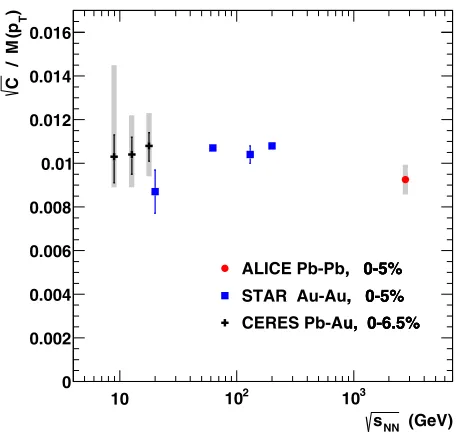
Figure 4. Mean transverse momentum fluctuations in central heavy-ion collisions as a function of √sNN. The ALICE data point is compared to data from the CERES [10] and STAR [11] experiments. For STAR only statistical uncertainties are avail-able.
Going on to the investigation of heavy-ion collisions it is interesting to study, whether the trend in pp collisions may serve as a baseline for heavy ions, and to search for effects beyond those observed in pp. In heavy-ion colli-sions, a lot of nucleons collide, leading to a large number of initial hard scatterings. It may also be possible, that in some of those collisions multi-parton interactions take place, but this effect is expected to be negligible with re-spect to the large number of nucleon–nucleon collisions. Other effects unique to heavy ions may originate from the phase transition from a Quark-Gluon Plasma to a Hadron Gas, from fluctuations in the initial state of the collisions and from collective effects like the thermalization of the system.
As a first step, most central Pb–Pb collisions at √s
NN =2.76 TeV are analysed and compared to results in A–A collisions at lower collision energies measured by the CERES [10] and STAR [11] experiments, which is shown in figure 4. As in pp, significant dynamical fluctua-tions and no significant dependence on the collision energy are observed. The scale of the fluctuations is about 1% ofM(pT), which is about one order of magnitude smaller than in inclusive pp collisions.
Figure 5 presents the relative dynamical fluctuation √C
m/M(pT)mas a function of the average charged-particle
multiplicity densityhdNch/dηiin pp and Pb–Pb collisions at √sNN =2.76 TeV measured by ALICE. A strong de-crease of the fluctuation strength with increasing multi-plicity is, as in pp, as well observed in Pb–Pb collisions. Furthermore, the slope of this decrease shows a power-law behavior in peripheral Pb–Pb collisions, which is in very good agreement with the extrapolation of a power-law fit
〉 η
/d
ch N
d
〈
1 10 102 103
m
) T
p
(
M
/
m
C
-2
10
-1
10
= 2.76 TeV
NN s
ALICE pp ALICE Pb-Pb HIJING Pb-Pb
Power-law fit ALICE pp Power-law fit HIJING = 2.76 TeV
NN s
ALICE pp ALICE Pb-Pb HIJING Pb-Pb
Power-law fit ALICE pp Power-law fit HIJING = 2.76 TeV
NN s
ALICE pp ALICE Pb-Pb HIJING Pb-Pb
Power-law fit ALICE pp Power-law fit HIJING = 2.76 TeV
NN s
ALICE pp ALICE Pb-Pb HIJING Pb-Pb
Power-law fit ALICE pp Power-law fit HIJING = 2.76 TeV
NN s
ALICE pp ALICE Pb-Pb HIJING Pb-Pb
Power-law fit ALICE pp Power-law fit HIJING = 2.76 TeV
NN s
ALICE pp ALICE Pb-Pb HIJING Pb-Pb
Power-law fit ALICE pp Power-law fit HIJING = 2.76 TeV
NN s
ALICE pp ALICE Pb-Pb HIJING Pb-Pb
Power-law fit ALICE pp Power-law fit HIJING = 2.76 TeV
NN s
ALICE pp ALICE Pb-Pb HIJING Pb-Pb
Power-law fit ALICE pp Power-law fit HIJING = 2.76 TeV
NN s
ALICE pp ALICE Pb-Pb HIJING Pb-Pb
Power-law fit ALICE pp Power-law fit HIJING = 2.76 TeV
NN s
ALICE pp ALICE Pb-Pb HIJING Pb-Pb
Power-law fit ALICE pp Power-law fit HIJING = 2.76 TeV
NN s
ALICE pp ALICE Pb-Pb HIJING Pb-Pb
Power-law fit ALICE pp Power-law fit HIJING
| < 0.8
η
|
c
< 2 GeV/
T p
0.15 <
Figure 5. Relative dynamical fluctuation √Cm/M(pT)m as
a function of hdNch/dηi in pp and Pb–Pb collisions at √s
NN = 2.76 TeV. Also shown are results from HIJING and power-law fits to pp (solid line) and HIJING (dashed line) (see text).
to pp data at √s=2.76 TeV in the interval 5<hdNch/dηi
<25, withb =−0.405±0.002 (stat.)±0.036 (syst.). This
agreement holds up tohdNch/dηi ≈100, from where on a slight enhancement over the pp extrapolation is observed up tohdNch/dηi ≈500. Going to even higher multiplici-ties, corresponding to collision centralities<40%, a strong decrease of the fluctuations below the pp extrapolation is found.
In addition, the result of a HIJING [20] MC simulation is shown in figure 5. The HIJING version is 1.36 and no jet quenching is taken into account. Like for the pp data, also for the HIJING simulation a power-law fit is performed, taking the interval 30 <hdNch/dηi <1500. An exponent b = −0.499±0.003 (stat.)±0.005 (syst.) is found which
is in agreement with a simple superposition expectation of b = −0.5. The HIJING results are described very well
by this fit with the exception of very low multiplicities. Obviously, HIJING cannot describe the behavior observed in Pb–Pb data.
5 Results in Pb–Pb collisions
One of the effects, which may be important in heavy-ion collisions and is not present in pp collisions, is the fluc-tuation of the initial conditions. This may be related to event-by-event fluctuations of radial flow and azimuthal asymmetries, which could have an influence on the event-by-event M(pT) fluctuations, although the corresponding event-averaged quantities are not expected to give rise to strongM(pT) fluctuations in azimuthally symmetric detec-tors [10, 21].
〉 η
/d
ch N
d
〈
10 102 103
-0.5
〉η
/d
ch
N
d
〈
/ A *
m
) T
p
(
M
/
m
C
0.4 0.6 0.8 1 1.2 1.4 1.6 1.8
= 2.76 TeV
NN s
ALICE pp ALICE Pb-Pb HIJING
AMPT string melting AMPT default = 2.76 TeV
NN s
ALICE pp ALICE Pb-Pb HIJING
AMPT string melting AMPT default = 2.76 TeV
NN s
ALICE pp ALICE Pb-Pb HIJING
AMPT string melting AMPT default = 2.76 TeV
NN s
ALICE pp ALICE Pb-Pb HIJING
AMPT string melting AMPT default = 2.76 TeV
NN s
ALICE pp ALICE Pb-Pb HIJING
AMPT string melting AMPT default = 2.76 TeV
NN s
ALICE pp ALICE Pb-Pb HIJING
AMPT string melting AMPT default = 2.76 TeV
NN s
ALICE pp ALICE Pb-Pb HIJING
AMPT string melting AMPT default | < 0.8
η
|
c
< 2 GeV/
T p
0.15 <
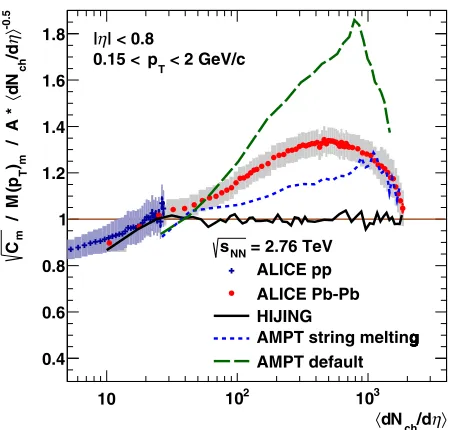
Figure 6.Relative dynamical fluctuation √Cm/M(pT)m
normal-ized tohdNch/dηi−0.5(see text) as a function ofhdNch/dηiin pp and Pb–Pb collisions at √sNN=2.76 TeV. The ALICE data are compared to results from HIJING and AMPT.
the AMPT [22] simulation, which include collective ef-fects, is presented. The relative dynamical fluctuation √C
m/M(pT)m is normalized to the result of a fit of
A·hdNch/dηi−0.5to the HIJING simulation in the interval 30 <hdNch/dηi < 1500. HIJING agrees with the data only at very low multiplicities up tohdNch/dηi ≈30 and shows a very good agreement with the simple superposi-tion expectasuperposi-tion above. The rise of the Pb–Pb data with respect to this expectation as well as the strong decrease towards central events is clearly visible in this representa-tion. Both AMPT calculations agree qualitatively with the behavior observed in the data, but quantitatively all MC generators fail to describe it. The default AMPT calcula-tion shows much larger fluctuacalcula-tions than the data, while the results of the AMPT simulation including the string melting mechanism do not reach the values of the data. In the string melting scenario, partons are not only gen-erated from (hard) mini-jets as in the default version, but also from (soft) strings. In addition, the partons are recom-bined by a hadronic coalescence scheme after rescattering. The ALICE results for √Cm/M(pT)m in Pb–Pb
col-lisions at √sNN = 2.76 TeV are compared to re-sults by the STAR experiment in Au–Au collisions at √s
NN = 200 GeV [11] in figure 7 as a function of the average charged-particle multiplicity density hdNch/dηi (left panel) and as a function of the average number of participating nucleons hNparti (right panel). As a func-tion ofhdNch/dηi, a clear difference of the results is ob-served. At same multiplicities, a higher fluctuation sig-nal is found in the ALICE data, but also the multiplic-ity reach is much higher than in STAR. Despite this dif-ference, the STAR data exhibit a very similar scaling with hdNch/dηi as the ALICE data at much higher
en-ergy. In the left panel, also the fit to the ALICE pp re-sults is shown, and a corresponding fit to the STAR data with the same exponentb =−0.405. Besides this
agree-ment in the peripheral region, also the deviation of the behavior with an additional decrease of the fluctuations towards central collisions is observed in the STAR mea-surements, although it is not as pronounced as in the AL-ICE heavy-ion data. In the right panel of figure 7, i.e. the representation as a function ofhNparti, both measure-ments are compatible within the rather large experimen-tal uncertainties onhNpartiin STAR. Here, a power-law fit √C
m/M(pT)m ∝ hNpartibis only performed on the ALICE data (in the interval 10 <hNparti < 40), resulting in an
exponentb =−0.472±0.007 (stat.)±0.037 (syst.). Both
ALICE and STAR data agree with this fit in the periph-eral region and show a deviation from the fit at the same hNparti, i.e. the same centralities, which hints to a relation between the measured fluctuation signals and the collision geometry.
6 Conclusions
Event-by-event mean transverse momentum fluctuations measured in pp collisions at √s=0.9, 2.76 and 7 TeV and Pb–Pb collisions at √sNN =2.76 TeV by ALICE at the LHC are presented. In both collisions systems, significant dynamical fluctuations are observed, which decrease with increasing multiplicity. No significant collision energy de-pendence is found in pp collisions as a function of the av-erage charged-particle multiplicity densityhdNch/dηiand for inclusive results, also in comparison to results at much lower collision energies measured at the ISR. The results in central A–A collisions, compared to lower collision en-ergy data from CERES at SPS and STAR at RHIC, seem to be independent of the collision energy as well.
The trend of relative dynamical fluctuations as a func-tion ofhdNch/dηiobserved in pp collision follows a power-law like behavior with an exponentbbeing different from a simple superposition expectation. An extrapolation of this trend agrees very well with peripheral Pb–Pb data. At higher multiplicities, a slight increase above this pp base-line is followed by a clear additional decrease of the fluc-tuation strength towards most central collisions. This be-havior is similar to the one observed in Au–Au collisions at STAR at much lower collision energies, especially as a function of a geometric quantity likehNparti, which points to a relation between the fluctuations and the collision ge-ometry.
m
) T
p
(
M
/
m
C
-2 10
-1 10
= 2.76 TeV NN
s ALICE, Pb-Pb:
= 0.2 TeV NN
s STAR, Au-Au:
-0.405
〉
η /d ch N d
〈
) * s Fit: A (
c < 2 GeV/ T
p 0.15 <
〉
η
/d
ch N
d
〈
10 102 103
Data / Fit
0.7 0.8 0.9 1 1.1
-2 -1
= 2.76 TeV NN
s ALICE, Pb-Pb:
= 0.2 TeV NN
s STAR, Au-Au:
-0.472
〉
part N
〈
Fit: A *
c < 2 GeV/ T
p 0.15 <
〉 part N 〈
10 102
0.7 0.8 0.9 1 1.1
Figure 7.Left: Relative dynamical fluctuation √Cm/M(pT)mas a function ofhdNch/dηiin Pb–Pb collisions at√sNN=2.76 TeV from ALICE compared to results from STAR in Au–Au collisions at √sNN=200 GeV [11]. Also shown as dashed lines are results from power-law fits to the data (see text). Right: same data as a function ofhNparti.
References
[1] K. Aamodt et al. (ALICE), JINST3, S08002 (2008) [2] S. Jeon, V. Koch (2003),hep-ph/0304012
[3] E.V. Shuryak, Phys.Lett. B423, 9 (1998), hep-ph/9704456
[4] M.A. Stephanov, K. Rajagopal, E.V. Shuryak, Phys.Rev.Lett.81, 4816 (1998),hep-ph/9806219 [5] M.A. Stephanov, K. Rajagopal, E.V. Shuryak,
Phys.Rev.D60, 114028 (1999),hep-ph/9903292 [6] B. Abelev et al. (ALICE), Eur.Phys.J. C74, 3077
(2014),1407.5530
[7] L. Evans, P. Bryant, JINST3, S08001 (2008) [8] J. Alme et al., Nucl.Instrum.Meth.A622, 316 (2010),
1001.1950
[9] K. Aamodt et al. (ALICE), Phys.Rev.Lett. 106, 032301 (2011),1012.1657
[10] D. Adamová et al. (CERES), Nucl.Phys.A811, 179 (2008),0803.2407
[11] J. Adams et al. (STAR), Phys.Rev. C72, 044902 (2005),nucl-ex/0504031
[12] S. Voloshin, V. Koch, H. Ritter, Phys.Rev. C60, 024901 (1999),nucl-th/9903060
[13] K. Braune et al. (CERN-Dortmund-Heidelberg-Warsaw-Ames-Bologna , CERN-Heidelberg-Lund), Phys.Lett.B123, 467 (1983)
[14] P. Bartalini, E. Berger, B. Blok, G. Calucci, R. Corke et al. (2011),1111.0469
[15] R. Engel, J. Ranft, S. Roesler, Phys.Rev.D52, 1459 (1995),hep-ph/9502319
[16] T. Sjostrand, S. Mrenna, P.Z. Skands, JHEP05, 026 (2006),hep-ph/0603175
[17] P.Z. Skands, Phys.Rev. D82, 074018 (2010), 1005.3457
[18] T. Sjostrand, pp. 247–251 (2013),1310.8073 [19] B. Abelev et al. (ALICE), Phys.Lett. B727, 371
(2013),1307.1094
[20] W.T. Deng, X.N. Wang, R. Xu, Phys.Lett.B701, 133 (2011),1011.5907
[21] S. Adler et al. (PHENIX), Phys.Rev.Lett.93, 092301 (2004),nucl-ex/0310005

![Figure 7. Left: Relative dynamical fluctuation √Cm/M(pT)m as a function of ⟨dNch/dη⟩ in Pb–Pb collisions at √sNN = 2.76 TeV fromALICE compared to results from STAR in Au–Au collisions at √sNN = 200 GeV [11]](https://thumb-us.123doks.com/thumbv2/123dok_us/8181855.1366414/6.595.82.510.80.330/relative-dynamical-uctuation-function-collisions-fromalice-compared-collisions.webp)
