3D-Printed Whisker Transducer
Authors:
John Delamare
Abstract
Contents
1 Introduction 5
1.1 Whisker . . . 5
1.2 3D Printing . . . 6
1.3 Previous Work . . . 6
1.3.1 Piezo . . . 6
1.3.2 Hall-effect . . . 7
1.3.3 Capacitive . . . 7
1.3.4 Our Approach . . . 8
1.4 Discussion . . . 8
1.5 Conclusion . . . 8
2 Modeling 10 2.1 Mechanics . . . 10
2.2 Transduction . . . 11
2.2.1 Capacitance calculation . . . 12
2.3 Proposed Model . . . 20
2.3.1 Structure . . . 20
2.3.2 PCB Patterns . . . 23
2.3.3 Discusion . . . 27
2.3.4 Conclusion . . . 27
3 Fabrication 28 3.1 Structure . . . 28
3.1.1 Objet . . . 28
3.1.2 Ultimaker . . . 28
3.1.3 Print Orientation . . . 28
3.2 Discussion . . . 29
3.3 Conclusion . . . 29
4 Measurement and Results 30 4.1 Validation Method . . . 30
4.2 Mechanical Dynamics . . . 31
4.2.1 Rotation and Translation . . . 31
4.2.2 Hysteresis . . . 32
4.2.3 Creep . . . 33
4.3 Capacitance . . . 34
4.4 Complete Prototype . . . 34
4.5 Conclusion . . . 34
5 Discussion 35 6 Conclusion 35 6.1 Recommendation . . . 36
Appendix B Model 42
Appendix C PCB Layout 43
Appendix D 3D Prints 44
Appendix E Matlab Code 45
1
Introduction
1.1
Whisker
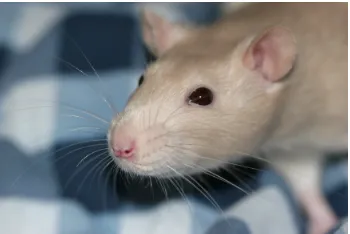
Humans primarily rely on their skin and fingertips for tactile sensation. How-ever many other mammals both land and aquatic rely on whiskers (vibrissae) in order to sense the environment around them. Whiskers are hairs with a special-ized structure and mechanical properties. Each species uses them for different functions. Harbour seals are able to detect hydrodynamic stimuli left behind by their prey in turbid waters [1]. Rats are able to use their whiskers dur-ing exploration to extract information from objects in their near environment. They are able to determine various object features such as size, shape, texture, orientation, and location [2]. Around the base of the whisker shaft there are hundreds of neuro-receptors, these detect the deflection of the whisker much like an old record player detects the bumps and dips on a record [3]. As such tactile sensing using whisker offers several benefits, such as being able to dis-cern objects and the surrounds in an unlit environment. Moreover objects can be mapped without having to come in direct contact with the skin(receptors), which may be damaged due to direct contact depending on the properties of the object surface, imagine hot objects. Studies suggest that the receptors at the base of the whisker encode information about the base torques, velocities, and duration of the whisker displacement [3]. Using this encoded information they are able to implicitly estimate the contact location along the whisker [4]. There are multiple whiskers on a rats face that are arranged in a grid of 5 rows having up to 9 whiskers each [3, 5], see Fig. 1.1, increasing in length from the front of the rat to the back reaching up to 50 mm and diameters tapering from 1 mm [3]. Many studies on the mechanical and structural properties of the whisker suggest that properties such as dimensions, curvature, elasticity, reso-nance, and damping play critical roles on the the signal measured at the base of the structure [3]. The rats whisker is not a passive sensor waiting to come into contact with objects in the environment. The whiskers are actively protracted and retracted in a rhythmic movement at around 5 Hz-25 Hz [5]. Each whisker is able to be controlled individually which allows the rat a greater capability to effectively sense its surroundings [3].
1.2
3D Printing
Additive manufacturing, also known as 3D printing, is a process in which ma-terial is added together layer by layer to build an object. The layer thickness are typically a few hundred microns, however depending on the type of printer better resolutions can be achieved. 3D printers use models created in graph-ical design programs, from which it generates 2 dimensional horizontal slices which are then printed on top of each other. This method of printing allows for the printing of very complex designs which would otherwise be costly or time consuming using other manufacturing methods. This makes 3D printing ideal for prototyping of designs structures, though small scale manufacturing is also possible. However with designing complex structures, which for example have any horizontal overhang, support structures are usually needed to hold the ma-terial in place. There are several ways of 3D printing, each depositing mama-terial in a different method which leads to different attainable resolutions. Moreover different materials are used for 3D printing, from plastics to metals. It is also possible to print multiple materials on one structure within one printing session. This however is very challenging as there are many variables which will affect the final print quality such as adhesion, surface energy, print temperature, and processing conditions among others [6]. And these challenges would vary for each type of printer.
1.3
Previous Work
There have been various implementations of a whisker transducer which func-tion as tactile or fluid flow sensors, each implementafunc-tion using various different materials ranging from steel to an actual rat whisker [3]. Moreover there have been a variety of transduction methods which aim to simulate the function of the whisker base such as potentiometers, capacitors, hall-effect sensors, strain gauges [3], each method having certain advantages and certain shortcomings. In this section we will describe some of the previous implementations and outline our approach. Each implementation is primarily characterized by the transduc-tion method.
1.3.1 Piezo Piezo-electric
Figure 1.2: Flow sensing whisker design [14].
Attached to the bottom of the membrane are two planar electrodes oriented perpendicular to the direction of motion of the whisker. These two electrodes are used to measure differential capacitance in order to determine the moment on the structure. Though the implementation is done on a MEMS level, there are also other implementations which are much larger such as those found in [12,13].
1.3.4 Our Approach
In this project we attempt to design a 3D printed passive whisker sensor, that is, without active whisking capability. This model will be placed on a patterned printed circuit board (PCB) and make use of the fringing fields of the capaci-tance to be able to measure the movement of the whisker base. The proposed model should have 2 degrees of freedom and fabricated using a 3D-printer. Fo-cus is placed on making a design that can be printed and attached to a small PCB board and could possibly be applied to environment mapping for robots. As such a minimal number of components is desired in the design. Different materials and 3D printers will be considered in the process, considering appli-cability and availability. An advantage of this approach is the reduced difficulty and production time in developing a modular tactile sensor.
1.4
Discussion
The implementations shown in this section give a general overview of the ap-proaches which have been used to design a whisker sensor. From the imple-mentations discussed only one had 2 degrees of freedom, however these were perpendicular to each-other. Thus the model is able to bend in orthogonal di-rections, and is only able to measure the bending on those didi-rections, and not contact location. The models which are able to detect contact location make use of active whisking, by use of actuators such as a motor, or a bimporh in one case. Moreover the transduction methods varied from resistive to capacitive.
1.5
Conclusion
2
Modeling
2.1
Mechanics
In this section we will investigate the forces and moments acting on the whisker which are implicitly sensed by the rat in order to generate a model on which we will base the sensor. The base of the whisker is more accurately modeled as a torsional spring in the event of initial object contact and boundary whisking [15]. With this taken into consideration a free-body diagram of the system is shown in Fig. 2.1. From the figure a set of equilibrium equations can be derived where
ΣFx= 0
ΣFy= 0
Στ= 0
In the case where there is no force acting on the whisker (5).
y
x
Ft τs
a
Figure 2.1: Whisker Free-body Diagram.
Στ=τs+τd= 0 (5)
τs=−krθ
τd=−brθ˙
Where τ denotes the torque caused on the structure. The subscripts s and d
denote the components for the spring and drag components respectively. And
θthe angle of rotation. This leads to the homogeneous differential equation for the torque (6). Wherekris the torsional spring constant,brthe damping ratio, andJ the moment of inertia of the beam.
Jθ¨+brθ˙+krθ= 0 (6)
When there is a force acting on the whisker as in Fig. 2.1 , then (6) becomes (7).
Jθ¨+brθ˙+krθ=Fta (7)
Thus being able to measure the angleθwould allow determination of the torque caused by the contact force. However this is not sufficient to determine the precise contact location. In order to do this a second equation is needed. The introduction of a second degree of freedom allows the formulation of another equation which describes the motion in said degree.
Radius (µm) E (GP a) k(N mm/rad) b (N mm/s/rad) 91.4 4.5 65.3·103 0.141
·103
Table 2.1: Mechanical properties at whisker base. [4]
us to set up a system of 2 equations, and 2 unknownsFt &a. The new model is shown in Fig. 2.2. From which the second equilibrium equation follows (8). The rest of the equation is derived similar to Eq. (5)-(7).
ΣFy=Fs+Fd= 0 (8)
Fs=kty
Fd=bty˙
This leads to a new system of equations for our structure, (10) and (9). By
y
x Fs
Ft τs
a
Figure 2.2: Design Model.
simultaneously solving these two equations we should be able to determine the value ofa.
my¨+bty˙+kty=Ft (9)
Jθ¨+brθ˙+krθ=Fta (10)
In [4] the authors investigate the dynamic model of a rat whisker for situation of contact and non-conctact whisking. By observing the frequency response of a rat whisker, they were able to develop a model which would match the response. From the model they were then able to derive the mechanical proper-ties of the whisker. The results show that the mechanical characteristics of the whisker vary along the whisker. Moreover, evidence suggest that the rats may actively modulate the bio-mechanical parameters of the whisker which could affect damping. The parameters at the base of the whisker [4] are shown in Tab. 2.1. It should also be noted that a whisker is not a rigid body as one can see from the given Young’s modulus. This means that the whisker experiences bending moments when a force is exerted on it. However for the purpose of this design the bending effect will not be taken into consideration. Our model will focus on the equilibrium conditions, thus all bending moments will be felt at the base.
2.2
Transduction
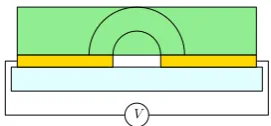
to print conductive materials the design must allow for a dielectric material to interact with the electric field generated by the PCB electrodes to make a change to the total capacitance. A rotation in the mechanical domain will result in a reduction of the gap between the conductor and the dielectric as shown in Fig. 2.3.
θ
Figure 2.3: Whisker Rotation.
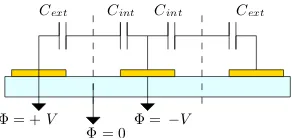
V V V
(a) (b) (c)
Figure 2.4: Transformation standard capacitor.
In this configuration we have a co-planar capacitor which can be imagined as the transformation of a standard capacitor as shown in Fig. 2.4(c) When the gap between the whisker base and the conductor is sufficiently small the electric field between them be approximated as a continuous distribution of semi-circles.
2.2.1 Capacitance calculation
Method 1: Volume Integration
Different methods of calculating the capacitance were attempted which will be outlined and compared in this section. The capacitance and voltage are related to the co-energy function by Eq. (11), from which Eq. (12) follows. The total free energy can be calculated from Eq. (13) [16].
U = 1 2CV
2 (11)
⇒C= 2U
V2 (12)
U = 2
Z
V
E2dV (13)
as the radius of the semi-circles increases. If a known potential is placed across the conductors then the electric field can be found using (15).
Z b
a
E·ds~ =−∆Φ (14)
E·πr=−∆Φ
⇒E= −∆Φ
πr (15)
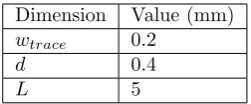
With the known electric field the energy can be calculated in the desired volume. The integration intervals are determined by the coordinate system used along with Fig. 2.5. No dimensions are given in order to allow optimization of the model. Using cylindrical coordinates the r is made to vary as a function ofθ
in order to set the desired boundaries. Furthermore the boundary conditions in Eq. (16) and (17) must be met for continuity of the field. Where D is the displacement field in the dielectric material defined as (18).
Ebelowk =Eabovek (16)
D⊥below=Dabove⊥ (17)
~
D= ~E (18)
Nevertheless this method leads to a set of rather complicated integrals which are not practical to work with and also provide results which are rather complex. Further elaboration on the calculation is given in Appendix A.
s
hsub
wtrace htrace
d wbase
hbase
Figure 2.5: Dimensions
Method 2: Asymptote
In this method we use the two extremes of the gap between the dielectric and electrodes. The assumption of a uniform field of semi-circles is used again, under the two different conditions. In the first situation, the energy is calculated when the dielectric whisker base is completely absent. In the second situation the capacitance is calculated with the dielectric directly sitting on the electrodes as shown in Fig. 2.6a
2.3
Proposed Model
2.3.1 Structure
Recall Eq. (10) and (9) describe the desired behavior of the whisker. Further-more in order to increase the responsiveness of the system it should be critically damped [32]. Another factor which influences the responsiveness of the system is the distance between the rotating arm upon which the torque is acting and the capacitor area [14]. Take Fig. 2.3 as an example, if the electrodes were further out from the center, there would be a much larger displacement for a smaller angle. The base structure chosen for this prototype is shown in 2.12 with the dimensions given in Appendix B Fig. B.1.
Figure 2.12: Model Structure.
The structure chosen supports the whisker base by connecting it on both sides with elliptical bars. This structure would allow for both rotation and lateral displacement of the whisker base, which would be determined primarily by the beams length, cross-section, and the material properties. As a force acts on the whisker the induced torque would cause the base to rotate, causing torsion on the cross-section of the elliptical bars as shown in Fig. 2.13a. The angular twist on an elliptical cross-section is defined by Eq. (39) [33].
θ= τ L
JG (39)
J = πa 3b3
a2+b2
a=hs 2, b=
ws 2
G: Modulus of rigidity
θ τ
Figure 2.13a: Torsion on elliptical cross-section.
δ
F 2Ls
Figure 2.13b: Fixed beam deflection.
the same direction as the force. The deflection is given by (40), which is the deflection of a cantilever fixed cantilever beam reduced by a factor of 2. This reduction is due to the assumption that the structure is two cantilever beams connected at the center, with the force being equally distributed between them, when in equilibrium. Thus the force is reduced by a factor of 2, due to the two beams. Therefor the deflection of a single cantilever beam will also be reduced by a factor of 2.
δ= F L 3 s
6EI (40)
E: Young’s Modulus
I: Area moment of inertia
The dimensions of the support structure were optimized for maximum ment in 2 domains, however there is a trade-off between maximizing displace-ment and maximizing rotation. This is because both the twist angle and the deflection are related to the cross-section of the beam through variablesI&J. The deflection can be optimized using the length of th support beams. However there is a practical limit to how long the support beams should be made, as we are trying to design a sensor. Dimensions more optimal for displacement lead to quicker rupture in the rotational domain. From Fig. 2.12 one can also notice the large pads on both sides of the whisker base which will be used as the dielectric surface area for the capacitance. With a larger dielectric surface area a larger change in the overall capacitance is expected.
Material
E 3.5 GPa
G 2.4 GPa
Elongation at break 6 %
Table 2.3: PLA Properties [34].
Moreover the choice of 3D-printer also limits the range of materials available for use. Furthermore the availability of data on the properties of 3D-printed mate-rial is limited and sometimes differing between sources. For this prototypePLA
was used to print the structure, the material properties are given in Tab. 2.3. Using the material properties from Tab. 2.3 we are able to derive the spring constants for the proposed structure and are shown in Tab. 2.4.
kt 27.02 N mm−1
kr 10.7802 N mm°−1
Table 2.4: Spring Constants.
The values given in Tab. 2.4 are valid if the structure is homogeneous. This how-ever will not be the case for the final product, since it will be 3D-printed. Due to the print resolution and print-orientation the values could vary throughout the entire structure and possibly exhibit non-linear effects.
Stress and Strain
The structure will be put under stress thus should be able to withstand the forces being measured without rupturing during loading. The stresses and strains were calculated according to Eq. (41)(42)(43)(44) [33].
τs= 2T
πab2 (41)
γ= τ
G (42)
ε=∆L
L (43)
σ=Eε (44)
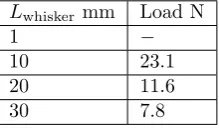
The resulting stress and strain curves are plotted, with equations (41) and (42) plotted in Fig. 2.14a, and equations (44) and (43) plotted in Fig. 2.14b. The red lines in Fig. 2.14a represent the percentage strain allowed before rupture described as the Elongation at break in Tab. 2.3.
0 0.2 0.4 0.6 0.8 1 1.2 Dielectric seperation (m) x 10-3
8.8 8.85 8.9 8.95 9 9.05
Capacitan
ce (F)
x 10-14 Schwarz-Cristoffel
Figure 2.16: Capacitance as function of gap separation (s)
Configuration Capacitance (F)
Cair 3.41×10⁻¹⁴
Cdielctric 4.64×10⁻¹⁴
Table 2.7: Capacitance asymptotes
Eq. (47) is derived from the steps presented in [31], however the configurations presented in their paper are used for multi-layered dielectrics. And the situation is not presented where an intermediate layer is composed of air. In our case we make the assumption that the capacitance due to air is already counted in
Ct. Thus as the gap between the electrodes and whisker base increases, using Eq. (47), its corresponding capacitance would be counted double. Thus our solution is to subtract that capacitance from the total, leading to Eq. (48) and theSubtract gap plot in Fig. 2.15. Eq. (48) is plotted again for convenience in Fig. 2.16. The asymptotes for the capacitance values are given in Tab. 2.7. The maximum asymptote is approximately half of the maximum shown in Fig. 2.8, but this is due to the aforementioned relative difference between the capacitance of the two methods shown in Fig. 2.11. The minimum asymptote is also less than half the minimum shown in Fig. 2.8, though it is uncertain to what value the plot tends.
Electrode Patterns
5 mm
15 mm
Figure 2.17a: Inter-digital traces
5 mm 15 mm
could see that the capacitance is proportional to the length of the trace. For this reason the spiral and inter-digital traces were chosen as these could be used to maximize the length within a small area. A small trace width and gap between traces is preferred as this would take up less space, thus more capacitors can be added within a smaller area effectively increasing the sensitivity as well. Using the capacitance calculated and taking into account the difference in lengths, the spiral electrodes should have a capacitance increase of a factor of 35 and for the inter-digital electrodes a factor of 20 for the larger pads.
2.3.3 Discusion
The proposed structure outlined in this section can be described by the model analyzed in Section 2.1. The beams which support the whisker base allow for the 2 degrees of freedom needed to determine the contact location of the force along the whisker. Another element which was considered in the design was the area which is to be used as dielectric for the capacitance measurement. The area was maximized to fit within the structure’s base without inhibiting lateral movement of the base. For this design PLA will be used due to its availability and elastic properties. Due to the proposed function of the model the stress and strain characteristics were also investigated and a range of possible maximum loads at a given contact location were listed in Tab. 2.5 Capacitive sensing is used for this design. From the calculation is was shown that the capacitance is linearly proportional to the length. With this in mind we optimized the capacitor dimensions to increase its length within a given boundary. This lead to the electrode patterns shown in Fig. 2.17a, and 2.17b.
2.3.4 Conclusion
PCB
The electrode pattern was designed in Eagle Cad software, with the final model shown in Appendix C. The PCB was then ordered from a 3rd party. This fabrication process steps are found with the respective company [36].
3.2
Discussion
For the fabrication of this prototype focus was placed on a test prototype for the measurements. In the first iterations the whisker ruptured at the base of the model. Therefor to avoid the issue with print-orientation and rupturing of the whisker, the whisker support structure was printed independently. In order to minimize prototyping cost and print time, it was opted to make use of the Ultimaker 2 printer with PLA material. The PCB electrodes were placed on a two sided board in order be able test the two electrode configuration.
3.3
Conclusion
4
Measurement and Results
4.1
Validation Method
Mechanical test
The mechanical characteristics were measured using a Sylvac D80 displacement measurement probe which is accurate wo within 0.1µm. The Probe has a spring constant of 0.03 N mm−1which is removed from the final result. With a pulley set-up and several weights the mechanical characteristics are able to be deter-mined. A diagram of the measurement setup for the rotation measurement is shown in Fig. 4.1a and 4.1b. Connecting the unit to a PC with a serial connec-tion we were are to measure real-time data.
Probe
dx Pulley F
Figure 4.1a: Setup for measuring rotation angle.
dx
P
robe
F
R
ope
Figure 4.1b: Setup for measuring displacement.
Capacitance
Discussion
From Fig. 4.4b we notice that even-though the displacement is quite small, in the micrometers, the creep is still quite noticeable over the given time range and is still rising after the pre-set time. The creep in Fig. 4.4a is very noticeable in the measurements, the structure twists an additional 1°over the pre-set time.
4.3
Capacitance
Due to time constraints no measurements were done on the electrode patterns. This will be left as a future task for the prototype
4.4
Complete Prototype
Not completed
4.5
Conclusion
6.1
Recommendation
References
[1] G. Dehnhardt, B. Mauck, and H. Bleckmann, “Seal whiskers detect water movements,”Nature, vol. 394, no. 6690, pp. 235–236, 1998.
[2] J. A. Birdwell, J. H. Solomon, M. Thajchayapong, M. A. Taylor, M. Cheely, R. B. Towal, J. Conradt, and M. J. Hartmann, “Biomechanical models for radial distance determination by the rat vibrissal system,” Journal of Neurophysiology, vol. 98, no. 4, pp. 2439–2455, 2007.
[3] T. J. Prescott, M. J. Pearson, B. Mitchinson, J. C. W. Sullivan, and A. G. Pipe, “Whisking with robots from rat vibrissae to biomimetic technology for active touch,”IEEE Robotics and Automation Magazine, vol. 16, no. 3, pp. 42–50, 2009.
[4] B. W. Quist, V. Seghete, L. A. Huet, T. D. Murphey, and M. J. Hart-mann, “Modeling forces and moments at the base of a rat vibrissa during noncontact whisking and whisking against an object,”The Journal of Neu-roscience, vol. 34, no. 30, pp. 9828–9844, 2014.
[5] R. B. Towal and M. J. Hartmann, “Principles and applications of active tactile sensing strategies in the rat vibrissal system,” in Sensors, 2010 IEEE, pp. 2230–2234, IEEE, 2010.
[6] S. Ready, G. Whiting, and T. N. Ng, “Multi-material 3d printing,” in
NIP & Digital Fabrication Conference, vol. 2014, pp. 120–123, Society for Imaging Science and Technology, 2014.
[7] F. Ju and S.-F. Ling, “A micro whisker transducer with sensorless me-chanical impedance detection capability for fluid and tactile sensing in space-limited applications,” Sensors and Actuators A: Physical, vol. 234, pp. 104–112, 2015.
[8] O. Bebek and M. C. Cavusoglu, “Whisker sensor design for three dimen-sional position measurement in robotic assisted beating heart surgery,” in Robotics and Automation, 2007 IEEE International Conference on, pp. 225–231, IEEE, 2007.
[9] M. H. Evans, C. W. Fox, N. F. Lepora, M. J. Pearson, J. C. Sullivan, and T. J. Prescott, “The effect of whisker movement on radial distance estimation: a case study in comparative robotics,”Active Touch Sensing, p. 106, 2014.
[10] R. P. Feynman, R. B. Leighton, and M. Sands,The Feynman Lectures on Physics, Desktop Edition Volume II, vol. 1. Basic books, 2013.
[11] N. Izadi, “Bio-inspired mems aquatic flow sensor arrays,” 2011.
[13] J. Stocking, W. Eberhardt, Y. Shakhsheer, B. Calhoun, J. Paulus, and M. Appleby, “A capacitance-based whisker-like artificial sensor for fluid motion sensing,” inSensors, 2010 IEEE, pp. 2224–2229, IEEE, 2010.
[14] N. Izadi, R. Jaganatharaja, J. Floris, and G. Krijnen, “Optimization of cricket-inspired, biomimetic artificial hair sensors for flow sensing,”arXiv preprint arXiv:0802.3768, 2008.
[15] M. J. Hartmann, N. J. Johnson, R. B. Towal, and C. Assad, “Mechani-cal characteristics of rat vibrissae: resonant frequencies and damping in isolated whiskers and in the awake behaving animal,”The Journal of neu-roscience, vol. 23, no. 16, pp. 6510–6519, 2003.
[16] D. J. Griffiths and R. College,Introduction to electrodynamics, vol. 3. pren-tice Hall Upper Saddle River, NJ, 1999.
[17] N. I. Dib,Theoretical characterization of coplanar waveguide transmission lines and discontinuities. PhD thesis, 1992.
[18] W. J. Gibbs, Conformal transformations in electrical engineering. Chap-man & Hall, 1958.
[19] Wikipedia, “Cauchy–riemann equations:conformal mapping.” https: //en.wikipedia.org/wiki/Cauchy%E2%80%93Riemann_equations#
Conformal_mappings, 2016. Accessed: 27-Apr-2016.
[20] “Chapter-3 : Conformal mapping - an overview.” http://shodhganga.
inflibnet.ac.in/bitstream/10603/28373/10/10_chapter%203.pdf.
Accessed: 27 Apr 2016.
[21] W. Hilberg, “From approximations to exact relations for characteristic impedances,” Microwave Theory and Techniques, IEEE Transactions on, vol. 17, no. 5, pp. 259–265, 1969.
[22] R. Igreja and C. Dias, “Analytical evaluation of the interdigital electrodes capacitance for a multi-layered structure,”Sensors and Actuators A: Phys-ical, vol. 112, no. 2, pp. 291–301, 2004.
[23] H. Da-Wei, C. Xin-Hong, W. Zhong-Jian, X. Da-Wei, S. Zhao-Rui, and Y. Yue-Hui, “An analytical model for coplanar waveguide on silicon-on-insulator substrate with conformal mapping technique,” Chinese Physics B, vol. 20, no. 1, p. 010210, 2011.
[24] C. R. E., Field theory of guided waves. New York: McGraw-Hill Book Company Inc, 1960.
[25] W. Mathworld, “Elliptic modulus.” http://mathworld.wolfram.com/
EllipticModulus.html, 2016. Online; accessed 27-Apr-2016.
[26] T. Sun, N. G. Green, S. Gawad, and H. Morgan, “Analytical electric field and sensitivity analysis for two microfluidic impedance cytometer designs,”
[27] T.-T. Ngo, A. Bourjilat, J. Claudel, D. Kourtiche, and M. Nadi, “Design and realization of a planar interdigital microsensor for biological medium characterization,” in Next Generation Sensors and Systems, pp. 23–54, Springer, 2016.
[28] T. Sun, N. G. Green, and H. Morgan, “Electric field analysis using schwarz-christoffel mapping,” in Journal of Physics: Conference Series, vol. 142, p. 012029, IOP Publishing, 2008.
[29] M. Vukadinovic, B. Malic, M. Kosec, and D. Krizaj, “Modelling and char-acterization of thin film planar capacitors: inherent errors and limits of applicability of partial capacitance methods,” Measurement Science and Technology, vol. 20, no. 11, p. 115106, 2009.
[30] E. Carlsson and S. Gevorgian, “Conformal mapping of the field and charge distributions in multilayered substrate cpws,”Microwave Theory and Tech-niques, IEEE Transactions on, vol. 47, no. 8, pp. 1544–1552, 1999.
[31] S. O. Blume, R. Ben-Mrad, and P. E. Sullivan, “Modelling the capacitance of multi-layer conductor-facing interdigitated electrode structures,”Sensors and Actuators B: Chemical, vol. 213, pp. 423–433, 2015.
[32] H. Droogendijk, J. Casas, T. Steinmann, and G. Krijnen, “Performance as-sessment of bio-inspired systems: flow sensing mems hairs,”Bioinspiration & biomimetics, vol. 10, no. 1, p. 016001, 2014.
[33] W. C. Young and R. G. Budynas, Roark’s formulas for stress and strain, vol. 7. McGraw-Hill New York, 2002.
[34] MakeItFrom, “Polylactic (pla, polylactide).” http://www.makeitfrom.
com/material-properties/Polylactic-Acid-PLA-Polylactide/, Apr
2016.
[35] A. Farzadi, M. Solati-Hashjin, M. Asadi-Eydivand, and N. A. A. Osman, “Effect of layer thickness and printing orientation on mechanical properties and dimensional accuracy of 3d printed porous samples for bone tissue engineering,”PloS one, vol. 9, no. 9, p. e108252, 2014.
B
Model
rw
Lw
hd
wb
wstruct
wb
Le
hs
ws
wd
wmodel
we
Ls
Ld
hb
Figure B.1: Whisker model dimensions
Parameter Dimension mm
rw 2
Lw 50
Le 5
we 2.5
hb 4
wb 5
wmodel 30
wstruct 20
hd 2
Ld 15
wd 5
hs 3.2
ws 1.6
Ls 8
D
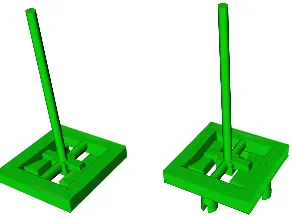
3D Prints
Figure D.1a: PLA printed test structure.
ylabel('Shear stress (MPa)')
1.586 1.15 0.644 0.1406 0.0855]; %
figure plot(tt,ct) xlabel('Time (s)')
module connector pattern(){
translate([0,(w support/2 + s length + ...
w outer/2),-(t support-0.05)]) connector();
translate([0,-(w support/2 + s length + ...
w outer/2),-(t support-0.05)]) connector();
translate([(w support/2 + s length + ...
w outer/2),0,-(t support-0.05)]) connector();
translate([-(w support/2 + s length + ...
w outer/2),0,-(t support-0.05)]) connector();
}
module base modl extension(){
union(){
difference(){
whisker base(); translate([0,0,-5])
whisker();
}
base();
connector pattern(); }
}
module full model(){
whisker base(); whisker(); base();
connector pattern(); }
//translate([0,0,-2]) full model();
![Table 2.1: Mechanical properties at whisker base. [4]](https://thumb-us.123doks.com/thumbv2/123dok_us/1050735.1131431/11.595.212.384.331.413/table-mechanical-properties-at-whisker-base.webp)

![Table 2.3: PLA Properties [34].](https://thumb-us.123doks.com/thumbv2/123dok_us/1050735.1131431/22.595.275.468.475.572/table-pla-properties.webp)