Using a Weighted Semantic Network for Lexical Semantic Relatedness
Reda Siblini
Concordia University 1400 de Maisonneuve Blvd. West Montreal, Quebec, Canada, H3G 1M8
Leila Kosseim
Concordia University 1400 de Maisonneuve Blvd. West Montreal, Quebec, Canada, H3G 1M8
Abstract
The measurement of semantic relatedness between two words is an important met-ric for many natural language processing applications. In this paper, we present a novel approach for measuring semantic re-latedness that is based on a weighted se-mantic network. This approach explores the use of a lexicon, semantic relation types as weights, and word definitions as a basis to calculate semantic related-ness. Our results show that our approach outperforms many lexicon-based methods to semantic relatedness, especially on the TOEFL synonym test, achieving an accu-racy of 91.25%.
1 Introduction
Lexical semantic relatedness is a measurement of how two words are related in meaning. Many natural language processing applications such as textual entailment, question answering, or infor-mation retrieval require a robust measurement of lexical semantic relatedness. Current approaches to address this problem can be categorized into three main categories: those that rely on a lexicon and its structure, those that use the distributional hypothesis on a large corpus, and hybrid ap-proaches.
In this paper, we propose a new lexicon-based approach to measure semantic relatedness that is based on a weighted semantic network that in-cludes all 26 semantic relations found in WordNet in addition to information found in the glosses.
2 Related Work
Approaches to computing semantic relatedness can be classified into three broad categories:
lexicon-based, corpus-based, and hybrid ap-proaches.
Lexicon-based methods use the features of a lexicon to measure semantic relatedness. The most frequently used lexicon is Princeton’s WordNet (Fellbaum, 1998) which groups words into synonyms sets (called synsets) and includes various semantic relations between those synsets, in addition to their definitions (or glosses). WordNet contains 26 semantic relations that include: hypernymy, hyponymy, meronymy, and entailment.
To measure relatedness, most of the lexicon-based approaches rely on the structure of the lexicon, such as the semantic link path, depth (Leacock and Chodorow, 1998; Wu and Palmer, 1994), direction (Hirst and St-Onge, 1998), or type (Tsat-saronis et al., 2010). Most of these approaches exploit the hypernym/hyponym relations, but a few approaches have also included the use of other semantic relations. Leacock and Chodorow (1998) for example, computed semantic related-ness as the length of the shortest path between synsets over the depth of the taxonomy. Wu and Palmer (1994) also used the hyponym tree to calculate relatedness by using the depth of the words in the taxonomy and the depth of the least common superconcept between the two words. Hirst and St-Onge (1998), on the other hand, used the lexical chains between words based on their synsets and the semantic edges that connect them. In addition to using the hypernym relations, they classified the relations into classes: “extra strong” for identical words, “strong” for synonyms, “medium strong” for when there is a path between the two, and “not related” for no paths at all. The semantic measurement is then based on the path length and the path direction changes. Tsatsaronis et al. (2010) used a combination of semantic path length, node depth in the hierarchy, and the types of the semantic edges that compose the path.
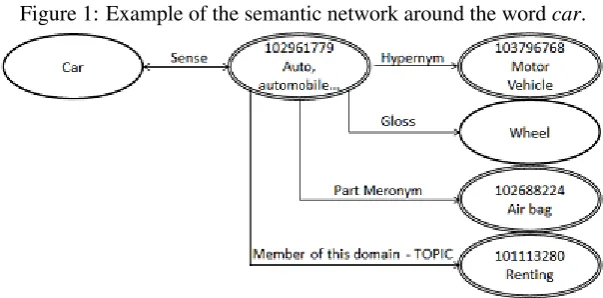
Figure 1: Example of the semantic network around the wordcar.
On the other hand, corpus-based approaches rely mainly on distributional properties of words learned from a large corpus to compute semantic relatedness. Such as the work of Finkelstein et al. (2001) that used Latent Semantic Analysis, and the work of Strube and Ponzetto (2006) and Gabrilovich and Markovitch (2007), which both used the distributional hypothesis on Wikipedia. Finally, hybrid approaches use a combination of corpus-based and lexicon-based methods. For example, the approach proposed by Hughes and Ramage (2007) used a random walk method over a lexicon-based semantic graph supplemented with corpus-based probabilities. Another example is the work of Agirre et al. (2009) that used a supervised machine learning approach to combine three methods: WordNet-based similarity, a bag of word based similarity, and a context window based similarity.
The approach presented in this paper belongs to the lexicon-based category. However, as opposed to the typical lexicon-based approaches described above, our approach uses all 26 semantic relations found in WordNet in addition to information found in glosses. The novelty of this approach is that these relations are used to create an explicit semantic network, where the edges of the network representing the semantic relations are weighted according to the type of the semantic relation. The semantic relatedness is computed as the lowest cost path between a pair of words in the network.
3 Our Approach
Our method to measure semantic relatedness is based on the idea that the types of relations that relate two concepts are a suitable indicator of the semantic relatedness between the two. The type
of relations considered includes not only the hy-ponym/hypernym relations but also all other avail-able semantic relations found in WordNet in addi-tion to word definiaddi-tions.
3.1 WordNet’s Semantic Network
To implement our idea, we created a weighted and directed semantic network based on the content of WordNet. To build the semantic network, we used WordNet 3.1’s words and synsets as the nodes of the network. Each word is connected by an edge to its synsets, and each synset is in turn connected to other synsets based on the semantic relations included in WordNet. In addition each synset is connected to the content words contained in its gloss. For example, Figure 1 shows part of the semantic network created around the wordcar. In this graph, single-line ovals represent words, while double-line ovals represent synsets.
By mining WordNet entirely, we created a net-work of 265,269 nodes connected through a total of 1,919,329 edges. The nodes include all words and synsets, and the edges correspond to all 26 se-mantic relations in WordNet in addition to the re-lation between a synset and every content word of a synset definition.
3.2 Semantic Classes of Relations
Fig-Category Weight Semantic Relations in WordNet
Similar α antonym, cause, entailment, participle of verb, pertainym, similar to, verb group
Hypernym 2×α derivationally related, instance hypernym, hypernym
Sense 4×α+β lemma-synset
Gloss 6×α lemma-gloss content words
P art 8×α holonym (part, member, substance), inverse gloss, meronym (part, member, substance)
Instance 10×α instance hyponym, hyponym
Other 12×α also see, attribute, domain of synset (topic, region, usage), member of this domain (topic, region, usage)
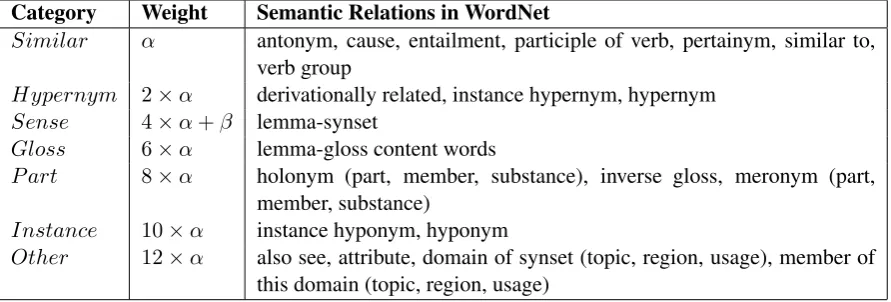
Table 1: Relations Categories and Corresponding Weights.
ure 1, for example, where the word car is more closely related to Motor vehicle than toRenting. In order to determine the contribution of each re-lation, we compared a manually created set of 210 semantic relations for their degree of related-ness. For example, for the conceptcar we have compared the sense ofautomobilewith the hyper-nymmotor vehicle, the gloss wordwheel, the part meronym air bag, the member of this topic rent-ing, and another sense ofcarsuch as acable car. This comparison has lead us to classify the rela-tions into seven categories, and rank these cate-gories from the most related category to the least related one as follows: Similar(highest contribu-tion),Hypernym,Sense,Gloss,Part,Instance, and
Other(lowest contribution). By classifying Word-Net’s relations into these classes, we are able to weight the contribution of a relation based on the class it belongs to, as opposed to assigning a con-tributory weight to each relations. For example, all relations of typeSimilarwill contribute equally to the semantic relatedness of words, and will con-tribute more than any relations of the class Hyper-nym. Table 1 shows the seven semantic categories that we defined, their corresponding weight, and the WordNet relations they include. The weights1 were simply assigned as a multiple of a small value α, representing the lowest weight, and an addition of 2 for each multiplier in the list in order to represent a higher cost of the less related cate-gories. Let us describe each category in detail.
The categorySimilar includes WordNet’s rela-tions of antonym, cause, entailment, similar to,
participle of verb,pertainymandverb group. This
1The weight can be seen as the cost of traversing an edge;
hence a lower weight is assigned to a highly contributory re-lation.
class of relations includes relations that are the most useful to compute semantic relatedness as per our manual corpus analysis and are the rarest available relations in the semantic network and hence was assigned the lowest weight of all cat-egories of relations:α.
The second category of semantic relations is the
Hypernymwhich includes WordNet’s relations of
hypernym, instance hypernym and derivationally related. Being less important than thesimilar rela-tions to compute relatedness, as shown in Table 1, theHypernymcategory was assigned a weight of (2×α).
TheSensecategory represents the relationship be-tween a word and its synset. Because a word can belong to several synsets, in order to favor the most frequent senses as opposed to the infrequent ones, the weight of this category is modulated by a factorβ. Specifically, we use (4×α+β), where
β is computed as the ratio of the frequency of the sense number in WordNet over the maximum number of senses for that word.
The fourth category of semantic relations is the
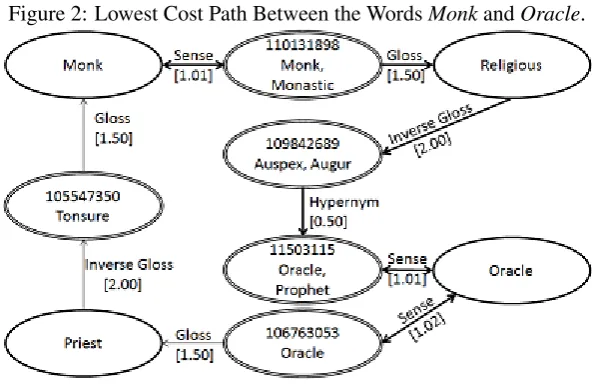
Figure 2: Lowest Cost Path Between the WordsMonkandOracle.
motor vehicle with four wheels, the hypernym of this synset is amotor vehicle, and the differentia is four wheel. There is no semantic relation ex-plicitly defined in WordNet betweencarandfour wheel, nor is there a relation with wheel. Even if a meronymy relation existed withwheelexisted in WordNet, it also should be more related to it than the rest of the meronymy relations as it is a defining attribute. To include such relations to the semantic network, we create an edge between ev-ery content word in the gloss and the synset, but only consider words that have an entry in the lexi-con. As this is a simplistic approach of adding the gloss relations, we gave it a high weight of (6×α), but less than the next category covering meronymy relations. The inverse of this edge (from a gloss word to a synset) is also included, but is consid-ered to be less related and thus included in the next category.
The fifth category is the Part category that in-cludesholonymy,meronymy, andinverse gloss re-lations which are all weighted as (8×α).
The sixth category, theInstancecategory, only in-cludes thehyponymyandinstance of hyponymy re-lations that are weighted as (10×α).
Finally, all others relations available in WordNet are grouped under the last category Other and given the maximum weight of (12×α).
3.3 Calculation of Semantic Relatedness
Given the weighted semantic network, the seman-tic relatedness,S(w1, w2), between two wordsw1
andw2is computed essentially as the weight of the
lowest cost path2 between the two words. How-ever, because the network is directed, the lowest cost fromw1 tow2,Pmin(w1, w2), may be
differ-ent than fromw2tow1,Pmin(w2, w1). To account
for this, we therefore consider the semantic relat-ednessS(w1, w2)to be equal to the highest relat-edness score in either direction. More formally, the semantic relatedness betweenw1andw2is de-fined as:
S(w1, w2) = max M −(Pmin(w1, w2)−K)
M ,
M−(Pmin(w2, w1)−K) M
!
Where,M is a constant representing the weight after which two words are considered unrelated, andK is constant representing the weight of true synonyms. In our implementation, we have set
M = 2×(12×α) corresponding to the maxi-mum of traveling twice the relation with the high-est weight, andK= 2×(4×α)corresponding to the minimum of traveling from a word to its sense and back to the word itself.
3.4 An Example
Figure 2 shows an extract of the network involving the wordsMonkandOracle. The lowest cost path fromMonk to Oraclein highlighted in bold. As the figure shows, the wordMonkis connected with aSenserelation to the synset#110131898 [Monk, Monastic]. As indicated in Table 1, the weight of this relation is computed as (4×α+β). Because
2The lowest cost path is based on an implementation of
Approach Category Pearson
(Gabrilovich and Markovitch, 2007) Corpus 0.72 (Hirst and St-Onge, 1998) Lexicon 0.74 (Wu and Palmer, 1994) Lexicon 0.78
(Resnik, 1995) Hybrid 0.80
(Leacock and Chodorow, 1998) Lexicon 0.82
(Lin, 1998) Hybrid 0.83
(Bollegala et al., 2007) Corpus 0.83 (Jiang and Conrath, 1997) Hybrid 0.85 (Tsatsaronis et al., 2010) Lexicon 0.86 (Jarmasz and Szpakowicz, 2003) Lexicon 0.87 (Hughes and Ramage, 2007) Lexicon 0.90 (Alvarez and Lim, 2007) Lexicon 0.91 (Yang and Powers, 2005) Lexicon 0.92 (Agirre et al., 2009) Hybrid 0.93
Our approach Lexicon 0.93
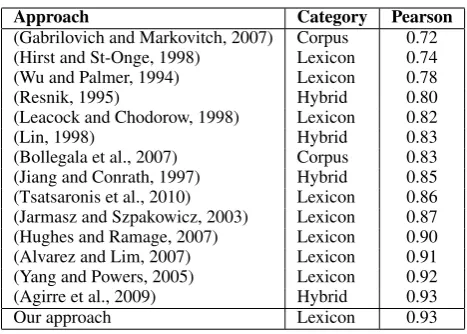
Table 2: Pearson Correlation of Various Approaches on the Miller and Charles Data Set.
this synset is the first sense (the most frequent sense given by WordNet) for the word Monk, then (β = 1/75 = 0.01, where 75 is the maximum number of senses for a word in WordNet. Ifαis set to 0.25, then, as shown in Figure 2, the weight of this edge is computed (4×0.25 + 0.01 = 1.01). The synset #11013898 [Monk, Monastic] is connected to the wordReligiousthrough aGloss
relation type. In WordNet, the gloss of this synset is: a male religious living in a cloister and devoting himself to contemplation and prayer and work. The content words are: male, religious, live, cloister, devote, contemplation, prayer, and
work, which are each related to this synset with the weight set to (6×α = 1.5).
Overall, the weight of the lowest cost path
Pmin(M onk, Oracle) is hence equal to
the sum of the edges shown in Figure 1 (1.01+1.50+2.00+0.50+1.01 = 6.02). As the figure shows, in this example, Pmin(M onk, Oracle)is
identical toPmin(Oracle, M onk). With the
con-stants M set to 6 and K to 2, S(M onk, Oracle) will therefore be (6-(6.02-2))/6 = 0.33.
4 Evaluation
To evaluate our approach, we used two types of benchmarks: using human ratings and using syn-onym tests.
4.1 Evaluation using Human Ratings
In their study on semantic similarity, Miller and Charles (1991) (M&C) gave 38 undergraduate stu-dents 30 pairs of nouns to be rated from 0, for no similarity, to 4, for perfect synonymy. The noun pairs were chosen to cover high, intermediate, and low level of similarity and are part of an earlier
study Rubenstein and Goodenough (1965) (R&G) which contained 65 pairs of nouns. The M&C test gained popularity among the research com-munity for the evaluation of semantic relatedness. The evaluation is accomplished by calculating the correlation between the average student’s ratings and one’s approach. The commonly used correla-tion measurement for this test is the Pearson cor-relation measurement (Pearson, 1900), but some have also used the Spearman ranking coefficient (Spearman, 1904) as an evaluation measurement. Our approach achieved a Pearson correlation of 0.93 and a Spearman correlation of 0.87 with the M&C data set. In addition, it achieved 0.91 Pear-son correlation and 0.92 Spearman correlation on the R&G data set.
For comparative purposes, Table 2 shows the Pearson correlation of several previous approaches to semantic relatedness measures against the same data set, as reported in their respective papers. For information, the table in-dicates the type of approach used: lexicon-based method, corpus-based method, or hybrid. As Table 2 shows, most other approaches achieve a correlation around 85%, while a few achieve a correlation above 90%. These results do not seem to be influenced by the type approach. Our approach compares favorably to the state of the art in the field on the Miller and Charles data set, with a high correlation of 93%. Our result is higher than any other lexicon based approach, however it must be noted that the Miller and Charles Data Set is quite small for empirical analysis.
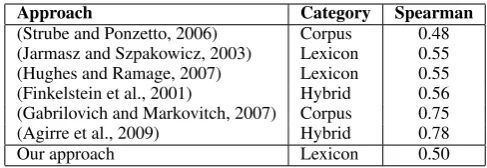
Approach Category Spearman
(Strube and Ponzetto, 2006) Corpus 0.48 (Jarmasz and Szpakowicz, 2003) Lexicon 0.55 (Hughes and Ramage, 2007) Lexicon 0.55 (Finkelstein et al., 2001) Hybrid 0.56 (Gabrilovich and Markovitch, 2007) Corpus 0.75 (Agirre et al., 2009) Hybrid 0.78
Our approach Lexicon 0.50
Table 3: Spearman Correlation of Various Approaches on WordSimilarity-353 Data Set.
Approach Category Accuracy
(Resnik, 1995) Hybrid 32.66%
(Leacock and Chodorow, 1998) Lexicon 36.00%
(Lin, 1998) Hybrid 36.00%
(Jiang and Conrath, 1997) Hybrid 36.00% (Hirst and St-Onge, 1998) Lexicon 62.00%
(Turney, 2001) Corpus 74.00%
(Terra and Clarke, 2003) Corpus 80.00% (Jarmasz and Szpakowicz, 2003) Lexicon 82.00% (Tsatsaronis et al., 2010) Lexicon 82.00%
Our Approach Lexicon 84.00%
Table 4: Results with the ESL Data Set.
(2001). The data set is much larger than the Miller and Charles Data Set and includes 353 pairs of words, each rated by 13 to 16 subjects who were asked to estimate the relatedness of the words on a scale of 0 for “totally unrelated words” to 10 for “very much related or identical words”. The com-mon practice with this data set is to the use the Spearman coefficient.
Table 3 shows various approaches and their corre-sponding Spearman correlation as described in the literature. On this data set, our approach achieved a correlation of 0.50, which is quite lower than the current state of the art. After analysing our results, we identified several reasons why our ap-proach did not perform as expected. First, all lexi-con based methods seem to perform poorly on this data set because it includes a number of named entities that are typically not available in a lexi-con. For example, in the word pair:(Maradona – football), the word Maradonadoes not appear in WordNet, hence favoring corpus-based and hybrid approaches. Another difficulty is the high variance of human ratings for some word pairs, which could be due to the subjectivity required for this task, or the fact that the subjects who rated the data set were not native English speakers. That being said, perhaps the most important factors for the poor performance is that most of the pairs in that data set require general world knowledge that is not usually available in a lexicon. Nevertheless, other approaches were able to achieve a high correlation
with this data set such as the machine learning ap-proach of Agirre et al. (2009) that achieved a high correlation of 0.78.
4.2 Evaluation using Synonym Tests
To test the approach further, we also evaluated it on synonym identification tests. This type of test includes an initial word and a set of options from which the most synonymous word must be selected.
The first synonym test that we experimented with is the English as a Second Language (ESL) test. The test set was first used by Turney (2001) as an evaluation of algorithms measuring the degree of similarity between words. The ESL test includes 50 synonym questions and each having four choices. The following is an example question taken from ESL data set:
Text: A rusty nail is not as strong as
a clean, new one.
Stem: rusty
Choices:
(a) corroded
(b) black
(c) dirty
(d) painted
Solution: (a) corroded
Approach Category Accuracy
(Resnik, 1995) Corpus 20.31%
(Leacock and Chodorow, 1998) Lexicon 21.88%
(Lin, 1998) Hybrid 24.06%
(Jiang and Conrath, 1997) Hybrid 25.00% (Landauer and Dumais, 1997) Corpus 64.38% Average non-English US college applicant Human 64.50% (Pad´o and Lapata, 2007) Corpus 73.00% (Hirst and St-Onge, 1998) Lexicon 77.91% (Jarmasz and Szpakowicz, 2003) Lexicon 78.75% (Terra and Clarke, 2003) Corpus 81.25% (Ruiz-Casado et al., 2005) Corpus 82.55% (MaTveeva et al., 2007) Corpus 86.25% (Tsatsaronis et al., 2010) Lexicon 87.50%
(Rapp, 2003) Corpus 92.50%
(Turney et al., 2003) Hybrid 97.50%
(Bullinaria and Levy, 2012) Corpus 100.00%
Our Approach Lexicon 91.25%
Table 5: Results with the TOEFL Data Set.
in Table 4. The results are measured in terms of accuracy - the percentage of correct responses by each approach. Our approach has achieved an accuracy of 84% on the ESL test, which is slightly better than the reported approaches in the literature. It should be noted that sometimes the difference between two approaches belonging to the same category are merely a difference in the data set used (Corpus or Lexicon) rather than a difference in the algorithms. Also, the ESL question set includes a sentence to give a context for the word, which some approaches (e.g. (Turney, 2001)) have used as an additional information source; we on the other hand, did not make use of the context information in our approach.
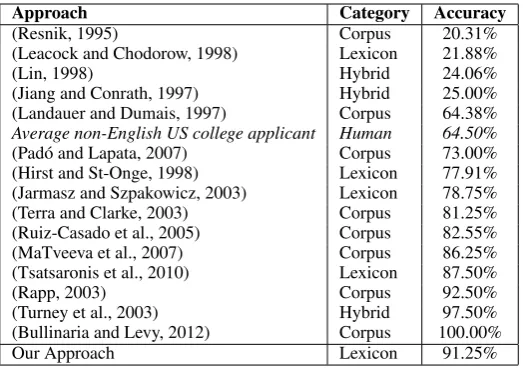
The second synonym test that we used is the Test of English as a Foreign Language (TOEFL) test. The test was first used by Landauer and Dumais (1997) as an evaluation for the algorithm measuring the degree of similarity between words. The TOEFL test includes 80 synonym questions each having four choices. The following is an example TOEFL question:
Stem: levied
Choices:
(a) imposed
(b) believed
(c) requested
(d) correlated
Solution: (a) imposed
The results on the 80 TOEFL questions are
shown in Table 5, which also includes the re-sults of other approaches for comparative pur-poses. Here again, the results are reported in terms of accuracy. As with the previous experiments, the category of the approach does not seem to have an impact on the results. It should be noted, how-ever, that some of the approaches have been tuned specifically for the TOEFL questions.
Table 5 also includes an entry for the “Average non-English US college applicant” of 64.5%. The score that was originally reported in Landauer and Dumais (1997) is 52.5% for college applicants, however this figure penalizes random guessing by subtracting a penalty of 1/3. To provide a more fair comparison, this penalty has been removed leading to a score of 64.5%. Our approach has achieved an accuracy of 91.25% on the TOEFL test, which is better than any of the reported lexi-con based approaches.
5 Conclusion