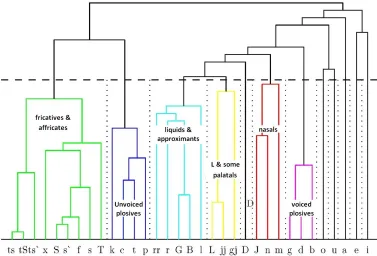
Figure 1: Dendrogram of the phoneme clusters
The aim of this paper is to show how to use an ASR database to develop CAPT systems for under-resourced languages and to evaluate how GOP scores behave in this environment, i.e. if we use a database not specifically designed for pronunciation evaluation. The rest of the paper is organized as follows: section 2 describes the database used in the experiments detailed in section 3 and section 4 presents the conclusions of the work.
2.
Database
CAPT systems use non-native vs. native recording data to better assess the learners' utterances, so that they all rely on specifically designed databases with both kinds of speech. Besides, most of the systems emphasize some problematic phonemes that are defined beforehand by experts for each of the different L1-L2 pairs. For that purpose, properly designed databases are built for the most usual L1-L2 language pairs (Cylwik et al., 2008). Basque is an under-resourced language that does not have enough acoustic databases to develop speech technologies that could compete with the major languages. Although there are some speech recognition databases for Basque, the only one which is publicly available (Hernaez, et al., 2003) was recorded over the fixed telephone network. Currently the priorities do not include the creation of a CAPT oriented database, and pronunciation teaching systems have to be developed with other available data. The database that had been used in these experiments was designed for the training and development of speech recognition for Basque and at the moment is not publicly available. It is a Speecon-like database, which contains recordings from native and non-native speakers, as well as dialectal and standard Basque data for the formers. It contains data from a total of 230 speakers, collected in different places of the Basque Country, where Basque has different official status, health and phonetic influence of neighbouring languages (mainly French and Spanish).
During the recording of the database the speakers were asked about their knowledge level of the language. The native speakers' subcorpus is composed by 149 speakers; non-native speakers speak Basque as a second language at different levels: the high level non-natives' subcorpus includes 56 speakers and the low level non-natives' subcorpus 25. Due to the dialectal variation and also to the different level of fluency, there are several irregularities in the pronunciation of several phonemes, which are not labelled in the transcription. However, they can be partially deduced from the information provided about the speaker. For example, we can obtain information about the region of the speakers and their Basque level through the labels that indicate their city of birth, city of youth and language level. The audio files have their corresponding orthographic transcription file, and the rule-based P2G transcriptor for Basque has been used to obtain the standard Basque phonetic transcriptions.
A mean of 170 files have been used per speaker. 60 of these files contain elicited speech, where the speaker is asked to read different types of texts (dates, numbers, phonetically rich sentences and the like), and the remaining 110 are commands, which are composed mainly by isolated words.
3.
Experiments
After obtaining a set of scores for each phoneme, transcription errors have been inserted in each dictionary transcription, by selecting one triphone randomly and replacing it by another triphone of the same phoneme group, selected also in a random way. To obtain these groups a GMM model of one mixture has been trained for each phoneme using Basque SpeechDat-EU (Hernaez, et al., 2003) and a phonetic clustering has been performed using regression trees. Figure 1 shows the dendrogram with the obtained phoneme clustering.
When making the phoneme substitutions in the transcriptions, the context-dependency has also been changed, thus keeping the coherency in the transcriptions. Then, a new forced alignment experiment has been carried out to obtain the GOP scores for each inserted phoneme; in other words, the GOP scores corresponding to a phoneme in a simulated erroneous utterance are obtained.
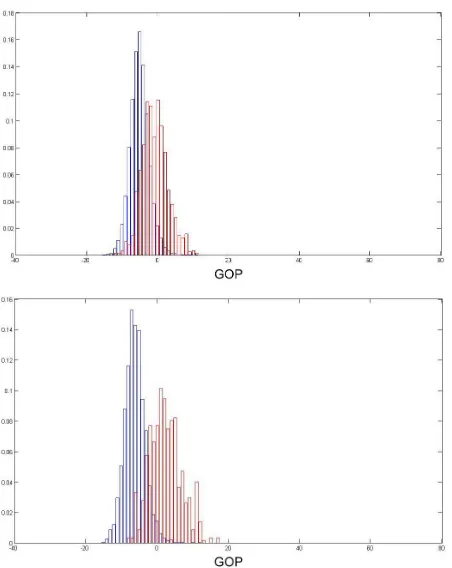
Since the amount of scores in simulated erroneous utterances is much smaller than those for correct utterances the process of random triphone substitution was repeated three times, in order to obtain more data. Then, the histograms of both distributions are calculated for each phoneme, joining all the scores corresponding to the same phoneme. An example of the distribution of the scores corresponding to the phoneme /a/ can be seen in Figure 2, where both separate density functions appear. Note that the phonemes in this paper are represented by their SAMPA code1.
At first glance, it was observed that there were some potentially problematic phonemes with overlapping distributions. This could be due to the differences in the pronunciation of some phonemes between native and non-native speakers, especially in those phonemes that do not exist in the L1 of the speaker, as the /ts`/ or the /s`/. Since the HMMs had been trained ignoring this fact, new HMMs were built again, using only the native speakers that were born and live in the east area of the country, since in the west area the /s`/ phoneme is not pronounced today —it merged with the /s/ —. So, 76 eastern Basque speakers have been used to train the new HMMs and 13 eastern Basque speakers have been reserved for testing
1
http://aholab.ehu.es/sampa_basque.html
purposes. With these new HMMs all the procedure was repeated, and new score distributions were obtained. A significant separation between the distributions of the problematic phonemes was observed. An example is shown in Figure 3.
The next step was to set the thresholds that we will use to classify each phoneme as correctly or wrongly pronounced. These thresholds are obtained by calculating for each phoneme the EER derived from the GOP score distribution functions.
Three different tests were performed in order to evaluate the designed strategy. In all the tests, the GOP scores of all the phonemes have been calculated using a forced alignment procedure and have been compared with the thresholds calculated beforehand.
In a first experiment (Test 1) the tests were performed using the recordings of the 13 native speakers reserved beforehand. The transcriptions of the speech corresponding to these speakers are not checked, but we assume that there is no error in these transcriptions and that all the speakers pronounced all the phonemes properly. So, we assume that the phonemes that the system evaluates as correct are really correct (CA, correctly accepted) and the phonemes that the system evaluates as incorrect are considered false rejects (FR, falsely rejected).
A second test (Test 2) was performed using the recordings of the speakers with “low level” skills in L2, 25 in total. Even though we cannot predict a priori if a phoneme was correctly or incorrectly pronounced, the tests were carried out without having into account any kind of linguistic knowledge and labelling, in order to see the performance of the system at first sight.
Figure 2: Normalized histograms of the GOP scores of the phoneme /a/: the blue bars represent the distribution of scores in a correct utterance; the red bars represent
the distribution of scores in a simulated erroneous utterance
Figure 3: Normalized histograms of the GOP scores of the phoneme /ts`/ obtained with HMMs trained using
The results have been evaluated using the SA measure (Scoring Accuracy):
SA = ((CA+CR)/(CA+CR+FA+FR))*100; (2)
where: CA: Correctly Accepted; CR: Correctly Rejected; FA: Falsely Accepted; FR: Falsely Rejected. In these experiments (Test1 and Test2) CR is 0.
/a/ /u/ /ts`/ /s`/
Test 1
Realiz. 5.524 1.937 750 1.317
SA 86,22 % 89,67 % 83,73 % 74,26 %
Test 2
Realiz. 9.923 3.481 1.438 2.469
SA 84,06 % 87,33 % 41,59 % 49,49 %
Table 1: Number of realizations and SA for the phonemes /a/, /u/, /ts`/ and /s`/ in tests 1 and 2.
As it is shown in Table 1, the SAs of the phonemes /a/ and /u/ have a small variation from one test to the other, but the SAs of the /ts`/ and /s`/ (phonemes that do not exist in Spanish) fall significantly, especially in the case of the /ts`/. This means that the realizations of some phonemes by Basque learners are very close the native speakers’ realizations, while other phonemes are pronounced in quite a different way.
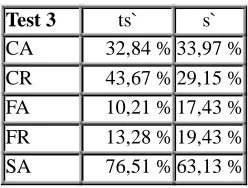
Finally, we focused the next experiment on the phonemes that show a worst SA in Test 2. A linguist expert labelled the realizations of these phonemes of 14 speakers from the subcorpus of the low level learners as correct or not correct. In the case of the /ts`/ there are 813 realizations, where 375 have been labelled as correct and 438 as not correct. For the phoneme /s`/, 1.348 realizations have been labelled; 720 were labelled as correct and 628 as not correct. Considering these labels, Test 3 was performed, and the results of Table 2 were obtained.
Test 3 ts` s`
CA 32,84 % 33,97 % CR 43,67 % 29,15 % FA 10,21 % 17,43 % FR 13,28 % 19,43 % SA 76,51 % 63,13 %
Table 2: Results of comparing the automatically generated labels with the labels assigned by a linguist expert, for
phonemes /ts`/ and /s`/.
We can see that the SAs of Test 3 (Table 2) are now closer to the ones obtained in Test 1 (Table 1) compared with the results of Test 2. This confirms the existence of incorrectly pronounced phonemes in the database. The results of the phoneme /ts`/ show that the distribution separation that we have obtained training HMMs with only native speakers' data (shown in Figure 3) has been useful to calculate decision thresholds. The less accurate results for the phoneme /s`/ can be interpreted taking into account that nowadays this sound does not exist in a big area of the Basque Country, so that even some native speakers of the eastern side may be influenced by this
fact.
From a general point of view, the results show that our system is able to detect both correctly pronounced phonemes in an utterance and incorrectly pronounced ones, focusing especially on phonemes that do not exist in the L1 of the learners. We have found that there are great differences between the skills of the speakers of the "low level" subcorpus, maybe because the classification of the database comprises only two skill levels: low and high. The system, as expected, discerns much better the incorrect pronunciations of the lowest level speakers. Comparing the results with those obtained in (Kanters et al., 2009), we have achieved smaller SAs for the phonemes that do not exist in the L1 of the speaker, but better results for phonemes that the speaker already knows from his/her native language. So, we can consider that the mean SA is higher than those corresponding to the conflictive phonemes. Further analysis is needed to check the exact overall value of SA, but, as a conclusion, the results validate the followed strategy to obtain the thresholds for the decisions.
4.
Conclusion
A new method to use a general purpose ASR speech database to build CAPT systems for under-resourced languages has been described in this paper. A method to automatically determine the threshold of goodness of pronunciation (GOP) has been proposed. This method uses a strategy of introducing controlled errors in the transcriptions of the dictionary words, in order to obtain the distribution of the GOP scores of incorrectly pronounced phonemes. Different experiments have been described using different sets of speakers to test the system, and the results show that this method can be very useful to evaluate the utterances of learners with lowest levels.
The final goal of this work is to include it in a CAPT system for Basque that is currently under development. Future works will analyze how these GOP score distributions (and, therefore, the thresholds) behave in real conditions channels. Under these circumstances, the possibility of adaptation of the HMM models will be an important point to develop. Future works will analyze, as well, the needs to deal with the pronunciation errors of the L2 learners of higher level.
5.
Acknowledgements
This work has been partially supported by the Basque Government (Berbatek, IE09-262), the University of the Basque Country (UE-08/11) and the Spanish Ministry of Science and Innovation (Buceador Project, TEC2009-14094-C04-02).
6.
References
Cylwik, N, Demenko, G, Jokisch, O., Jäckel, R., Rusko, M., Hoffmann, R., Ronzhin, A., et al. (2008). The use of CALL in acquiring foreign language pronunciation and prosody–general specifications for Euronounce Project. In Proc. SASR, pp. 123-130.
ASR-based pronunciation tutoring system. In SlaTE.
Demenko, Grazyna, Cylwik, Natalia, & Wagner, A. (2009). Applying speech and language technology to foreign language education. In 2009 International Multiconference on Computer Science and Information Technology, 2, pp. 457-463.
Eskenazi, M. (1996). Detection of foreign speakers' pronunciation errors for second language training – preliminary results. In ICSLP'96. Philadelphia, PA, USA.
Franco, H. (2000). Combination of machine scores for automatic grading of pronunciation quality. Speech Communication, 30(2-3), pp. 121-130.
Hamada, H., Miki, S., Nakatsu, R. (1993). Automatic evaluation of English pronunciation based on speech recognition techniques. IEICE Trans. Inform. Syst. E76-D (3), pp. 352-359.
Hernaez, I., Luengo, I., Navas, E., Zubizarreta, M., Gaminde, I., Sanchez, J. (2003). The Basque speech_dat (II) database: a description and first test recognition results, In Eurospeech-2003, pp. 1549-1552.
Hiller, S., Rooney, E. Laver, J., Jack, M. (1993). SPELL: An automated system for computer-aided pronunciation teaching. Speech Communication 13, 463-473.
Kanters, S., Cucchiarini, C., Strik, H. (2009). The goodness of pronunciation algorithm: a detailed performance study, In SLaTE-2009, pp. 49-52.
Kawai, G., Hirose, K. (1997). A CALL system using speech recognition to train the pronunciation of Japanese long vowels, the mora nasal and mora obstruent. In Proc. EUROSPEECH'97. Rhodes, Greece.
Kim, Y., Franco, H., Neumeyer, L. (1997). Automatic pronunciation scoring of specific phone segments for language instruction. In Proc. EUROSPEECH'97. Rhodes, Greece.
Learning Village. Educational Software Review, Retrieved on 15th July 2008 from http://www.learningvillage.com/html/guide.html Mak, B., Siu, M., Ng, M., Tam, Y.-cheung, Chan,
Y.-chung, Chan, K.-wah, Leung, K.-yee, Ho, S., Chong, F.-ho, Wong, J., Lo, J. (2003). PLASER: Pronunciation Learning via Automatic Speech Recognition. In HLT-NAACL Workshop on Building Educational Applications using Natural Language Processing.
Rogers, C., Dalby, J., DeVane, G. (1994). Intelligibility training for foreign-accented speech: A preliminary study. J. Acoust. Soc. Amer. 96 (4), pt. 2.
Ronen, O., Neumeyer, L., Franco, H. (1997). Automatic detection of mispronunciation for language instruction. In Proc. EUROSPEECH'97. Rhodes, Greece.
Witt, S., & Young, S. J. (2000). Phone-level pronunciation scoring and assessment for interactive language learning. Speech