PERFORMANCE-BASED EARTHQUAKE ENGINEERING
Thesis by Judith Mitrani-Reiser
In Partial Fulfillment of the Requirements for the Degree of
Doctor of Philosophy
CALIFORNIA INSTITUTE OF TECHNOLOGY
Pasadena, California 2007
© 2007
Acknowledgements
I would like to thank my advisor, James Beck for sharing his wisdom with me so patiently throughout the years. I am extremely appreciative for his careful and thoughtful mentoring, for his unwavering support of my work, and for never cutting a meeting short. He has taught me to be a thorough scientist, and I would be fortunate to count him as a collaborator in years to come.
Thanks also to my committee members, for their insightful discussions and recommendations. Special thanks to Keith Porter, whose expertise has helped guide my work for the past four years. Thanks to Mary Comerio, whose passion for seismic risk management gives meaning to my work. Thank you also to John Hall and Tom Heaton for impromptu discussions that ground my work.
This work has been possible thanks to funding from the George Housner Fellowship and from grants provided by the Pacific Earthquake Engineering Research (PEER) Center. A special thank you to my PEER collaborators: Howard Blecher, Gregory Deierlein, Christine Goulet, Curt Haselton, and Jonathan Stewart. Thank you to Gee Hecksher, Vivian Gonzales, Charles Scawthorn, and Fire Captain Danny DeAngelis for consulting and assisting on my project.
others. Thank you also to the Dickinson Lab for making me an honorary member; a special thank you to Phoebe Dickinson, Usha McFarling, and Fatimah Johnson for being such caring friends.
I wish to acknowledge the tireless work of the Caltech staff that make the work environment such a pleasure; in particular Brandi Jones, Perendah Kia, Martha Oropesa, Carolina Oseguera, Elvira Serpe, and Ernie, whose daily lunch specials I will miss.
I am grateful to my in-laws, Sammy and Barbara Reiser for raising a mench, and I thank them and the extended Reiser family for unselfishly sharing their love with me. I warmly thank my California-based cousins, the Ramirez, Maya, Suissa and Stigmon families, who have opened their homes and hearts so graciously during our stay in California.
I would like to especially thank my parents, Julio and Elisa Mitrani, for their unconditional love and support throughout the years. I am so grateful for the sacrifices they made in their own lives to seek a better life for their children in America. I am blessed to have them as role models; I will never stop learning from them. I would also like to thank my second set of parents, my grandparents Fortuna and Victor Mitrani, who keep me well fed, love me, and continue to nurture me. I would like to thank my loving sister, Susana, who has always been my confidant and protector; our relationship is strengthened with each new stage of life. Thank you also to my dear brother-in-law, Albert Marroquin who has brought so much happiness to our family and who can appreciate good college football (Go Gators!).
Abstract
Performance-based earthquake engineering (PBEE) is a methodology that incorporates desired performance levels into the design process. Performance in PBEE can be expressed in economic terms, or as elapsed downtime, or in terms of life and building safety objectives. These performance objectives are relevant to various types of stakeholders. They should be addressed in building loss estimation procedures because after an earthquake, the repair cost will not be the only “loss” suffered by building stakeholders. In a sizeable earthquake, there will likely also be some losses due to business interruption during the repair effort, building closure taken as a post-earthquake safety precaution, and human casualties caused by building failures during the seismic event.
expected annual losses.
Contents
Acknowledgements v
Abstract vii
Contents ix
List of Figures xiii
List of Tables xvii
Introduction 1
1.1 Earlier work in performance-based earthquake engineering 2
1.2 Beyond Vision 2000 5
1.3 PEER 8
1.4 ATC-58 9
1.5 Plan for thesis 11
Performance-Based Earthquake Engineering Framework 13
2.1 PEER’s PBEE methodology 13
2.2 Introduction to PEER benchmark study 16
2.2.1 PEER benchmark building and site 17
2.2.2 Damageable structural components 18
2.3 PEER benchmark PSHA 25
2.4 PEER benchmark structural analysis 28
2.4.1 Three-dimensional considerations 30
2.5 MDLA toolbox 33
2.5.1 MDLA input: Table of damageable assemblies 34 2.5.2 MDLA input: Table of fragility and cost distribution functions 35
2.5.3 MDLA input: Structural analysis results 35
2.5.4 Program architecture 37
2.5.5 Program output 38
Damage Estimation 41
3.1 Procedure for damage analysis 41
3.2 Fragility functions for benchmark study 42
3.2.1 Beams and columns 43
3.2.2 Column-slab connections 47
3.2.3 Drywall partitions and finish 48
3.2.4 Interior paint 49
3.2.5 Exterior glazing 51
3.2.6 Ceiling 52
3.2.7 Sprinklers 53
3.2.8 Elevators 54
3.3 Damage results for benchmark study 56
Building and Life Safety 67
4.1 Building safety 67
4.1.1 ATC 20 68
4.1.2 Virtual inspector 69
4.1.3 Building safety results for benchmark study 72
4.2 Life safety 78
4.2.1 History of fatality modeling 78
4.2.2 Methodology and example of fatality estimation 84
5.2 Component cost distribution for benchmark study 94 5.3 Results of vulnerability functions for benchmark study 100
5.3.1 Results for design comparisons 100
5.3.2 Results for modeling comparisons 103
5.4 Calculation of expected annual loss due to repairs 106
5.4.1 Disaggregation of EAL 107
5.4.2 Discussion of results 109
Estimation of Indirect Losses and Benefit-Cost Analysis 111
6.1 Building downtime 112
6.1.1 Rational components of downtime 112
6.1.2 Irrational components of downtime 114
6.1.3 Methodology and example of downtime losses 116 6.1.4 Downtime loss results for benchmark building 121 6.1.5 Comparison of downtime results with university studies 124
6.2 Expected annual losses due to fatalities 126
6.2.1 Human loss results for benchmark building 127 6.3 Total expected annual losses for benchmark building 128
6.4 Illustrative benefit-cost analysis 129
Concluding Remarks 133
7.1 Significant results and major contributions 133
7.1.1 Chapter 2: Performance-based earthquake engineering framework 133
7.1.2 Chapter 3: Damage estimation 134
7.1.3 Chapter 4: Building and life safety 135
7.1.4 Chapter 5: Estimation of direct losses 136
7.1.5 Chapter 6: Estimation of indirect losses and benefit-cost analysis 137
7.2 Limitations of research 138
7.3 Future directions 140
List of Figures
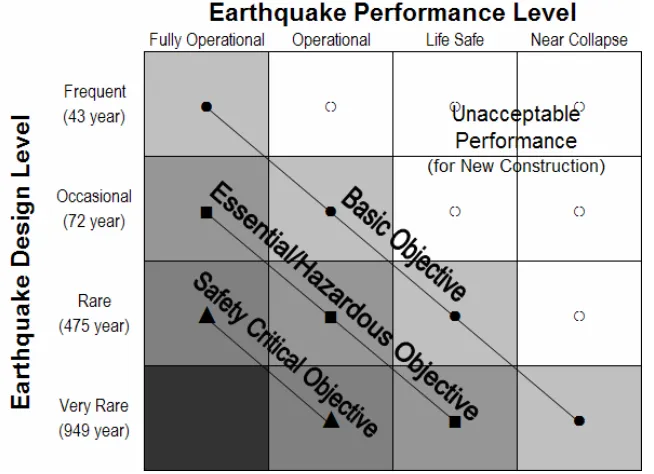
Figure 1.1. Recommended seismic performance objectives for buildings. The mean recurrence intervals of 43 years, 72 years, 475 years, and 949 years correspond to Poisson arrival events with 50% probability of exceedance in 30 yrs, 50% in 50 yrs, 10% in 50
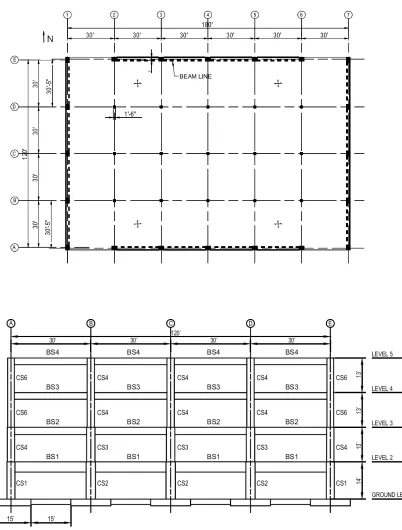
yrs and 10% in 100 years, respectively (after SEAOC 1995). 4 Figure 2.1 Schematic of PEER methodology (Porter 2003). 16 Figure 2.2 Plan and elevation views of the perimeter-frame benchmark
building (reproduced from Haselton et al. 2007). 20
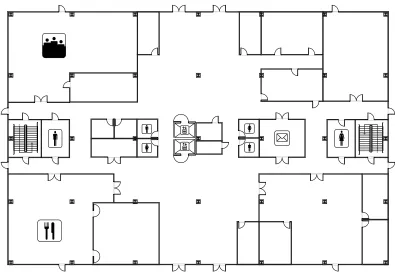
Figure 2.3 Floor plan of ground floor. 21
Figure 2.4 Floor plan of floors 2–4. 21
Figure 2.5 Automatic sprinkler piping system of ground floor. 22 Figure 2.6 Automatic sprinkler piping system of floors 2–4. 22 Figure 2.7 Mean uniform hazard spectra (5% damping) for the LA Bulk
Mail site for seven hazard levels (reproduced from Goulet et al., 2006). The spectral acceleration at T=1 sec is used for the benchmark study, so the hazard levels shown in this plot correspond to Sa(T=1 sec) = 0.10 g, 0.19 g, 0.26 g, 0.30 g,
0.44 g, 0.55 g, 0.82 g. 28
Figure 2.8 Static pushover curves for the fiber and lumped-plasticity models of one design variant (Design A) of the benchmark building,
reproduced from Goulet et al. (2007). 30
Figure 2.9 EDP numbering for structural components in the N-S and E-W
directions. 31 Figure 2.10 Combinations for DDI for biaxially loaded columns. 32
Figure 2.11 Biaxial moment relationship for columns (reproduced from ACI
1990). 33 Figure 2.12 Input and output parameters for the MDLA toolbox. 34
Figure 2.13 Fitted and empirical cumulative distribution fucntions of peak
roof drift ratio (EW-dir) results for four levels of IM. 37
Figure 2.14 Schematic of MDLA toolbox. 39
Figure 3.1 Fragility functions for RC moment-frame members. 46 Figure 3.2 Fragility functions for column-slab connections. 48 Figure 3.3 Fragility functions for the wallboard partitions. 49
components, and (b) all nonstructural components. 99 Figure 5.7 (a) Vulnerability functions for variants #1 and #2, 102 Figure 5.8 (a) Vulnerability functions for variants #1 and #6, 103 Figure 5.9 (a) Vulnerability curves for variants #1 and #11, 105 Figure 5.10 Vulnerability curves for variants #1, #13, #14 and #15. 106 Figure 5.11 A disaggregation of the expected annual loss for Design A
(VID #1). 107
Figure 6.1 Gantt chart for fast-track repair scheme applied to an example
3-story steel frame building (reproduced from Beck at al. 1999). 117 Figure 6.2 Gantt chart showing fast-track repair scheme at two hazard levels
for Design A (VID #1). 122
Figure 6.3 A comparison of the total downtime and the irrational and rational components of downtime for the baseline perimeter-frame (Design A, VID #1) and space-perimeter-frame (Design E, VID #6)
List of Tables
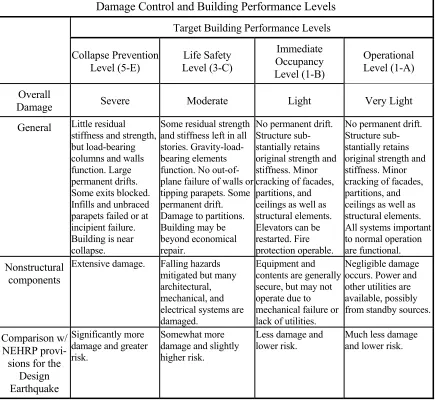
Table 1.1. Target Building Performance Levels, reproduced from Table C1-2 in FEMA 356 (FEMA C1-2000), describing the range of damage of structural and nonstructural components for various target
building performance levels. 7
Table 1.2. Criteria for assigning structural performance level to concrete frame members, reproduced from Table C1-3 in FEMA 356
(FEMA 2000). 8
Table 1.3. Criteria for assigning nonstructural performance level to concrete frame members, reproduced from Table C1-5 in FEMA 356
(FEMA 2000). 11
Table 2.1 Damageable structural components in the benchmark building. 19 Table 2.2 Damageable nonstructural components in the benchmark
building. 24 Table 2.3 Table of damageable assemblies for perimeter-frame design. 24
Table 2.4 Table of damageable assemblies for space-frame design. 25 Table 2.5 Summary of assembly fragility and cost distribution parameters. 36 Table 3.1 Williams et al. (1997) damage states and consequences for
concrete columns. 43
Table 3.2 Stone and Taylor (1993) damage states and consequences for
concrete columns. 45
Table 3.3 Summary of benchmark building designs and structural models. 56 Table 4.1 Summary of virtual inspector results of various benchmark
building designs for three largest hazard levels. 77 Table 4.2 Death and injury ratios from some major U.S. earthquakes. All
entries, but the last, are from NOAA (1972). 80
Table 4.3 Comparison of fatality models that is disaggregated by building type and damage quantity (modified from Table 19 in Shoaf
and Seligson, 2005). 83
Table 4.4 Mean and variance of fatality models for local collapse and global
for benchmark building’s damageable assemblies (Hecksher
2006). 114 Table 6.2 Design variant descriptions, corresponding downtime (irrational,
rational and total downtimes) results at each hazard level, and
EALD results. 123
Table 6.3 Expert-based estimates of downtime for the U.C. Berkeley campus based on building type and size, and extent of damage
(reproduced from Comerio 2006). 126
Table 6.4 Design variant descriptions and corresponding expected annual number of fatalities (EANF) and the expected annual loss due
to fatalities (EALF). 128
Table 6.5 Summary of expected annual losses for the three decision
CHAPTER 1
Introduction
Performance-based earthquake engineering can be defined as the assessment of expected system-level performance of a structure subjected to seismic excitation, as well as the detailed design of its structural and nonstructural features to achieve prescribed performance goals. These performance goals may be described at various levels: performance of structural members (e.g., probability of minor cracking of reinforced concrete members), performance of nonstructural elements (e.g., probability of functionality of essential utilities), global performance (e.g., probability of collapse), building safety (e.g., probability of red tagging), life safety (e.g., probability of number of lives lost), and equivalent economic performance metrics (e.g., exceedance probabilities for levels of repair cost).
The economic repercussions of U.S. earthquakes cannot be understated—massive losses can be attributed to several earthquakes of the last four decades alone, including the 1994 Northridge earthquake ($17–$26 billion), the 1989 Loma Prieta earthquake ($11 billion), the 1964 Anchorage earthquake ($3.2 billion), and the 1971 San Fernando earthquake ($2.7 billion).1 Considering the substantial economic impact of earthquakes, the adoption of performance-based earthquake engineering methods by the professional civil engineering
community will result in the prevention of unnecessary future losses. Hence the title of this dissertation, excerpted from Benjamin Franklin’s well-known advice: “An ounce of prevention is worth a pound of cure.”2
1.1
Earlier work in performance-based earthquake engineering
In a broad sense, performance-based earthquake engineering has its origins in the early 20th century: seismic design provisions of early U.S. building codes, beginning with the 1927 Uniform Building Code (PCBO 1927), sought to “permit structures to withstand earthquakes without collapse or endangerment of life safety” (Hamburger and Moehle 2000). In the 1970s, code requirements were added to enhance damage control for important facilities. Modern building codes (e.g., ICC 2003; ASCE 2006) provide design guidelines intended to achieve a specific performance objective (life safety and some degree of damage control), given a particular hazard (e.g., FEMA (2000)) specifies effects that are 2/3 those of the maximum considered earthquake, defined as an event producing a ground motion intensity with a 2% exceedance probability in 50 years).
New documents have been published in recent years that attempt to provide for more-robust performance-based seismic design. The first of these was Vision 2000 (SEAOC 1995), written by practicing engineers and scholars in an attempt to “embrace a broader scope of design and construction quality assurance issues and…yield more predictable seismic performance over a range of earthquake demands.” Vision 2000 describes various hazard levels: the frequent intensity level with a 50% exceedance probability in 30 years hazard level, the occasional intensity level with a 50% exceedance probability in 50 years, the rare intensity level with a 10% exceedance probability in 50 years, and the very rare intensity level with a 10% exceedance probability in 100 years. Vision 2000 also defines various structural performance levels: fully operational, operational, life safe, and near collapse in terms of damage to structural and nonstructural components and in terms of
consequences to the occupants and functions carried on within the facility. Vision 2000 offers relationships between these hazard and performance levels for various building categories. This relationship is shown graphically in Figure 1.1, which shows the performance level that should be satisfied for the given hazard level and the type of structure. The diagonal lines representing different “objectives” in this figure correspond to different facility types (e.g., a facility with large quantities of toxic material that has a large impact if damaged is categorized as a safety critical objective; a hospital or police station is considered an essential objective; a facility with hazardous materials that has limited impact if damaged is considered a hazardous objective; residential and most commercial buildings are categorized as basic objective).
In 1996, the Applied Technology Council (ATC 1996b) published Seismic Evaluation and Retrofit of Concrete Buildings (ATC-40). In 1997, the Federal Emergency Management Agency (FEMA 1997a, b) published the National Earthquake Hazards Reduction Program (NEHRP) Guidelines for the Seismic Rehabilitation of Buildings and associated Commentary documents (FEMA 273 and 274, 1997). These documents, prepared by the Building Seismic Safety Council, addressed the rehabilitation of existing structures, and led to the most comprehensive guidelines for PBEE to date: the Prestandard and Commentary for the Seismic Rehabilitation of Buildings (FEMA 356, 2000).
performance levels and descriptions of corresponding physical damage are shown in Table 1.1.
There are many tables in FEMA-356 for specific performance levels for various structural systems (e.g., for concrete frames, braced steel frames, metal deck diaphragms) and for nonstructural systems (e.g., for glazing, piping, cladding). These tables also include some engineering limit states (e.g., drift values) believed to correspond to the various performance levels for a particular component. These limit states are not intended to be used as acceptance criteria or in the postearthquake evaluation of damage, but are instead indicative of the range that exists for the limit states that typical structures undergo.
Figure 1.1. Recommended seismic performance objectives for buildings. The mean recurrence intervals of 43 years, 72 years, 475 years, and 949 years correspond to Poisson arrival events with 50% probability of exceedance in 30
1.2
Beyond Vision 2000
Although the development of PBEE has been progressing in recent years, current methods have several limitations, such as a lack of a consistent procedure for ground motion selection corresponding to a given hazard level and the analysis of structural elements. Perhaps the most notable limitation of existing methods is the use of component-level acceptance criteria, as opposed to probabilistic system-level performance criteria. In FEMA 356, any combination of repaired elements, undamaged existing elements, and new elements is modeled using specified procedures and compared against performance-level acceptance criteria; the ultimate goal is to pass the criteria agreed upon by the stakeholder and structural engineer. By contrast, the goal of the methodology used in the present study is to quantify performance using probabilistic measures on quantities that are of direct interest to building stakeholders, namely: repair costs, life safety, and postearthquake operability (“dollars, deaths, and downtime”).
Although FEMA 356 does not attempt to quantify the probability of achieving a given performance level or to quantify repair costs, number or likelihood of fatalities, or loss-of-use duration, it does address component-level and system-level damage states and relates them to life safety and postearthquake operability, as shown in Table 1.1. However, it can be difficult to use these relationships to quantify dollars, deaths, and downtime. The damage states given in FEMA 356 tend to be qualitative and open to multiple interpretations. Tables 1.2 and 1.3, reproduced from FEMA 356, give various examples of the qualitative language used to describe damage states for concrete frame systems, cladding, glazing, partitions, and ceilings. Some examples of this language are: minor, distributed, some, many, extensive, and most. Such qualitative language is difficult to employ in a quantitative, probabilist ic model of damage and loss, especially considering that some of the categories of building components addressed in the tables are quite broad.
(Chapter 3). These fragility functions are used to establish correspondence between the values of structural response and specific damage states in a probabilistic way. As used in this thesis, a fragility function quantifies the probability that a particular type of component will reach or exceed a clearly defined damage state as a function of the structural response to which it is subjected. These resulting probabilities of damage for building components are used to estimate losses from future seismic events (i.e., repair costs, fatalities, and downtime).
Another limitation of damage and loss assessment in current PBEE procedures is the lack of a standard methodology and consistent data for the development of new fragility functions. A clear definition of the damage states and the corresponding fragility functions are necessary for every damageable building component considered in the damage assessment. Similarly, clear definitions of the repair efforts and the probabilistic repair costs associated with the damage states are required for all damageable components. In the last few years, there has been much advancement in the development of fragility and cost distribution functions for damageable building components, but much work is still needed in this area to cover the wide range of damageable components present in real buildings. To overcome this paucity of data, some researchers have suggested the use of a lumping scheme of nonstructural components to create story fragility functions. The use of these story fragility functions is a good solution if performing approximate damage assessment in the absence of empirical damage data, but not when component-specific fragility functions are available that allow a more detailed understanding of the building’s performance to be obtained.
• PEER Strong Motion Database: a compilation of over 1,500 records from 143 different earthquakes in a web-accessible format, including more accurate characterizations of site conditions at various strong motion stations (Moehle and Deierlein 2004; PEER 2005a). http://peer.berkeley.edu/smcat/
• OpenSees Software: the Open System for Earthquake Engineering Simulation is an open-source computational platform for structural and geotechnical analyses that includes improved models for reinforced-concrete structures, shallow and deep foundations, and liquefiable soils (Moehle and Deierlein 2004; OpenSees 2006). http://opensees.berkeley.edu/
• Structural Performance Database: a compilation of over 400 cyclic, lateral-load tests of various types of reinforced concrete columns, e.g., columns with rectangular, circular, and octagonal cross sections (PEER 2005b). http://nisee.berkeley.edu/spd/
1.4
ATC-58
A new project is underway by the Applied Technology Council (ATC) to develop the next-generation guidelines for performance-based earthquake engineering design. This project is sponsored by FEMA and is known as ATC-58; it has an advisory committee composed of experts from various fields including engineers, architects, government officials, social scientists, and researchers. Although FEMA-356 addresses component-level and system-level damage states and relates them to various qualitative performance system-levels in guidelines for the rehabilitation of existing structures (which rely heavily on the designing engineer’s opinion), it is not an ANSI3-approved standard for performance-based seismic design of new buildings. The goal of ATC-58 (Whittaker et al. 2004) is to create a standard for the design of new structures and the upgrade of existing ones that incorporates the building performance level desired by the stakeholders into the design process, using clear and quantitative definitions for building performance (i.e., life safety, building operability, and economic losses). The project is divided into two parts, and the ATC-58 committee is currently working on the first phase, which is to develop the “performance verification procedure.” This procedure is what engineers will use to evaluate whether the building design meets the prescribed objectives set by stakeholders. The second phase of the project
will be to develop the design guidelines for engineers and to generate the building performance guidelines to help direct stakeholders; the second phase will likely begin in a few years.
Although the first phase of ATC-58 is not yet complete, an interim report is currently available (representing 25% of the planned document) that outlines the framework for performance assessment (ATC 2005). This report gives two levels for assessment that are appropriate for different steps of the design process (i.e., if the design process is in its early stages, the details of the building will not be known and gross estimates must be made to determine building performance and estimate future losses). Also, ATC-58 provides the following assessment types: intensity based, scenario based, and time based. The intensity- based assessment determines the probability of loss for a given hazard level; the scenario-based assessment determines the probability of loss for a specified seismic event; the time-based assessment addresses the probability of loss over a given time period, such as the design life of the structure. Each of these assessments addresses different concerns that stakeholders are likely to have.
CHAPTER 2
Performance-Based Earthquake Engineering
Framework
The PEER framework for performance-based earthquake engineering (PBEE) has been developed to estimate the performance of structures in seismic-prone regions. The methodology for implementing this modular framework is described in detail in this chapter. Also, this chapter introduces a recent benchmark study that applies the methodology to determine the performance of several designs of a new reinforced-concrete moment-frame commercial building, and clearly states the assumptions made for this implementation. In addition, the software developed for the purpose of estimating the damage and losses for the benchmark study, the MDLA toolbox, is described in some detail.
2.1
PEER’s PBEE methodology
rate of X given Y, IM denotes an intensity measure (e.g., Sa(T1)), EDP denotes engineering
demand parameters (e.g., drift and plastic rotations), DM denotes damage measures (e.g., spalled concrete, collapse), and DV denotes decision variables (e.g., repair costs, fatalities).
The first step in this approach is the hazard analysis, which evaluates the seismic hazard for a particular facility, considering nearby faults, site distance, source-to-site conditions, facility location, facility design, etc. Probabilistic seismic hazard analysis (PSHA) is used to evaluate the mean occurrence rate (mean frequency) of events having an intensity measure (IM) greater than a threshold value, im, for a specific site of interest (e.g., Cornell 1968, Kramer 1996, Field 2005). PSHA requires the use of seismic-hazard source models and ground-motion attenuation models. The ground shaking at the site is parameterized via an intensity measure. The hazard curve, λ[IM|D]dIM, is the mean arrival rate of events in [IM, IM + dIM]. Some traditional intensity measures are peak ground acceleration and spectral acceleration at chosen periods (e.g., Sa(T1), the damped elastic spectral acceleration at the small-amplitude fundamental period of the structure). The latter measure is used in this work.
seismic events, since damage at all levels of ground motion contribute to total losses. Note that the methodology allows for uncertainty in the structural models.
The third step of this methodology is the damage analysis. This step involves using fragility functions that express the probability that a facility component (e.g., beam, column, wall partition, etc.) is in or exceeds a particular damage state as a function of an EDP. The methodology does not specify how to aggregate the damageable building components and extensive research has been and continues to be conducted for damageable components at many levels; some researchers lump all components that are susceptible to the same EDP and will have similar damage patterns into one damageable “group,” while other researchers consider each component separately. In this study, we lump all like components on the same floor that are sensitive to the same EDP into one damage group. The different damage states for each damageable group are indicative of the corresponding repair efforts needed to restore that component type to an undamaged state. The fragility functions, compiled based on laboratory experiments, analytical investigation, expert opinion, or some combination, are used to create a probabilistic array of damage measures, DM.
damage and loss analyses (Mitrani-Reiser et al. 2006); details of the MDLA program are presented in Section 2.5.
Figure 2.1 Schematic of PEER methodology (Porter 2003).
[DV D| ] p DV DM D p DM EDP D p EDP IM D[ | , ] [ | , ] [ | , ] [IM D dIMdEDPdDM| ]
λ =
∫∫∫
λ (2.1)2.2
Introduction to PEER benchmark study
is evaluated for various structural realizations, and the results are compared in Chapter 4-Chapter 6.
2.2.1
PEER benchmark building and site
The site for the benchmark building was selected to represent a typical urban location in a highly seismic region of California where near-fault motions are not of concern; the chosen site is the LA Bulk Mail Facility in Bell, CA (coordinates 33.996° N, 118.162° W), located approximately 7 miles southeast of downtown Los Angeles. The site was chosen such that specific features of the region (e.g., basin edge effects) would not dominate the ground motions; this site met the benchmark selection criteria and also had the advantage of available high quality geotechnical data from the Resolution of Site Response Issues from the Northridge Earthquake program (ROSRINE 2005). The site is located on deep sediments that are mostly Quaternary alluvial deposits, and the upper 30 meters consist of sands and silts with traces of clay and cobbles that correspond to an average shear wave velocity Vs-30 = 285 m/s (NEHRP soil category D) (Goulet et al. 2006). Further details of the site hazard characterization may be found in Haselton, et al. (2007).
The benchmark structure, a 4-story, reinforced-concrete moment-frame office building, is a hypothetical structure that was designed specifically for this study according to IBC-2003, ASCE7-02, and ACI 318-02. Several designs were created for the benchmark study to represent the variability of design for different engineers using the same building code, including perimeter-frame and space-frame variants.4 These design variants are described in detail in Haselton et al. (2007), and briefly summarized here:
Design A: This is the baseline perimeter-frame design that reflects current practice, including above-code beam flexural strength and strong-column weak-beam (SCWB) ratios.
Design B: This design, although code conforming, is less conservative than Design A, with code-minimum force requirements, beam flexural strength, and SCWB ratios.
Design C: This design is intended to be easy to construct since the specified member dimensions, reinforcing schedule, and material properties of the second floor beams and first story columns are repeated in the upper-story beams and columns.
Design D: This design is the same as Design C, except that the SCWB provision is not enforced. Therefore, this design is non-code-conforming and was included in the study to demonstrate the importance of enforcing the SCWB provision in building designs.
Design E: This is the baseline space-frame design that reflects current practice, based on the provisions of the 2003 IBC (ICC 2003) and ACI 318-02 (ACI 2002).
The plan and elevation views of the building are given in Figure 2.2. The sizes of the moment-frame columns for the code-conforming designs range from 24”×28” to 30”
×40”; the moment-frame beams sizes are between 24”×24” and 24”×40”. The gravity frame in the perimeter-frame designs are composed of 18”-square reinforced concrete columns and an 8” post-tensioned two-way slab. Further details on member dimensions, reinforcing schedules, and material properties are available in Haselton et al. (2007). Some architectural features were assumed for the hypothetical benchmark building to later include in the loss analysis; the details for these are presented in Section 2.2.3. The floor plans showing these architectural finishes throughout the height of the building are given in Figure 2.3–Figure 2.6.
2.2.2
Damageable structural components
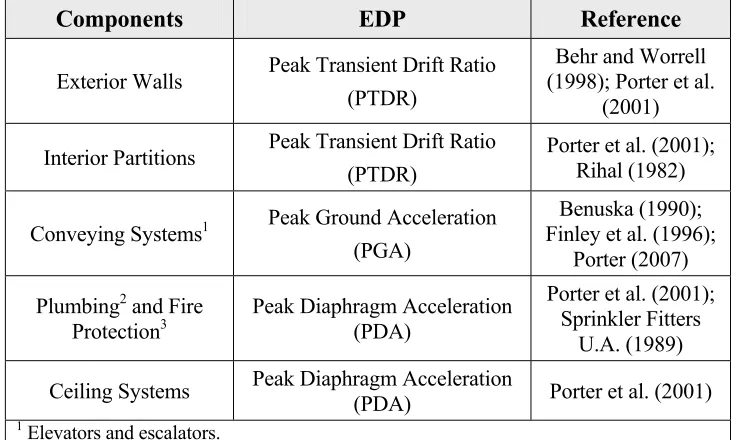
and the corresponding structural engineers were interviewed to better understand the controlling factors of their designs. The structural components from the benchmark building that were considered for the probabilistic loss analysis are: moment-frame beams and columns, moment-frame beam-column joints, gravity columns, and slab-columns joints. Those actually used in the damage and loss analysis of the benchmark study are summarized along with their associated EDP and fragility function reference in .
The beam-column joints and gravity-frame columns were not considered in the present study because they are not expected to make a significant difference in the loss results. With strong-column weak-beam provision of current design standards, one can assume that the damage to the joint is equal to or less than the damage to the beam. Repair costs for the damage states and the corresponding detailed outline of the repair effort for each damage state, provided by a professional cost estimator (Beck et al. 2002), show that the cost to include the joint in the repair is small. Therefore, it is assumed that whatever minor costs ignored from the beam-column joints in the moment frames is accounted for in the uncertainty of the repair cost for the adjacent beams. A static pushover analysis of the baseline perimeter-frame design shows that the plastic rotation demands for the gravity columns are at least an order of magnitude smaller than their capacities; and thus will likely contribute a modest amount to the total repair costs. These reasons justify ignoring the beam-column joint and the gravity-frame column in the damage and loss analysis.
Table 2.1 Damageable structural components in the benchmark building.
Components EDP Reference
RC SMRF beams Displacement Damage Index (DDI)
Williams et al. (1997) RC SMRF columns Displacement Damage Index (DDI) Williams et al. (1997) Gravity Frame:
Slab-Column Joints
Peak Transient Drift Ratio
Up
Up
Figure 2.3 Floor plan of ground floor.
Up
Up
20'
-0
"
22
'-8"
Figure 2.5 Automatic sprinkler piping system of ground floor.
Up
Up
2.2.3
Damageable nonstructural components
where λi is the mean rate of occurrence of events of interest on the ithfault; (p M Ri, )i is the joint probability density function of magnitude Mi and source-to-site distance Ri given that an event of interest has occurred on the ith fault; and [P IM ≥im M R| i, ]i is the complementary cumulative distribution function of IM, conditioned on Mi and Ri for an event on the ith fault, which is given by the ground-motion attenuation model.
The function λIM( )im when plotted against im is usually referred to as the hazard rate function or just hazard function (e.g. Benjamin and Cornell 1970, Ang and Tang 1975, Andrews and Moss 1993). This is consistent with the terminology in reliability theory where the hazard function for a Poisson process is the mean occurrence rate of failures, or, more generally, of some event of concern (Andrews and Moss 1993). For seismic hazards, the mean occurrence rate λIM is usually specified in units of per year and is often called simply the annual frequency of the events of interest, although strictly speaking it is the mean annual frequency. It is perhaps preferable to use the terminology mean annual rate since frequency is used with other meanings in earthquake engineering and seismology.
In seismic hazard analysis, the probability of IM exceeding a threshold im over a specified time period is of particular interest. This is usually derived based on a Poisson model (Cornell 1986; Kramer 1996):
[ | ] ( ) , !
n t
t e P N n t
n λ
λ −
= = (2.3)
where N represents the uncertain number of occurrences of a specified type of event during a specified time duration, t, and λ represents the mean rate of occurrence of such events. The probability that at least one such event will occur over time t is given by:
[ 1 | ] 1 [ 0 | ] 1 t .
P N t P N t
eλ
≥ = − =
hazard level. The records were selected based on the geometric mean of the two horizontal components, and so that they require a scale factor of 5.0 or less to match the target value of Sa(T1=1sec). Further details of the probabilistic seismic hazard analysis and of the
ground-motion record-selection procedure are available in Goulet et al. (2007).
Figure 2.7 Mean uniform hazard spectra (5% damping) for the LA Bulk Mail site for seven hazard levels (reproduced from Goulet et al., 2006). The spectral acceleration at
T=1 sec is used for the benchmark study, so the hazard levels shown in this plot correspond to Sa(T=1 sec) = 0.10 g, 0.19 g, 0.26 g, 0.30 g, 0.44 g, 0.55 g, 0.82 g.
2.4
PEER benchmark structural analysis
for low intensity levels to capture initial yielding, and a lumped-plasticity model is used for high intensity levels to depict strength and stiffness deterioration and collapse (Haselton et al., 2007). Incremental dynamic analysis, IDA (Vamvatsikos and Cornell 2002), was used to estimate sidesway collapse.
Nonlinear dynamic analyses of the benchmark building were carried out using the OpenSees software described in Section 2.1. A two-dimensional model of a four-bay frame was created for each design variant and analyzed for each horizontal component of ground motion, which is appropriate for the perimeter-frame designs since the orthogonal sets of planar frames are separate from one another (Hall 2003). The structural model for the perimeter-frame designs includes a parallel gravity frame to represent the additional contribution to stiffness and strength from the gravity system. Additionally, a “leaning column” is included in these models to account for the P-Delta effects that come from the gravity loads tributary to the gravity system (Haselton et al., 2007). This two-dimensional model ignores the biaxial behavior of the columns in the space-frame designs, and so they were designed only for flexural demands in one direction. The following section describes the combination strategy of the structural responses for both directions that is later used in the damage analysis.
0 0.01 0.02 0.03 0.04 0.05 0.06 0
500 1000 1500 2000
B
a
se
S
h
ea
r (
k
ip
s)
Roof Drift Ratio
Design A, Lumped Plast. Model using K
yld
Design A, Lumped Plast. Model using K
stf
Design A, Fiber Model with Gravity Frame
Figure 2.8 Static pushover curves for the fiber and lumped-plasticity models of one design variant (Design A) of the benchmark building, reproduced from Goulet et al.
(2007).
2.4.1
Three-dimensional considerations
Using the above assumptions, the same four-bay frame model is used to represent the behavior in both the N-S and E-W directions for both the perimeter-frame and space-frame designs. The behavior of the extra members in the 6-bay E-W space frame is extrapolated from the structural analysis of the 4-bay N-S frame. We assume that the interior beams and columns adjacent to one another will have similar levels of damage. Thus the EDPs for interior beams and columns from the four-bay structural model are replicated for the additional bays, as shown below in Figure 2.9.
6 7 8 9
1 2 3 4 5
10 11 12 13 14
19 20 21 22 23
28 29 30 31 32
15 16 17 18
24 25 26 27
33 34 35 36
1 2 2 3 4 4 5
6 7 7 8 8 9
10 11 11 12 13 13 14
15 16 16 17 17 18
19 20 20 21 22 22 23
24 25 25 26 26 27
28 29 29 30 31 31 32
33 34 34 35 35 36
A B C D E
1 2 3 4 5 6 7
Figure 2.9 EDP numbering for structural components in the N-S and E-W directions.
SRSS is a reasonable method to combine the DDI values of the N-S and E-W directions of the columns and was used in this study.
Figure 2.11 Biaxial moment relationship for columns (reproduced from ACI 1990).
2.5
MDLA toolbox
Figure 2.12 Input and output parameters for the MDLA toolbox.
2.5.1
MDLA input: Table of damageable assemblies
2.5.2
MDLA input: Table of fragility and cost distribution functions
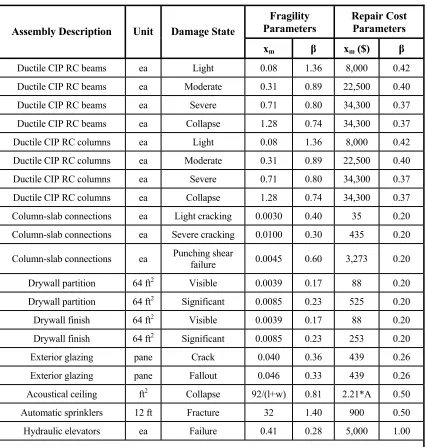
The table of damageable assemblies is used by the MDLA toolbox to select the fragility and cost-distribution functions from a library of available functions, for use in the damage and loss analyses. This library of functions is internal to the toolbox, but can be edited as new ones become available. The parameters of the fragility and the unit-repair-cost functions that are used in this study are summarized in Table 2.5. Since these functions are implemented as lognormal distributions, the required parameters are the median (xm) and the logarithmic standard deviation (β).
2.5.3
MDLA input: Structural analysis results
The structural analysis step of the PEER PBEE methodology results in structural responses, or EDPs. The lognormal distribution is often used by researchers (e.g., Miranda and Aslani 2003) to fit structural analysis data. Figure 2.13 shows the empirical cumulative distribution functions (cdf) from the raw data for peak roof acceleration of Design A in the EW-direction for four IM levels, and the corresponding fitted lognormal cdf’s. The fit of the lognormal cdf to the empirical cdf is very good considering that only two parameters have been adjusted based on the data. The lognormal fits performed by the MDLA toolbox pass the Kolomogorov-Smirnov and Lilliefors goodness-of-fit tests (Massey 1951; Miller 1956; Lilliefors 1967) at the 1% level of significance.
Table 2.5 Summary of assembly fragility and cost distribution parameters. Fragility
Parameters
Repair Cost Parameters Assembly Description Unit Damage State
xm β xm ($) β
Ductile CIP RC beams ea Light 0.08 1.36 8,000 0.42
Ductile CIP RC beams ea Moderate 0.31 0.89 22,500 0.40
Ductile CIP RC beams ea Severe 0.71 0.80 34,300 0.37
Ductile CIP RC beams ea Collapse 1.28 0.74 34,300 0.37
Ductile CIP RC columns ea Light 0.08 1.36 8,000 0.42
Ductile CIP RC columns ea Moderate 0.31 0.89 22,500 0.40
Ductile CIP RC columns ea Severe 0.71 0.80 34,300 0.37
Ductile CIP RC columns ea Collapse 1.28 0.74 34,300 0.37 Column-slab connections ea Light cracking 0.0030 0.40 35 0.20 Column-slab connections ea Severe cracking 0.0100 0.30 435 0.20
Column-slab connections ea Punching shear failure 0.0045 0.60 3,273 0.20
Drywall partition 64 ft2 Visible 0.0039 0.17 88 0.20
Drywall partition 64 ft2 Significant 0.0085 0.23 525 0.20
Drywall finish 64 ft2 Visible 0.0039 0.17 88 0.20
Drywall finish 64 ft2 Significant 0.0085 0.23 253 0.20
Exterior glazing pane Crack 0.040 0.36 439 0.26
Exterior glazing pane Fallout 0.046 0.33 439 0.26
Acoustical ceiling ft2 Collapse 92/(l+w) 0.81 2.21*A 0.50
Automatic sprinklers 12 ft Fracture 32 1.40 900 0.50
Hydraulic elevators ea Failure 0.41 0.28 5,000 1.00
0 0.01 0.02 0.03 0.04
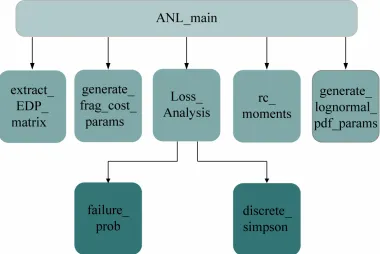
parameters of interest from an internal library. The “Loss_Analysis” module performs the damage and loss analyses, as outlined in Chapter 3, Chapter 5 and Chapter 6; results from this module are also found in these chapters. The “rc_moments” module computes the first four non-central moments of unit repair cost. The “generate_logn_pdf_params” module fits lognormal distributions to the raw EDP data. The “Loss_Analysis” module calls two other functions: “failure_prob” and “discrete_simpson.” The “failure_prob” module determines the failure probability, or the probability that the ith assembly is in damage state j. The “discrete_simpson” module performs numerical integration, using Simpson’s method.
2.5.5
Program output
CHAPTER 3
Damage Estimation
The probability of damage for each damageable component in the benchmark building is estimated using the MDLA toolbox; this is the intermediate analytical step necessary for subsequent determination of building losses given the structural analysis results. This chapter describes the methodology used for damage analysis of the structural and nonstructural building components considered to significantly contribute to overall building losses. The engineering demand parameters (EDPs)used for each of these components is identified, along with the considered damage states and associated repair efforts. The fragility functions used in the damage estimation, which describe the probability of the components being in or exceeding the described damage states, are mostly taken from Porter’s comprehensive work on the assembly-based vulnerability methodology (2000). The per-story average probabilities of damage for the moment-frame elements and the wallboard partitions in all the benchmark building variants are presented at the conclusion of the chapter.
3.1
Procedure for damage analysis
[ | , ] [ | ] ( | , )
i
ij ij i i i
edp
P DM NC im =
∫
P DM edp p edp NC im dedp(3.1)
The first component of the integrand, [P DM edpij| i], is the probability of reaching or exceeding the damage state j for a given building component, conditioned on EDP i appropriate for component of type i (this probability comes directly from the corresponding fragility function). The second component of the integrand, (p edp NC imi| , ), is the probability density of EDP i, conditioned on the structure not collapsing (NC) and on a given IM level. To evaluate this component, a lognormal distribution is fit to the structural response data, as is done by other researchers (e.g., Miranda and Aslani 2003). The probability of collapse given IM is also estimated as part of the structural analysis results by taking the fraction of structural analyses for that IM that give excessive sidesway mtions.
3.2
Fragility functions for benchmark study
3.2.1
Beams and columns
Various damage indices are used to quantify damage of reinforced-concrete (RC) structural members. Williams et al. (1997) studied eight damage indices for concrete elements, using data from cyclic tests of beams and beam-column joints under combined shear and flexure. These authors introduce five damage states, shown in Table 7.1. They demonstrate that three indices: a modified Park-Ang Damage Index (PADI), ductility, and modified stiffness ratio, are consistently reliable indicators of severe damage to the beam and joint. They also show that the damage indices that most accurately represent the development of damage throughout the experiments are a modified PADI, ductility, a modified stiffness ratio, and an index calculated from increments in the plastic displacement. They conclude that the more sophisticated indices that take into account the damage caused by repeated cycling gave no more reliable information of damage than the simpler indices such as ductility and stiffness degradation.
Table 3.1 Williams et al. (1997) damage states and consequences for concrete columns.
Damage
State Visible Damage Likely Consequences
None None or small number of light cracks, either flexural (90°) or shear (45°). No loss of use or structural repair needed.
Light Widespread light cracking; or a few cracks > 1mm; or light shear cracks tending to flatten toward 30°.
Only minimal loss of use, possible some minor repair needed to restore structure to its design strength.
Moderate Significant cracking, e.g. 90° cracks > 2mm; 45° cracks > 2mm; 30° cracks > 1mm. Structure closed for several weeks for major repairs.
Severe Very large flexure or shear cracks, usually accompanied by limited spalling of cover concrete.
Structure damaged beyond repair and must be demolished.
Collapse Very severe cracking and spalling of concrete; buckling, kinking or fracture of rebar.
Structure has completely or partially collapsed.
m r t
u r u y
A PADI
M
β⎛ ⎞
Φ − Φ
= Φ − Φ + ⎜⎜Φ ⎟⎟
⎝ ⎠ (3.1)
where
m
Φ = maximum curvature attained during seismic loading,
u
Φ = curvature associated with nominal ultimate moment capacity of the section,
r
Φ = recoverable curvature at unloading,
β= strength deterioration parameter,
t
A= total area contained in M-Φloops,
y
M = yield moment of section.
used professional cost estimators to calculate repair costs. The details of this evaluation are available in their report (Beck et al. 2002); the results used in this study are summarized in Table 2.5. Note that a few years have passed since the repair costs were estimated, and inflation is taken into account through the an inflation factor, Ci.
3.2.2
Column-slab connections
The fragility and repair of slab-column connections may depend on a number of parameters. Experimental results of column-slab damage reported by researchers (Aslani 2005, Kang et al., 2006) were used to develop the fragility functions for this study, shown in Figure 3.2. The associated repair cost distributions were developed based on the recommendations of a professional cost estimator. The fragility functions relate the peak interstory drift ratio (but calculated as the average of peak transient interstory drift ratio in stories above and below the slab) to the probabilities of reaching or exceeding the following three damage states: (1) a “light cracking” damage state that is repaired using a surface coating of the affected area, (2) a “severe cracking” damage state that corresponds to epoxy injection repair of the affected area, and (3) a “punching shear (without collapse)” damage state that corresponds to replacing the concrete in the slab surface. The maximum value of IDR in either orthogonal direction (i.e., from the governing ground motion component) is the EDP chosen to estimate the damage of the column-slab connections. The details of the development of these fragility and cost distribution functions is given in Haselton et al. (2007) and summarized in Table 2.5.
beam-column connection tests and found that none exhibited damage requiring joint replacement. This suggests that the damage will be relatively greater in the adjacent columns and beams, as compared to the joint itself.
0 0.02 0.04 0.06 0.08 0.1
0 0.2 0.4 0.6 0.8 1
Peak Interstory Drift Ratio
C
um
ulativ
e P
ro
ba
bility
Fragility Curves for Column-Slab Connections
Light Cracking Severe Cracking Punching Shear Failure
Figure 3.2 Fragility functions for column-slab connections.
3.2.3
Drywall partitions and finish
PTDR values from the structural analysis to probabilities of exceeding the two levels of damage: visible and significant.
0 0.005 0.01 0.015
0 0.2 0.4 0.6 0.8 1
Peak Transient Drift Ratio
C
umu
lativ
e P
ro
ba
bility
Fragility Curves for Drywall Partitions
Visible Significant
Figure 3.3 Fragility functions for the wallboard partitions.
Visible damage is repaired by patching cracks and possibly cutting out damaged pieces of wallboard and replacing them, then applying joint tape and joint compound (often called mud) to the cracks or seams, sanding, and repainting. Significant damage is repaired by demolishing and replacing the partition. Interior partitions with gypsum wallboard on both sides are treated as two separate assemblies: one that includes the framing and gypsum wallboard on one side, the other includes only the gypsum wallboard finish on the other side. Again, the cost associated with the repair effort to return the damaged wallboard partitions and finish to an undamaged state was calculated by professional cost estimators in Beck et al. (2002). The results used in this study are summarized in Table 2.5. Inflation is again taken into account through the inflation factor, Ci.
3.2.4
Interior paint
or hallway that requires repainting leads to the repainting of that entire room or hallway. Thus, they consider the need for owners to repaint areas that are not damaged, to achieve a reasonable uniform appearance. This approach works in a Monte Carlo simulation but not when using FOSM (a first-order second-moment method used to estimate uncertainty) or the direct probability approach used in this work, so for present purposes an approximation is required. We propose a simplified formula for calculating the mean area requiring a fresh coat of paint:
( | )
ATP DA UA P paint UA DA= + ⋅ (3.3)
where ATP = mean area to paint, DA = damaged area, UA = undamaged area, and
( | )
P paint UA DA = probability of needing to paint an entire floor as a function of the damaged area of wallboard partitions on the same floor.
0 0.2 0.4 0.6 0.8 1 0
0.2 0.4 0.6 0.8 1
Ratio of Damaged Area
C
umu
la
ti
ve
P
rob
ab
ility
Fragility Curve for Interior Paint
Figure 3.4 Fragility function for interior paint.
3.2.5
Exterior glazing
0 0.05 0.1 0.15 0
0.2 0.4 0.6 0.8 1
Peak Interstory Drift Ratio
C
umu
lativ
e P
ro
ba
bility
Fragility Curves for Exterior Glazing
Crack Fallout
Figure 3.5 Fragility functions for exterior glazing.
3.2.6
Ceiling
The ceiling of the benchmark building consists of a grid-work of aluminum channels in the shape of an upside-down “T,” connected to the diaphragm above with splay wires that, in theory, provide lateral-force bracing along with vertical compression struts. These channels are in a regularly-spaced pattern made up of a 2’×4’ grid and support lightweight acoustical ceiling tiles. A total of 81,000 square feet of acoustical tiles make up the ceiling for the benchmark building.
3.3
Damage results for benchmark study
The methodology for calculating the probability of the structural components being damaged is described above in Section 3.1. Some results of the damage analysis step are shown in Figure 3.9-Figure 3.21, showing plots against IM=Sa of the average probability of reaching or exceeding each possible damage state for like components on each story level of the benchmark building. These plots show the average trend of damage of like components along the height of the structure and with increasing intensity level. The damage results can be used to quickly compare various designs and to estimate what will likely control the repair cost in future earthquakes. The designs and models considered are summarized in Table 3.3.
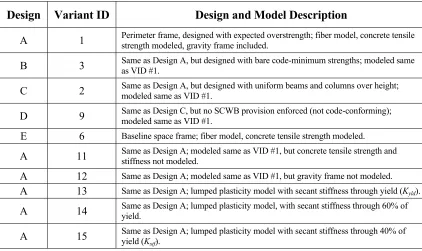
Table 3.3 Summary of benchmark building designs and structural models.
Design Variant ID Design and Model Description
A 1 Perimeter frame, designed with expected overstrength; fiber model, concrete tensile strength modeled, gravity frame included. B 3 Same as Design A, but designed with bare code-minimum strengths; modeled same as VID #1. C 2 Same as Design A, but designed with uniform beams and columns over height; modeled same as VID #1. D 9 Same as Design C, but no SCWB provision enforced (not code-conforming); modeled same as VID #1. E 6 Baseline space frame; fiber model, concrete tensile strength modeled. A 11 Same as Design A; modeled same as VID #1, but concrete tensile strength and stiffness not modeled. A 12 Same as Design A; modeled same as VID #1, but gravity frame not modeled. A 13 Same as Design A; lumped plasticity model with secant stiffness through yield (Kyld).
A 14 Same as Design A; lumped plasticity model, with secant stiffness through 60% of yield. A 15 Same as Design A; lumped plasticity model with secant stiffness through 40% of yield (K
stf).
be a great asset to engineers who would like to optimize their design choices, and to their clients who can benefit from this information.
The variant that does not include code’s strong-column weak-beam provision (Variant #9, Figure 3.13) has the most damage (or smallest probability of “no damage”) to its columns throughout the height of the structure and even at small hazard levels, as compared to the other perimeter-frame designs (see Figure 3.19). The lowest probability of damage (or largest probability of “no damage”) to the columns, beams, and partitions of the perimeter-frame designs occurs in the variant conservatively designed using the same beams and columns throughout (Variant #2, Figure 3.10 and Figure 3.20). The space-frame baseline design (Variant #6, Figure 3.12) acquires a significant amount of damage to the columns in the first story, but it better withstands damage to the beams and partitions as compared to the perimeter-frame designs (see Figure 3.19Figure 3.21).
This suggests that either Variant #2 or Variant #6 is likely to have the least expensive repairs. Also, all these damage plots show that significant damage to wallboard partitions has an early onset (at all story levels) for most of the variants considered in this study. As will be shown later, this early onset of damage in the nonstructural elements is a major contributor to the mean total repair costs for low levels of shaking and to expected annual loss, since these lower-level ground motions are more likely to occur.
conservative design of Variant #2 is the design of Variant #9, which does not comply with the code’s strong-column weak-beam (SCWB) provisions. The columns of stories 1-4 have lower probability of “no damage” (and have a higher probability of reaching the severe and collapse damage states in stories 1-2) for Variant #9 than for Variant #2; the beams in stories 2-4 for Variant #9 are also more damaged. Also, the partitions at the top three stories of this non-code-conforming design are more significantly damaged at lower levels of ground shaking (see Figure 3.21).
These damage plots are also an effective way to compare modeling choices of the benchmark building. Some modeling assumptions can lead to over- (conservative) or under- (non-conservative) estimation of the structure’s response. Variant #11 assumes that all the concrete is precracked and is not expected to perform as well as the perimeter-frame baseline model (Variant #1). A comparison of Figure 3.9 and Figure 3.14 shows that the structural members of Variant #11 have a higher average probability of reaching mores severe damage states throughout the height of the building; the partitions for Variant #11 have an earlier onset and a higher probability of reaching the significant damage state. This model is therefore a conservative representation of the baseline perimeter-frame design.
Another alterative to the baseline model is ignoring the effect of the gravity-load resisting frames, which results in an overall loss of strength and stiffness and an overall increase in structural response. Variant #12, which does not model the gravity-load resisting frames, has a higher average probability of its components being damaged for nearly all the hazard levels, when compared the baseline design (Variant #1). The most notable difference between Figure 3.9 and Figure 3.15 can be seen in the wallboard partitions, where the average probability of being damaged exceeds 0.50 and 0.85 (both occur at story level 3) at only the second and third smallest hazard levels, respectively. Again, this model overestimates the structural response.
CHAPTER 4
Building and Life Safety
The inspection of buildings and other structures after a seismic event helps to identify damage that may be life threatening to people, and to locate buildings that have collapsed or are in imminent danger of collapse. The estimated probabilities of damage and collapse resulting from the structural and damage analyses, respectively described in Chapter 2 and Chapter 3, are implemented in this chapter to develop a virtual inspector that can assess building damage. The virtual inspector has been designed to appropriately tag the building with the well-known red, yellow, and green safety placards abiding with current U.S. guidelines, and to locate the areas of concerning damage in the structure. The results of the damage analysis and the virtual inspection are used to estimate the number of fatalities in a building caused by partial or global collapse. The outcome of the virtual inspection and the fatality model are presented for several designs of the benchmark building across hazard levels.
4.1
Building safety
structures. This chapter investigates the role that building safety and casualty models can and should play in the design process. The goal of this chapter is to present the current state of building safety assessment procedures and of injury/casualty modeling for seismic events, to introduce improved safety and casualty models, and to show results of the proposed models applied to the PEER benchmark study described in Section 2.2.
4.1.1
ATC 20
The Applied Technology Council’s Procedures for Postearthquake Safety Evaluation of Buildings document (ATC 20 1989; ATC 20-2 1995; ATC 20-3 1996a) offers guidelines for postearthquake safety inspections of buildings. The earliest document, ATC 20 (1989) was written to provide clear guidelines for postearthquake building evaluation using a three-level evaluation methodology: rapid evaluation (may be completed in less than 30 minutes; emphasis is on exterior of building; interior inspections are recommended for a few special circumstances), detailed evaluation (typically recommended after rapid evaluation; may be completed in a few hours; thorough examination of interior and exterior), and engineering evaluation (recommended when visual inspections are not sufficient to determine damage to building; can take up to a week or more to complete by structural engineers; responsibility of owner). The outcome of these evaluations is to tag the buildings with red, yellow, or green placards that designate a building as unsafe, restricted for use, or apparently safe, respectively.
after being field tested in a few damaging earthquakes. The most notable modifications are: a loss-value estimation procedure to “help determine the total damage the community actually suffered” (ATC 20-2 1995), updated placards with clear instructions of building-use restrictions (ATC 20-2 1995), and more than fifty case studies of postearthquake building safety evaluations using the rapid evaluation method described above (ATC 20-3 1996a).
4.1.2
Virtual inspector
The ATC-20 guidelines described above are used to create a “virtual inspector,” or a computer model that probabilistically estimates building safety using the damage analysis procedures described in Chapter 3. The damage descriptions from the fragility functions of the structural and nonstructural components are matched up with the damage descriptions from the ATC-20 guidelines to recreate the first two levels of the building evaluation procedure: rapid and detailed. The basic structure for this virtual inspector is given in the form of an event tree and shown below in Figure 4.1. The first block of the methodology, (a), corresponds to ATC-20’s rapid evaluation, which evaluates the structural integrity of a building and the probability of a red, yellow or a green tag being posted, based on what would be a speedy inspection of the exterior structural components. The second block, (b), relates to ATC-20’s detailed evaluation and includes a more thorough inspection of the structural components in the exterior as well as the interior of the building. Nonstructural damage does not play a role in this safety evaluation, but it used to determine any limitations of the building’s use and occupancy, which will be described in more detail in Section 6.1.
Figure 4.1 Event tree model for building safety evaluation based on ATC-20’s (1985, 1995, 1996a) (a) rapid evaluation, and (b) detailed evaluation procedures.
4.1.3
Building safety results for benchmark study
of collapse as determined by the plastic-hinge model. The damage analysis of the fiber model results are used to estimate the probability of tagging in the event that there is no sidesway collapse of the building (all other branches of the event tree in Figure 4.1).
The probabilities of safety tagging are calculated at each hazard level, using the procedures of the rapid and detailed evaluations. Figure 4.2 shows a comparison of the tagging results from the rapid and detailed evaluations of a design that includes the SCWB provision (design C, VID #2) and one that does not (design D, VID #9). This plot demonstrates that the design without the SCWB provision performs considerably worse than the one including this important provision. Design C (VID #2) has a near-zero probability of receiving a red tag resulting from a detailed evaluation for earthquakes with hazard levels less than or equal to Sa=0.55g, and then the probability of red tag increases beyond this
hazard level to about 40% at Sa=1.2g. On the other hand, after a detailed evaluation, Design
D (VID #9) reaches the 50% probability of a red tag at a lower hazard level, near Sa=0.90g.