TABLE OF CONTENTS: VOL. 37, No. 1, January 1984 ARTICLES:
3
7
12
19
22
25
28
31
36
40
44
50
55
59
64
67
72
77
79
83
Using Weather Records with a Forage Production Model to Forecast Range Forage Production by J. Ross Wight, Clayton L. Hanson, and Duane Whitmer Emergence and Seedling Survival of Two Warm-season Grasses as Influenced by the Timing of Precipitation: A Greenhouse Study by G.W. Frasier, D.A. Wool- hiser, and J.R. Cox
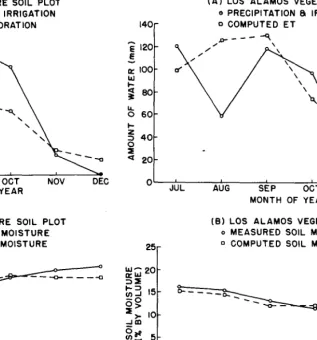
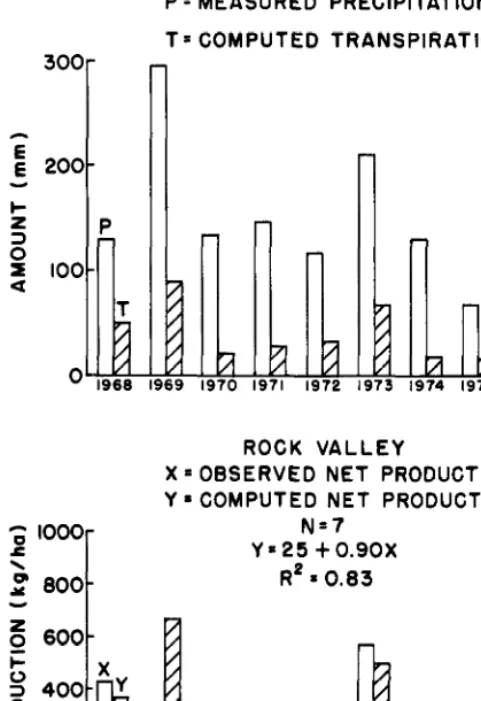
Water Balance Calculations and Net Production of Perennial Vegetation in the Northern Mojave Desert by L.J. Lane, E.M. Romney, and T.E. Hakonson Germination of Seeds of ‘Paloma’ and ‘Nezpar’ Indian Ricegrass by James A. Young and Raymond A. Evans
The Effect of Shade and Planting Depth on the Emergence of Fourwlng Saltbush by J.T. Hennessy, R.P. Gibbens, and M. Cardenas
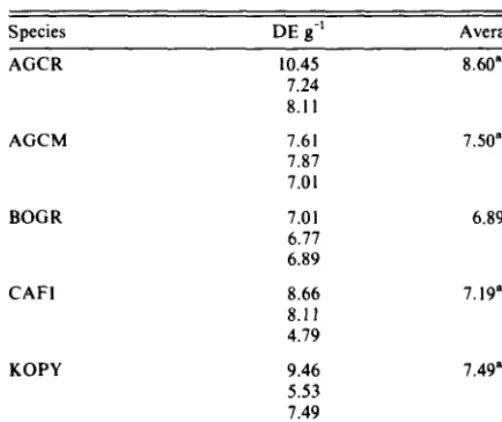
Conversion of Solar Energy into Digestible Energy: a Basis for Evaluating Range Forages? by Clayton B. Marlow
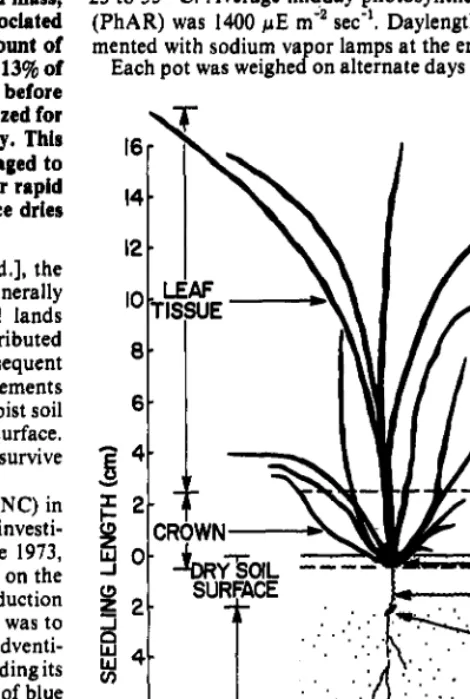
Nonstructural Carbohydrates and Root Development in Blue Grama Seedlings by A.M. Wilson
Seasonal Changes in Carbon Content, and Dehydrogenase, Phosphatase, and Urease Activities in Mixed Prairie and Fescue Grassland Ah Horizons by J.F. Dormaar, A. Johnston, and S. Smoliak
Seasonal Mineral Concentration in Diets of Esophageally Fistulated Steers on Three Range Areas by R.S. Kalmbacher, K.R. Long, and F.G. Martin
Effects of Herbicides on Germination and Seedling Development of Three Native Grasses by Anthony H. Huffman and Pete W. Jacoby, Jr.
Fire Intensity Effects on the Understory in Ponderosa Pine Forests by Charles D. Armour, Stephen C. Bunting,and Leon F. Neuenschwander
Cattle Diets Under Continuous and Four-pasture, One-herd Grazing Systems in Southcentral New Mexico by James A. Pfister, Gary B. Donart, Rex D. Pieper, Joe D. Wallace, and Eugene E. Parker
Vegetation and Litter Changes of a Nebraska Sandhills Prairie Protected from Grazing by M.A. Potvin and A.T. Harrison
Locoweed Poisoning in a Northern New Mexico Elk Herd by Gary J. Wolfe and William R. Lance
Does Summer Range Quality Influence Sex Ratios among Mule Deer Fawns in Utah? by Jordan C. Pederson and K.T. Harper
Diets of Ungulates Using Winter Ranges in Northcentral Montana by Wayne F. Kasworm, Lynn R. Irby, and Helga B. Ihsle Pat
Horses and Cattle Grazing in the Wyoming Red Desert, I. Food Habits and Dietary Overlap by L.J. Krysl, M.E. Hubbert, B.F. Sowell, G.E. Plumb, T.K. Jewett, M.A. Smith, and J.W. Waggoner
Nitrogen Fixation Estimates for Some Native and Introduced Legumes, Forbs, and Shrubs by Arden A. Baltensperger and Mark A. Smith
Diets of Black-tailed Jack Rabbits in Relation to Population Density and Vegeta- tion by Randal D. Johnson and Jay E. Anderson
Published bimonthly-January, March, May, July, September, November
Copyright 1984 by the Society for Range Manage- ment
INDIVIDUAL SUBSCRIPTION is by membership in the Society for Range Management.
LIBRARY or other INSTITUTIONAL SUBSCRIP- TIONS on a calendar year basis are $56.00 for the United States postpaid and $66.00 for other coun- tries, postpaid. Payment from outside the United States should be remitted in US dollars by interna- tional money order or draft on a New York bank. BUSINESSCORRESPONDENCE, concerningsub- scriptions. advertising, reprints, back issues, and related matters, should be addressed to the Manag- ing Editor, 2760 West Fifth Avenue, Denver, Colo. 80204.
EDITORIALCORRESPONDENCE, concerning manu- scriptsorothereditorial matters,should beaddressed to the Editor, 2760 West Fifth Avenue, Denver, Colo. 80204.
INSTRUCTIONS FOR AUTHORS appear on the inside back cover of each issue. A Style Manual is also available from the Society for dange Manage- ment at the above address @$1.25 for single copies; $1.00 each for 2 or more.
THE JOURNAL OF RANGE MANAGEMENT (ISSN 0022-409X) is published six times yearly for $56.00 per year by the Society for Range Management, 2760 West Fifth Avenue, Denver, Colo. 80204. SECOND CLASS POSTAGE paid at Denver, Colo. POSTMASTER: Return entire journal with address change-RETURN POSTAGE GUARANTEED-to Society for Range Management, 2760 West Fifth Avenue, Denver, Colo. 80204.
The Journal of Range Management serves as a forum for the presentation and discus- sion of facts, ideas, and philosophies pertain- ing to the study, management, and use of rangelands and their several resources. Accord- ingly, all material published herein is signed and reflects the individual views of the authors and is not necessarily an official position of the Society. Manuscripts from any source- nonmembers as well as members-are wel- come and will be given every consideration by the editors. Submissions need not be of a technical nature, but should be germane to the broad field of range management. Editor- ial comment by an individual is also welcome and subject to acceptance by the editor, will be published as a “Viewpoint.”
87 Economics of Controlling Serrated Tussock in the Southeastern Australiin Range-
lands by D.T. Vere and M.H. Campbell
TECHNICAL NOTES
94 A Simple Disc Meter for Measurement of Pasture Height and Forage Bulk by
Steven H. Sharrow BOOK REVIEWS
96 Livestock Management in the Arid Zone by Victor Squires; The Role of Fire in Northern Circumpolar Ecosystems. . . SCOPE 18 edited by Ross W. Wein and David A. MacLean; Nutritional Limits to Animal Production from Pasturesedited by J.B. Hacker
Managlng Edltor PETER V. JACKSON Ill
2760 West Fifth Avenue Denver, Colo. 80204 Editor
PATRICIA G. SMITH
Society for Range Management 2760 West Fifth Avenue Denver, CO 80204 Book Revlew Edltor RICHARD E. FRANCIS
Rocky Mountain Forest and Range Experiment Station 2205 Columbia S.E.
Albuquerque, New Mexico 87106
ASSOCIATE EDITORS E. TOM BARTLETT
Dept. of Range Science Colorado State University Fort Collins. CO 80523 GARY FRASIER
2000 East Allen Road Tucson, AZ 85719 G. FRED GIFFORD
Range Science Dept. Utah State University Logan, UT 84322 W.K. LAUENROTH
Department of Range Science Colorado State University Fort Collins, CO 80523 LYMAN MCDONALD
Statistics Department
College of Commerce and Industry University of Wyoming
Laramie, WY 82071 ROBERT MURRAY
US Sheep Experiment Station Dubois. ID 83423
KIETH SEVERSON Forest Hydrology
Laboratory
Arizona State University Tempe. AZ 85281 DARREL UECKERT
Range Science Department Agricultural Research and Extension San Angelo, TX 76901
BRUCE WELCH Shrub Science Laboratory 735 N 500 E
Provo, UT 84701 LARRY M. WHITE
USDA ARS
S. Plains Range Research Station 200 18th St.
Woodward, OK 73801 KARL WOOD
Dept. of Animial and Range Sciences Box 3-l
Las Cruces, NM 88001 JAMES YOUNG
USDA ARS
Grafdtir~high
ZiIdhaSthe~COUldSee.
Thatbthe~itwaseTlhthe~itCanbe.
When the first ranchers pioneered Texas and
Oklahoma
they were greeted by grassland.
Ranging for miles and waving a welcome to the
strong-spirited ranchers and their grazing herds.
When the land was all taken, it was not all
taken care of. It was fenced and overgrazed.
It was parched by the dry years, and invaded
by deep-rooted
and “drouthy” brush. Brush
destined to invade nearly every ranch,
and to cut in half the grazing potential
of over 88 million acres.
But there’s a new pioneer spirit among
ranchers today. They want their land
back from the brush.. .and back to
its natural beauty and bounty.
And there’s a new product that makes it
practical. It’s GraslaP
from Elanco.
Graslan is a new approach to brush control.
It’s as revolutionary
and unique as were three
other Elanco products - Tylan@ and
Rumensin@ for your cattle and TreflarP
herbicide for soybeans and cotton.
To find out more about brush control with
Graslan, talk to your local SCS, Extension
Agent or Range Management
Specialist.
SOCIETY FOR
RANGE MANAGEMENT
President
GERALD THOMAS Drawer 3BC
University Park Branch Las Cues, New Mexico 88001
1st Vke-President
JOSEPH 1. SCHUSTER Range Science Dept. Texas A&M University College Station, TX 77843
2nd Vice-President
EDWARD A. MCKINNON Box 3474 Sta. B.
Calgary, Alta., Canada T2M2Ml
Executive Vice-President
PETER V. JACKSON III
Society for Range Management 2780 West Fifth Ave.
Denver, Colo. 80204 (303) 571-0174
Directors 1981-83
DONALD JOHNSON Universidad de Sonora Toledano 15 Villa Satelite
Hermosillo, Sonora Mexico ALASTAIR MCLEAN
3015 Ord Rd. Kamloops, B.C. Canada V28-8A0
1982-1984
THOMAS E. BEDELL Ext. Rangeland Res. Spec. OSLJ
Corvallis, Oregon 97331 DON DWVER
Range Science Dept. UMC 52 Utah State University Logan, Utah 84322
1983-85 PAT 0. CURRIE
Livestock and Range Research Station Miles City, Montana
DAVID A. FISCHBACH Faith, South Dakota
The term of office of all elected officers and direc- tors begins in February of each year during the Society’s annual meeting.
The Society for Range Management, founded in 1948 as the American Society of Range Management, is a nonprofit association incorporated under the laws of the State of Wyoming. It is recognized exempt from Federal income tax, as a scientific and educa- tional organization, under the provisions of Section 501(c)(3) of the Internal Revenue Code, and also is classed as a public foundation as described in Section 509(a)(2) of the Code. The name of the Society was changed in 1971 by amendment of the Articles of Incorporation.
The objectives for which the corporation is established are:
--to deveidp an understanding of range ecosystems and of the principles applicable to the management of range resources;
-to assist all who work with range resources to keep abreast of new findings and techniques in the science and art of range management:
--to improve the effectiveness of range management to obtainfrom range resources the products and values necessary for man’s welfare;
--to create a public appreciation of the economic and social benefits to be obtained from the range environment;
-to promote professional development of its members.
Membership in the Society for Range Management is open to anyone engaged in or interested in any aspect of the study, management, or use of rangelands. Please contact the Executive Secretary for details.
Contribution Policy
The Society for Range Management may accept donations of real and/or personal property, subject to limitations imposed by State and Federal Law. All donations shall be subject to control by the Board of Directors and their discretion in utilization and application of said donations. However, consideration may be given to the donor’s wishes concerning which particular fund account and/or accounts the contribution would be applied.
Using Weather Records with a Forage Pro-
duction Model to Forecast Range Forage
Production
J. ROSS WIGHT, CLAYTON L. HANSON, AND DUANE WHITMER
Abstract
This paper describes a method for calculating site specific fore- cast yields and their associated probabilities of occurrence. A physically based range forage model, which utilizes beginning soil water content and daily precipitation, mean air temperature, and solar radiation as inputs, calculates the ratio of actual transpira- tion (T) to potential transpiration (Tp) as a yield index. Annual yield is calculated by the relationship: yield = potential site yield (yield when water is nonlimiting) X T/T,. By using the current year’s beginning soil water content and weather data for a number of years, a population of yields is generated (one yield for each year of weather data). From the population of yields, a mean and various confidence intervals around the mean can be calculated as the forcast yield and its associated confidence intervals.
The forecast procedure was tested using 55 years (1917-1971) of weather records and 12 years (1967-1978) of actual yield and soil water data for an upland range site in eastern Montana. An expected two thirds of the field measured yields were within a standard deviation of the forecasted yields for the April, May, and June forecasts.
Yield forecasting is common in the agriculture industry. Fore- casts help identify areas of surplus and shortage, and help establish markets. Range forage yield forecasts can be additionally benefi- cial in helping determine annual carrying capacities for more effi- cient grazing management. This is especially important during drought years when advanced warnings enable grazing adjust- ments to accommodate livestock needs and protect range resources from damage due to overgrazing.
Probability based yield forecasts can be made in 2 general ways: (I) the stochastic analyses of long-term yield data such as described by Hanson et al. (1982); and (2) the generation of populations of yields from which means and other distribution parameters can be calculated (Arkin et al. 1980). The first method requires long-term yield records where management has been relatively constant-no fertilization, species improvement, etc. (such records are scarce). The second method requires a population of annual weather varia- bles and the establishment of quantitative relationships between the weather variables and plant growth. The weather variables can be obtained from weather records or generated stochastically as described by Arkin et al. (1980), Richardson (1981), or Larsen and Pense (1982).
The establishment of quantitative relationships between weather variables and plant growth has commonly been expressed in regression models such as described by Rogler and Haas (1947), Authors are range scientist and agricultural engineer, respectively; USDA-AR% 270 South Orchard, Boise, Ida. 83705; and range conservationist, USDI, Bureau of Land Management, P.O. Box 30157 Billings, Mont. 59107.
This article is a contribution from the Northwest Watershed Research Center, USDA-ARS. and Bureau of Land Management, USDI; in cooperation with the Agricultural Experiment Station, University of Idaho, Moscow 83843.
Manuscript received February 28, 1983.
JOURNAL OF RANGE MANAGEMENT 37(l), January 1984
Smoliak (1956), Currie and Peterson (1966), and Johnston et al. (1969). In their simplest form, these models are linear regression equations with forage yield as the dependent variable and annual or seasonal precipitation or available water as the independent variable (Rogler and Haas 1947). To account for the effect of the precipitation distribution during the growing season, multiple regression equations have been developed which use various com- binations of monthly precipitation as the independent variables (Currie and Peterson 1966). Multiple regression models often include beginning soil water content and/or climatic parameters such as pan evaporation as independent variables (Smoliak 1956, Johnston et al. 1969). Regression models, however, are usually site specific, and thus their application is limited to the site and other environmental conditions from which the data used to develop the regression relationships were obtained.
To extend the application of regression models over a range of sites and environmental conditions, site factors, such as soil texture and soil depth, have been considered. A simple way to account for forage yield variations due to site characteristics is the use of the long-term site average yield as one of the independent variables. Such a factor integrates the total effect of site factors such as texture, slope, and species composition. The use of yield and precipitation indices as the dependent and independent variables, respectively, has provided an effective means of extending the geographical application of regression models (Sneva and Hyder 1962). These indices are the expression of the yield and precipita- tion variables as portions of the long-term median yields and precipitation, respectively.
In recent years, there have been increasing efforts to quantify the physical aspects of plant growth in relationship to the environ- ment, particularly for cultivated crops. The result of these efforts has been the development of physically based plant growth and production models. The grassland simulation model, ELM (Innis 1978) and the model described by Wight and Hanks (1981) are examples of physically based models for the growth and produc- tion of range vegetation. Such models are more transferable among range sites, ecosystems, and climates than are the regression models.
This paper describes and evaluates a method of using weather records in conjunction with a physically based forage yield model to make yield forecasts with confidence intervals and stated proba- bilities of occurrence. The forecast method is similar to that used by Arkin et al. (1980) to forecast the growth and yield of sorghum, except that the weather variables were obtained directly from weather records rather than from stochastic generation.
Methods and Procedures
A forage production model known as ERHYM (Wight and Neff 1983) was used to relate soil water and climatic parameters to plant
growth. Using the soil water content in the root zone at the begin- ning of the growing season, daily precipitation, and estimates of potential evapotranspiration (calculated from solar radiation and daily mean temperature) as inputs, the model calculates daily soil water content, actual transpiration (T), and potential transpiration (Tp). Total herbage yield at peak standing crop is calculated from the relationship: Y/ Yp = T/ Tp, where Y is actual yield and Y, is the potential site yield. The model’s output, T/T,, provides an effective means of indexing the growing seasons’s climatic effect on yield. This index accounts for the amount of precipitation, its distribu- tion, associated evaporative demand, and soil water content. Note, that when water is nonlimiting, T/ Tp q 1 .O. The yield index can be expressed in terms of the long-term average site yield rather than site potential using the relationship: Yield index = I.ST/Tp. Pre- viously reported research (Wight and Black 1971) indicates that in the northern Great Plains, the site potential yield is about I.5 times the long-term site average yield.
To forecast the current year’s forage production or yield index, the model is run using the available soil water content at the beginning of the growing season and daily precipitation, mean air temperature, and solar radiation data from weather records. Each model run produces a yield index (T/T,) based on the current year’s actual beginning soil water content, and the growing sea- son’s precipitation, daily temperature, and solar radiation from a past year’s weather record. For example, to forecast 1983 forage yields, the soil water content at the beginning of the 1983 growing season would be used with each model run. If 50 years of weather data were available, the model could be run 50 times, once for each year, producing a population of 50 yields or yield indices. Thus, the 50 yields or yield indices reflect the same beginning soil water content but the variability of the 50 different weather records. The mean of these 50 yields or yield indices is the 1983 forecast value. This forecast can be made at the beginning of the growing season when only the current soil water conditions are known.
Assuming that the yield indices are normally distributed, their mean and standard deviation can then be calculated and probabil- ity statements can be made as to the occurrence of the forecasted yield within specified intervals. For example, if the mean of 50 model runs was 1,000 kg forage/ ha and the standard deviation was 300 kg forage/ ha, we could state that there was a 68% probability that the 1983 forage yield for that particular site would be between
700 and 1,300 kg/ha.
The same procedure can be used to update the forecasts during the growing season based on soil water content at the time of the forecast. These soil water contents can be determined by field measurements or from model-predicted soil water values which are available when the model is run with real-time or forecast year weather data. Field-measured soil water values are necessary only for the initial simulation or forecast of a year,
If solar radiation records are not available, solar radiation values can be adequately estimated from solar radiation curves or solar tables. The model can be run for as many years as there are weather records. Arkin et al. (1980) found that 50 years provided an adequately large population from which to calculate a mean and other distribution parameters for forecasting sorghum yields.
We tested this forecast procedure on a mixed prairie range site for which we had 12 years (1967-1978) of soil water and yield data (see Wight and Hanks 1981). The study site was located near Sidney, Mont., on a sandy loam range site with a I to 2% slope. The major forage species included western wheatgrass (Agropyron smi- thii), blue grama, (Bouteloua gracilis), needleandthread grass (Stipa comata), threadleaf sedge (Carexfilifolia), and needleleaf sedge (Carex eleocharis). Annual herbage yields (Table 1) were measured at peak standing crop, which usually occurred about mid-July.
Weather records were available from nearby Glendive, Mont., for the period 19 I7- 1971. This 55-year record enabled us to gener- ate a population of 55 yield indices for each forecast. Solar radia- tion values were estimated from a curve of mean daily solar radia- tion developed from monthly mean daily solar radiation data from Sidney, Mont., for the period 1967-1976 (Fig. I). Yield indices generated with estimated solar radiation values were compared with those generated with actual daily solar radiation values for the
1967-1978 period. Differences in the yield indices averaged less than 0.03 and ranged from 0.0 to 0.07, indicating that the estimated solar radiation values were adequate for forage yield forecasting. Yield indices were calculated for the 12 growing seasons (1967-1978). Previous research (Wight and Hanks 1981) showed that, in terms of predicting peak standing crop, the model was not sensitive to small variations in growing season lengths; therefore, a fixed growing season of April 1 to July 15 was used for all years. Use of a fixed growing season enhanced the demonstration of the
Table 1. Forecasted and field-measured yields, sample size, and available soil water content at the beginning of the growing season for a range site near Sidney, Montana.
Forecasted Field-measured
Peak standing Standard
April 1 May 1 June 1 July I July 15 crop deviation
Year kg/ha kg/ha
1967 780 1053 1014 1170 1170 1200 278
1968 715 572 455 702 676 742 51
1969 1014 1092 1066 1209 1209 1245 237
1970 793 1040 1196 1235 1235 1205 217
1971 844 832 767 767 741 720 166
1972 1092 1105 1261 1300 1300 1215 241
1973 728 884 806 I157 1157 763 208
1974 1040 975 1209 1274 1261 933 204
1975 754 988 1053 1261 1248 1321 263
1976 910 1014 1079 1196 1196 1100 266
1977 988 819 715 624 585 450 166
1978 962 832 1235 1235 1248 1246 401
Mean 885 933 988 1094 1085 1012 225
S2 312 250 169 26 - 225
IN is the number of 0.5 X 2.0 m sampling quadrats used to measure yield.
3 is the mean of the annual standard deviations for the 12 years. Each yield value in the table has a corresponding standard deviation.
N’ 8 8 14 20 24 24 24 24 24 24 18 16 19
Soil water (cm)
4.4 3.5 10.7
5.1 4.9 13.6
4.2 8.8 13.6 7.3 8.3 7.2 7.6
600
0
JFMAMJJASOND
MONTH
Fig. 1. Average annual solar radiation curve for eastern Montana.
forecast procedure and the model-predicted yields were only slightly different from those originally reported by Wight and Hanks (1981). The initial forecast each year was made April 1 and was based on yield indices generated by the forage production model using actual soil water content data on April 1 and 55 years of weather data (daily precipitation and mean air temperature). A yield index was calculated for each year of the 55 years of weather data. From the resulting population of yield indices, a mean and standard deviation was calculated and used to determine the forage yield forecast for that forecast year. Yield forecasts were updated May 1, June 1, July 1, and July 15 using the same procedure, except that the current year’s or forecast year’s weather data were used for the period April 1 to date of forecast and the 55 years of weather data was used from the date of forecast to the end of the growing season. Yield index distributions were compared to normal distri- butions using standard-normal plots, and the Kolmogorov-Smir- nov goodness of fit test (Yevjevich 1972).
Results and Discussion
Standard-normal plots of the 55 yield indices for a random sample of yield forecasts were similar to the plot in Fig. 2, indicat- ing that the yield indices were approximately normally distributed. Only for the July 1 forecasts did the distribution of yield indices indicate a significant departure (a! = .05) from normality, according to the Kolmogorov-Smirnov test. In calculating the population of yield indices for each forecast, only the weather data input varied from year to year. As the forecast date approached the harvest date, the historical data input became an increasingly smaller portion of the total and represented only 15 of 106 days of input on the July 1 forecast date. Therefore, the standard deviations of the yield forecasts were small and slight distortions in the distribution would indicate a statistically significant departure from normality. Forecast yields for each date for each year are presented in Table 1. Each forecast yield was determined from the mean of the 55 yield indices calculated for each year of weather record. The potential yield for the study site was about 1300 kg/ ha (Wight and Hanks 198 1) and actual yields were calculated from the yield indices using the relationship: Y = Y,T/Tp. The harvest date (July 15) forecasts or model-predicted yields were calculated entirely from actual or current year’s soil water and weather data, and are, thus, a measure
CHANCE OF EXCEEDING (%I
,,099.6 ,‘,, 9996 , 95 I 90 I 60 I 706050403D IIII I 20 10 - Y.&I” 5 2 I 0.5 02 -1
as -
MEAN 0.563aa- STD. DEV SAMPLE S!ZE 55 0.229
aot~~~
a2 a5 1 2 5 a a IO 20 3040506070 ’ I”” 60 ’ 90 95 ” 9699 ‘*I 998O’
CHANCE OF NOT EXCEEDING(%)
Fig. 2. Standard-normal plot of 55 yield indices that were calculatedfrom 1917-1971 historical weather records and used to make the April 1 yield forecast for 1967.
of the model’s ability to predict annual yield.
As would be expected, the standard deviations decreased as the forecast date approached the harvest date (Table I). Averaged over the 12 years, the standard deviations were 312, 250, 169, and 26 kg/ ha for the April 1, May 1, June 1, and July I forecast dates, respectively. There was little variation in standard deviations among years. For the April 1 forecast, 1 I of the 12 standard deviations were within a 260-351 kg/ha range. In 1972, a nearly saturated soil water profile significantly reduced the yield variation over the 55 years and the forecast standard deviation was only 208 kg/ ha.
While somewhat inadequate in sample size, the occurrence of the 12 years of actual (field-measured) yields in relationship to the forecasted yields and their standard deviations provide an indica- tion of the validity of the forecast procedure. In a normal popula- tion, 68% of the observations will occur within plus or minus one standard deviation of the population mean. Thus, for each forecast date, 8 of the 12 actual yields (assuming the model is without error) should have been within plus or minus one standard deviation of the forecasted yield. By comparing the April 1, May 1, June I, and July 1 forecasted yields with the harvest date, model-predicted yields, we evaluated the forecast procedure under the assumption that the model was without error. For the April 1, May I, June I, and July 1 forecast dates, 7, 10, 11, and 10 harvest date, model- predicted yields, respectively, were within the standard deviations of the forecast yields. Only for the April 1 forecasts was the occurrence of the harvest date, model-predicted yields within the standard deviations of the forecast yields less than the 8 expected for a normal distribution.
A more practical evaluation is a comparison of field-measured or actual yields with the forecasted yields. This provides a test of both the model and the forecast procedure. As indicated in Table 2, actual yields were generally within the standard deviations of the forecasted yields the expected 68% of the time. Occurrences of the
Table 2. Number of field-measured yields that were within the indicated intervals of the forecasted yields for the 12.year period, 1967-1968, Sidney, Montana.
Forecast date f Std. Dev. f 250 kg/ ha f 25% of Mean
April 1 8 7 7
May 1 9 9 8
June I 8 9 IO
Julv I 5 10 9
DENSE CLAY RANGE SITE MILES CITY, MONTANA -
f
c /
/
- = YIELD INDEX 0.4/ -- - s STANDARD DEVIATION
0.01
0 20 40 60 80 100
BEGINNING SOIL WATER (PERCENT of AVAILABLE WATER HOLDING CAPACITY)
Fig. 3. Relationship of the forecasted yield index to beginning soil water content for a dense clay range site near Miles City, Montana.
actual yields within a plus or minus 250 kg/ha and a plus or minus
25% interval around the forecasted yeild are also presented in Table 2.
Application
Annual yield forecasts can be made using a yield predicting model that utilizes weather variables as the independent or driving variables and a population of annual weather records from a nearby weather station. The ERHYM model (Wight and Neff 1983) used in this study has the forecast procedure as an option. This model was used in 1981 to forecast yields for over 40 U.S. Department of Interior, Bureau of Land Management managed range sites in central and eastern Montana.
A more practical application of the forecast procedure is demon- strated in Figure 3 where forecasted yield indices are plotted against a range of beginning soil water contents for a specific range site. The yield indices in Figure 3 were calculated in terms of the long-term average yield for a dense clay range site near Miles City, Mont. Current year yield forecasts for this site can be determined by measuring the beginning soil water content and locating the appropriate yield index on the curve in Figure 3. For example, if the beginning soil water content was 20% (this is available soil water), the yield index would be about 0.85 with a standard devia- tion of 0.33. Thus we would forecast a yield that was 85% of the long-term average. If the soil water profile was nearly saturated at the beginning of the growing season, then a yield index of about
1.40 with a standard deviation of 0.08 would be expected. A series of charts, such as this, with beginning soil water measurements could be used to make annual yield forecasts.
It should be noted that when stochastic weather generation methods are available, they are an excellent means of providing the climatic variables. Stochastic generation is particularly valuable when weather records are limited. Also, the distribution of model generated yields can be used to determine more than means and standard deviations. As pointed out by Arkin et al. (1980). these distributions can be used to determine: “( 1) the probability that a certain yield value might occur, (2) the most likely occurring yield, (3) the greatest and smallest occurring yield, (4) the probabilities that the yield may be greater or smaller than a particular value, (5) the average yield value expected over many years, and (6) the expected year-to-year variability in yields over many years.”
Literature Cited
Arkin, G.F., S.J. Maas, and C.W. Richardson. 1980. Forecasting grain sorghum yields using simulated weather data and updating techniques. Trans. Amer. Sot. Agr. Engin. 23:676-680.
Currie. P-0.. and G. Peterson. 1966. Using growing season precipitation to predict crested wheatgrass yields. J. Range Manage. 19:?!84-i88. Hanson. C.L.. J.R. Wieht. J.P. Smith. and S. Smoliak. 1982. Use of
historical yield data G forecast rangk herbage production. J. Range Manage. 35:614-616.
Innis, G.S. (Ed.). 1978. Grassland simulation model. Ecological Studies 26, Springer-Verlag, New York, p. I-298.
Johnston, A., Smolink, A.D. Smith, and L.E. Lutwick. 1969. Seasonal precipitation, evaporation, soil moisture, and yield of fertilized range vegetation. Can. J. Plant Sci. 49:123-128.
Larsen, G.A., and R.B. Pense. 1982. Stochastic simulation of daily climatic data for agronomic models. Agron. J. 74:510-514.
Richardson, C.W. 1981. Stochastic simulation of daily precipitation, tem- perature, and solar radiation. Water Resour. Res. 17:182-190. Rogler, G.A., and H.J. Haas. 1947. Range production as related to soil
moisture and precipitation on the northern Great Plains. J. Amer. Sot. Agron. 39:378-389.
Smoliak, S. 1956. Influence of climatic conditions on forage production of shortgrass rangeland. J. Range Manage. 9:89-91.
Sneva, F.A., and D.N. Hyder. 1962. Estimating herbage production on semiarid ranges in the intermountain region. J. Range Manage. 15:88-93. Wight, J.R., and A.L. Black. 1971. Yield potentials of rangelands as related
to nutrient and soil water availabiltiy, p. 48-54. In: Proc., Annu. Pacific Northwest Fertilizer Confer., July 13-15, Bozeman, Mont. Pacific Northwest Plant Food Assoc., Portland, Ore.
Wight, J.R., and R.J. Hanks. 1981. A water-balance, climate model for range herbage production. J. Range Manage. 34:307-3 1 I.
Wight, J.R.,and E.L. Neff. 1983. Soil-Vegetation-Hydrology Studies, Vol. Il. User manual for ERHYM: The Ekalaka Rangeland Hydrology and Yield Model. USDA, ARS, Agr. Res. Ser., ARR-W-29/Jan. 1983. Yevjevich, V. 1972. Probability statistics in hydrology. Water Resour.
Pub., Fort Collins, Colo.
Emergence and Seedling Survival of Two
Warm-season Grasses as Influenced by the
Timing of Precipitation:
A
Greenhouse Study
G.W. FRASIER, D.A. WOOLHISER, AND J.R. COX Abstract
A greenhouse study was conducted to determine seedling survf- val probabilities of sideoats grama (Bouteloua curtipndula (Mich x.) Torr.) and cochise lovegrass (Erugrostis lehmanniana Nees X Eragrostis trichophora Coss & Dur.) for selected combinations of initial wet-day and dry-day sequences. Three separate 14-day experiments were conducted using 1, 2, 3, 4, and 5 days wet followed with 5 days dry. The number of emerging seedlings grow- ing from 10 seeds placed in a sand media in small plastic cones were counted daily. A total of 50 to 7wc of the sideoats grama seeds emerged in the initial wet period, but over 50% of the seedlings died in the following S-day dry period, resulting in less than a 35% survival rate. The cochise lovegrass was slower to germinate and less susceptible to the effect of the 5-day dry period, which resulted in 40 to 60% seedling survival. With the l-and t-day wet sequences, the maximum cochise lovegrass plant count was not achieved until the final rewet period. With the exception of 5 days wet, the length of the initial wet period did not significantly affect the number of surviving lovegrass seedlings. This information offers the possibil- ity of incorporating the probablistic aspects of precipitation and soil water relations into a description of the seedling environment.
Plant establishment from seed requires a viable seed and a favorable environment for seedling development. Seeds often ger- minate, but the seedlings may fail to survive because inadequate soil moisture has limited the development of a root system capable of supporting the plant through later periods of less favorable moisture conditions. Available soil moisture was a factor in the establishment of blue grama (Bourelouugrucilis (Willd. ex H.B.K.) Lag. Ex. Griffiths), crested wheatgrass (Agropyron desertorum
Fisch. ex Link) Schuh.), and Russian wildrye (Elymus junceus
(Fisch.)) plantings in arid portions of the Central High Plains (Briske and Wilson 1977, 1978, 1980; Wilson and Briske 1979a; Hassanyar and Wilson 1978). Water stress during germination and seedling development was detrimental to the survival of western wheatgrass (Agropyron smithii Rydb), alkali sacaton (Sporobolus airoides (Torr.) Torr.), galleta (Hiluriujumesii(Torr.) Benth), blue grama, mountain mahogany (Cercocarpus mountainus Raf.), broom snakeweed (Gutierrezia sarothrae (Pursh) Butt. and Rusby), and mesquite (Prosopis juliflora (SW.) DC.) (Knipe 1968, 1973; Piatt 1976; Kruse 1970; Scifres and Brock 1969). Young et al. Authors are research hydraulic engineers, USDA-ARS Southwest Rangeland Watershed Research Center, and range scientist, USDA-AR& Aridland Ecosystem Improvement, 2000 E. Allen Road, Tucson, Arizona 85719.
This paper was presented in part at the 1983 annual meeting of the Society for Range Management in Albuquerque, New Mexico, February 14-18,1983, under the title of “Drought Effects on the Germination and Seedling Emergence of Selected Warm-Season Grasses.”
Authors acknowledge the assistance of John Griggs and Griselda Blankenagle, physical science technician and graduate student, respectively, in collecting and sum- marizing the data. Their excellent work is gratefully recognized.
Manuscript received January 31, 1983.
(1970) found reduction in plant survival from water stress with various legumes.
Wilson and Briske (1979b) found that blue grama required 2 to 4 days of moist soil conditions and soil temperatures above l5O C, to germinate and initiate seminal root growth, and that this period must be followed with a similar period after 2 to 8 weeks for the growth of adventitious roots to ensure plant establishment. The first wet-dry sequence after planting is probably equally important to emergence and initial establishment of other species.
One might hypothesize that if the first wet period is short, the seeds may not germinate and will survive the sequence as viable seeds. If the first wet sequence is long enough to germinate most or all of the seeds, and is followed by a long drought, a “false start”as described by Young et al. (1970) would occur. If the first wet sequence is long enough for the seedlings to develop to the stage where they can survive drought-induced quiescence, a high percen- tage of the plants might survive a long drought period. By identify- ing alternate periods of favorable soil moisture and drought condi- tions within the seed bed or rooting zone, techniques for achieving successful plant establishment can be enhanced.
If the duration of the first period of favorable soil moisture after planting is represented as Li and the duration of the following drought period as La, then, for any combination of (Lr LO), there will be a particular response in the number of viable seeds, viable seedlings, and dead seeds or seedlings at the end of the drought period.
In nonirrigated areas, the soil water used in seed germination and plant establishment is replenished by precipitation and depleted by evaporation. In arid and semiarid regions, the precipi- tation process is intermittent, with the periods of rainfall being much shorter than the intervening dry periods. Temperature and solar radiation, which affect the loss of soil water by evaporation, are both interrelated with precipitation and are more likely to be below average on rainy days than on dry days (Richardson 198 I). For a given region, soil type, and planting date the joint distribu- tion (LI, LO) can be estimated from climatic data. By evaluating the response of various range plant species to several wet-dry sequen- ces, it should be possible to identify the species for a given planting date or the planting date for a given species that would maximize the probability of surviving the first wet-dry sequence. The first step in developing the relationships of plant response to the initial drought period is to determine the relative differences in seedling survival of selected plant species when subjected to various wet-dry water sequences.
This study was conducted in a greenhouse and designed to determine the relative effects of selected combinations of initial wet-day and dry-day sequences on the emergence and survival of 2 warm-season grasses, sideoats grama (Bouteloua curtipendula
(Mich x.) Torr.) and cochise lovegrass (Eragrostis lehmanianna
ITrade names are mentioned solely for the purpose of providing specific information and do not imply recommendation or endorsement by the U.S. Department of Agriculture.
Nees X Eragrostis trichophora Coss. & Dur.).
Methods and Materials
Two cotton balls were placed in the bottom of 3.8 cm diameter by 20 cm long tapered plastic cones (Ray Leach “conetainers”)‘. The cones were filled with 210 grams of dry 60-mesh silica sand to provide a reproducible, uniform growth media and to reduce prob- lems of undesirable seed contamination. Ten dehulled seeds of sideoats grama or cochise lovegrass (lot germination, 98-100%) were placed on the dry surface and covered with a 2 to 3-mm layer of dry sand.
Water was applied to the cones with an overhead reciprocating spray boom sprinkling system. Two grooved tracks on each side supported the spray bar at a height of 77 cm above the top of the cones. A variable speed reversible electric motor operated a chain drive to move the spray bar across the work area at a speed of 10 cm/ sec. The spray bar consisted of I .3 cm diameter galvanized steel pipe with 2 spray nozzles (Spray Systems No. l/ 8 K - SS.75 Floodjet)] spaced 113 cm apart, and operated at a pressure of 207 kPa. The work area under the spray bar was 175 by 250 cm.
The spray pattern was checked using cones with sealed bottoms placed in a row perpendicular to the travel direction of the spray boom. The volume of water from 10 passes of the spray bar was measured. Four areas, each 7 cone rows wide, were located in which the maximum variation of application was f 0.2 mm of water per cone (2.5 to 3.0 mm total application). The coefficient of variation within an area ranged from 5 to 8% and the standard deviation of applied water ranged from 0.14 to 0.20.
The seeded cones were watered in predetermined wet-dry-wet sequences of 1, 2, 3, 4, and 5 days wet followed with 5 days dry. Following the dry period, the cones were sprayed daily for the remainder of the 14 day study to determine the number of viable seeds which had not previously germinated. Two separate 14day experiments were conducted using the 5 wet-dry water sequences. One additional experiment was conducted with the 1 day and 2 day wet, 5 day dry water sequences.
Six cones in each rack were randomly selected for daily weighing to determine evapotranspiration losses and the quantity of water applied. All cones initially received 20 grams of water (=lOYc moisture by weight). In the wet period, cones were sprinkled daily with sufficient water to bring the average moisture content of the cones back to the original weight. Water was not added to the cones during the dry period. Cones in a dry period were protected during sprinkling with rack covers constructed from 18-gauge
galvanized sheet metal. To reduce the possibility of plants dying because of a nutrient deficiency, each cone was given 5 ml of a one-quarter strength Hoagland solution on day 10.
The study design was 5 completely randomized blocks with 6 replications for each species. The number of live plants in each cone was counted each day. The daily plant counts were analyzed by analysis of variance techniques. Duncan’s new multiple range test was used to evaluate differences among means (P10.05).
A separate study was conducted to measure the change in the water content of the sand with depth during a dry sequence. Eighteen cones were filled with 170 g of dry sand, then 17 g of water were applied to the surface. After equilibrating for 2 h, the cones were reweighed. Three cones were randomly selected and sectioned into 3-mm layers. The moisture content of each layer was gravi- metrically determined. The remaining cones were placed, unco- vered, in the greenhouse adjacent to the seeded cones. Each day at 0900 and 1400 h, all of the remaining cones were reweighed and 3 cones randomly selected for moisture content with depth determi- nation. The relationship between soil moisture content and soil moisture tension for the sand was determined using standard por- ous pressure plant techniques.
Results and Discussion
Daily mean plant counts for days 2, 5,9, and 12 are shown in Table 1 for the I and 2 day wet, 5 day dry water sequences. Day 2 represents the period when sideoats grama had the greatest number of seedlings. Day 5 is the middle of the dry period. Day 9 was indicative of the period of plant recovery following the dry period. Day 12 represents the period when all remaining viable seeds would have emerged.
Differences of 1.0 to 1.5 plants per cone were significant (P10.05) (Table I). The total average water loss for both species, for experiments 1,2, and 3, in the 1 day wet water sequence, was 42.6, 45.2, and 43.3 mm per cone, respectively. For the 2 day wet sequence, the total average water loss was 44.9,46.0, and 44.1 mm per cone for each experiment, respectively. Differences in the means of the total water use were not significant (P10.05). Differ- ences in the daily means of the number of plants between the experiments are attributed to variability in solar radiation and air temperature caused by cloudy days, coupled with minor differen- ces in depth of seeding. Seeds planted at deeper depths had longer periods of time when soil moisture was adequate for germination, root elongation, and seedling emergence. Even in the greenhouse on clear, sunny days, the surface layer of the sand in the cones dried
Table 1. Comparison of the mean plant count of 30 cones planted with 10 seeds of sideoats gnma or Cochise lovegrass at four selected days in three experiments with 1 and 2 day wet, 5 day dry moisture sequence.
Plants/cones
Day after Moisture sequence Sideoats Cochise lovegrass
Planting Days wet Days dry Exp I Exp 2 Exp 3 Exp I Exp 2 Exp 3
2 1 5 5.8al 4.7b 4.lb 0.3a N.P.2 O.la
2 5 6.6a 6.0a 6.la 0.7a CO. lb 0.3b
5 1 5 2.9a 0.9b 0.8b 2.7a O.lb 0.6b
2 5 5.0a 1.9b 2.6b 5.5a 1.5c 4.lb
9 1 5 1.6a 1.3a 1.8a 3.2b 2.2c 4.Ia
2 5 1.7a 0.5a 2.la 3.2b 1.8~ 4.6a
12 1 5 1.7a 2.la 2.5a 3.8a 3.6a 4Sa
2 5 1.3b 0.7b 2.5a 3.5b 2.8b 4.8a
‘Means in rows, for each species, with different letters are significant (P50.05). ‘No plants in any cone.
very rapidly. On cloudy days, the media surface remained wetter for longer periods because of reduced evaporation rates.
The daily plant count data for the 5 different wet-dry water sequences show that the sideoats grama produced seedlings very rapidly, even with the short water sequences (Fig. 1). Fifty to 70% of the seeds produced seedlings in 2 to 5 days. Over 70% of these seedlings succumbed during the dry period after the 1,2, or 3 day wet water sequence, and over 50% died after the 4 and 5 day wet sequences (Table 2). The final plant count, after 13 days, repres- ented 25 to 50% of the maximum number of plants counted, but only 15 to 35% of the number of seeds planted.
The cochise lovegrass was slower to germinate, and there was a more pronounced effect of the length of the first water period on the initial plant count (Fig. 1). Approximately 10% of the seeds produced a seedling in 4 days with the 1 day wet water sequence, while over 60% produced seedlings in 5 days with the 5 day wet water sequence (Table 2). Plant mortality from the dry period ranged from 10% with the 5 day wet sequence, to 30% with the 2 and 3 day wet sequences. Final plant count showed that 40 to 60% of the cochise lovegrass seeds produced seedlings, which repres- ented 75% survival of the maximum plant count. With the excep- tion of the 5 day wet combination, the length of the initial wet period did not affect the number of surviving seedlings.
There was a 10 to 30% increase in plants per cone following the dry period for the sideoats grama at 1 day wet and the cochise lovegrass at 1 day and 2day wet (Table 2). This increase, following resumption of watering, is a result of new plants from seeds which had not germinated in the initial wetting and, possibly, a few plants which were not completely dead in the dry period. The increased plant count, following the dry period, was not evident for the 4and 5 day initial wet sequences. Total water use among the 5 water sequences was not significantly different (EO.05).
The relation of seed germination of sideoats grama and cochise lovegrass to soil moisture tension is unknown. The germination of alkali sacaton, western wheatgrass, lehmann lovegrass (Erugrostis lehmanniana Nees.), Arizona cottontop (Trichachne insularis Nees.), and plains bristlegrass (Setaria macrostachy H.B.K.) and some range legumes have been reduced by 50% at soil moisture tensions of 1 to 4 bars, compared to germination at 0 bars (Knipe
1968, 1973; Young et al. 1970; Tapia and Schmutz 1971). The potential effect of surface drying of the soil on seedling establishment is demonstrated in Figure 2. Moisture tensions of 4 bars were attained when the sand had dried to slightly less than 2% moisture by weight. The 2% moisture level was reached in the top
15 mm after approximately 48 h. If a moisture tension of 4 bars is 6-
4-
2- (L w -
?o, , ,
( , , , , SIDEOATS , , , GRAMA , , , ,z
a
ii
6
2 4 6 8 IO I2 14
DAY OF STUDY
Fig. 1. Daily mean plant count from 10 see& of sideoats grama and Cochise lovegrass during 5 different lengths of wet periods each followed with 5 dry days.
critical to survival of sideoats grama or cochise lovegrass seedlings, then germinated seeds with a seminal root of less than 15 mm by the end of 48 h probably did not survive. This would explain the relatively high percentage of sideoats grama plants which died during the 5 day dry period following 1 and 2 day wet periods.
The probability of a plant or viable seed surviving the first wet and subsequent dry period after planting can be denoted as q(Lt, LO), Olqll, where Lr = length of wet sequence in days, and Lo =
Table 2. The effect of five wet-dry sequences on the initial, minimum, end final plant counts of sideoats grama and Cochise lovegrass.
Moisture sequence Total water loss per Plants per cone
Days wet Days dry cone in mm Initial Minimum Final
Sideoats 43.8 44.9 44.5 41.5 44.3
4 9 6:3
(2)W 1.2 (6) b 2.3 (13) bc
(3) b 1.5 (7) b 1.5 (13) d
6.2 (3) b 1.7 (8) b 1.8 (13)cd
7.1 (5) a 3.4 (13) a 3.4 (13) a
6.1 (5) b 3.0 (13) a 3.0 (13) ab
I 5 Cochise 43.8
44.9 44.5 41.5 44.3
1.2 (4) d I.0 (6) d 4.1 (13) b
2.6 (7) c 3.9 (13) b
3.8 (4) c
5.3 (5) b 3.6 (8) b 4.0 (13) b
5.5 (5) b 4.0 (9) b 4.4 (13) b
6.7 (8) a 6.0 (13) a 6.0 (13) a
‘The number in parenthesis is the day of that plant count.
Weans in a column for each species with different letters are significant (P10.05).
Table 3. Survival probability for Cochise lovegrass and sideoats grama for various combinations of the first wet-dry days (h, Lo) sequence following planting.
Dry Cbchise lovegrass Sideoats grama
days Wet days (LI) (Wet days (LI)
(Lo) 1 2 3 4 5 1 2 3 4 5
I <II (..:, .5 .6 .6
(::)
.6 .4 .7 .6
(.3)’
2 5 .5 .6 .4 .4 .6 .6
3 .5 .5 .7 (..:, .3 .3 .6 .6
4 (.$ .4 .5 .6 .2 .2 .5 .4
5 (.i) (.?) .4 .4 .6 (..I)) .l .2 .4 .3
‘Numbers in parentheses are the inferred probabilities that a viable seed has not germinated during the wet period for that 0-1, Lo) combination
length of dry sequence in days. In this study, the survival probabil- ity,q(i,S),i=1,2 ,..., 5, is simply the number of plants counted on a given day after the dry sequence divided by 10, the number of seeds planted. This probability does not account for additional water, nutrient, or plant competition factors. We can also estimate the intervening values. For the longer wet sequences, we assume that all seeds would have germinated, and that the average number of surviving plants is only a function of the length of the dry period, LO. For short wet sequences with dry sequences less than 5 days, we can estimate the average number of viable seeds that did not germinate in the initial wetting from the increase in the number of plants following the termination of the 5 day dry sequence. From these data, we can compute the discrete function q(L1, LO), LI, LO =
1, 2, ..*, 5 (Table 3). These survival probabilities are a function of
the random variables LI and LO, which in turn are affected by solar radiation, temperature, wind, seedbed microtopography and other factors.
The survival probability for 1 wet day followed by 5 dry days is approximately 0.4 for the cochise lovegrass and 0.2 for sideoats grama. Both probabilities include viable, but ungerminated, seeds which have survived this sequence. This demonstrates that a rapid response by sideoats grama to a simple signal (rain on one day) may reduce plant reproductive potential.
The expected survival probability can be estimated by the equation:
_ *
E(q) = Z C N-1, LO) P. (LI, LO) Lo = 1 L1 q 1
(
I(
E 2( E I z ki 0 3(
4(
5C
SOIL SURFACE II ,,,,,/,,,,,,,,,,,,,,,,,,,, Ill,,,rrrlr,rll,,r,,,,,,‘,,,,
IO 8
6
I
MOISTURE TENSION CURVE
\
- ISBAR
- 3BAR
-IBAR
- I/3BAR
1
WETTEO FROM SURFACE 0 I 2 3 4 5 6
MOISTURE CONTENT BY WEIGHT - %
I I , 1 , I , I 1 I I I I I 1 , I I I I
0 5 IO ’ 15 20
WATER CONTENT BY WEIGHT-X
Fig. 2. Soil moisture profiles of 60-mesh silica sandin cones during the dry periodfollowing initial wetting and moisture tension curve as determined
/iom pressure plate studies.
where Pn (Ll, LO) is the discrete joint density function of the first wet-dry sequence after planting on day(n). The function P, (LI, LO) can be estimated by simulation or simplified analytic models. In the field, the planting date will be further constrained by tempera- ture considerations.
As an approximation, let us define a wetdry sequence of length k + j as the sequence of k consecutive wet days followed by j consecutive dry days bounded by a dry day and a wet day at the beginning and end of the sequence, respectively. Given that a wetdry sequence begins on day i, it is defined as the event:
(Xi-1 = 0, Xi = I, Xi+1 = I . Xi+k-1 q I, Xi+k = 0, Xi+k+l = 0, . . . xi+k+j-1 = 0, Xi+k+j = 1)
where Xi = 1 if rain occurred on day i; Xi = 0 otherwise.
If the sequence Xi, i = 1,2. . . is described by a Markov chain, the probability of this sequence is (cf. Roldan and Woolhiser 1982).
P(LI=~,Lo=J) =P(Xi-r=O,Xi=j,... Xitk-l= 1, xi+k = 0 . . . Xi+k+l = 0, . Xi+k+i;l = 0, Xi+k!\ = IIXi-1 = 0, Xi = I) (2)
= p11 ‘(l-pll)poo- (I-poo)
where prr is the probability of a transition from a wet day to a wet day, and p00 is the probability of a transition from a dry day to a dry day.
The probability that a wet-dry sequence is included in the sample space shown in Table 3 is
PILl 55, Lo151 =i i pllL-l(I-p~l)p~~-‘(I-poo) (3)
This probability is 0.88 for Tombstone, Ariz., for the 14day period beginning July 19, and 0.44for the 14day period beginning June 21, so the sequences covered in our experiments are relevant. Of course, a more realistic description of the joint density function of the wet day period would account for the random amounts of rainfall on a wet day as well as the rate of evaporation from the soil. For a particular grass species, the best planting date, (N), is that which maximizes E(q) (Equation(l)). Our hypothesis is that the first wet-dry sequence is critical, and the most adapted species has the largest maximum E(q). In many cases, this hypothesis seems plausible. A notable exception, however, is blue grama grass. Wilson and Briske (1979a) found that a favorable first wet sequence is necessary, kut not sufficient for plant establishment. The occurrence of hard seeds is a survival mechanism that nature
uses to increase survival probablity, and thus reduce the impor- tance of the first wet-dry sequence.
There are many other factors which must be evaluated and field verified before this approach can be used for achieving improved seeding success or developing a better understanding of species adaptability. However, this approach offers the possibility of incorporating the probabilistic aspects of precipitation quantity and frequency with basic understanding of plant-water relations into a description of the seedling environment.
Literature Cited
Briske, D.D.,and A.M. Wilson. 1977. Temperature effects on adventitious root development in blue grama seedlings. J. Range Manage. 30:276-280. Briske, D.D., and A.M. Wilson. 1978. Moisture and temperature require-
ments for adventitious root development in blue grama seedlings. J. Range Manage. 31:174-178.
Briske, D.D., and A.M. Wilson. 1980. Drought effects on adventitious root development in blue grama seedlings. J. Range Manage. 33:323-327. Hassanyar, A.S., and A.M. Wilson. 1978. Drought tolerance of seminal
lateral root apices in crested wheatgrass and Russian wildrye. J. Range Manage. 31:254-258.
Kruse, W.H. 1970. Temperature and moisture stress affect germination of Gurierreziusaro~hrue(broom snakeweed). J. Range Manage. 23: 143-144. Knipe, O.D. 1968. Effects of moisture stress on germination of alkali
sacaton, galleta, and blue grama. J. Range Manage. 21:3-4.
Knipe, O.D. 1973. Western wheatgrass germination as related to tempera- ture, light, and moisture stress. J. Range Manage. 26:68-69.
Pintt, J.R. 1976. Effects of water stress and temperature on germination of true mountain mahogany. J. Range Manage. 29:138-140.
Richardson, C.W. 1981. Stochastic simulation of daily precipitation, temperature, and solar radiation. Water Resources Res. 17:182-190. Roldan, J., and D.A. Woolhiser. 1982. Stochastic daily precipitation mod-
els. 1. A comparison of occurrence processes. Water Resource Res. 18:1451-1459.
Scifre-s, C.J.,and J.H. Brock. 1969. Moisture-temperature interrelations in germination and early seedling development of mesquite. J. Range Man- age. 22~334-337.
Tapia, C.R., and E.M. Schmutz. 1971. Germination responses of three desert grasses to moisture stress and light. J. Range Manage. 24:292-295. Wilson, A.M., and D.D. Briske. 1979a. Seminal and adventitious root
growth of blue grama seedlings on the central plains. J. Range Manage. 32:209-213.
Wilson, A.M., and D.D. Briske. 1979b. Drought and temperature effects on the establishment of blue grama seedlings. p. 359-361. In: Proc. 1st Internat. Range Cong., Denver, Cola., August, 1978. Society for Range Management.
Young, J.A., R.A. Evans,and B.L. Kay. 1970. Germination characteristics of range legumes. J. Range Manage. 23:98-103.
SRM Elections Results
The Elections Committee Chairman, Tom Eaman, along with Colorado Section members counted the ballots for new officers on Tuesday, December 6, 1983. Elected officers are:
Second Vice President- F.E. Busby Directors 1984-1986 - John Hunter
Dick Whetsell
Present Directors Al McLean and Don Johnson will leave the Board in February 1984.
Bylaws Amendments were favorably approved: the recommendation that the name of Executive Secretary be amended to read Executive Vice President and the recom- mendation that a commercial class of membership be established.
Ballots and tally sheets are retained in the Denver office for one year for review. Approximately 30% of the membership voted.