JUNE, 2017
STATE OF SCHOOL SAFETY IN PUBLIC URBAN PRIMARY SCHOOLS: A CASE OF KASARANI SUB-COUNTY IN NAIROBI CITY COUNTY, KENYA
RUTH KILUYI WAKAPISI
A RESEARCH PROJECT SUBMITTED TO THE DEPARTMENT OF EDUCATIONAL MANAGEMENT, POLICY AND CURRICULUM STUDIES IN
DECLARATION
I declare that this project is my original work and has not been presented in any other university/institution for consideration of any certification. This research project has been complemented by referenced sources duly acknowledged. Where text, data, graphics, pictures or tables have been borrowed from other works including the internet, the sources are specifically accredited through referencing in accordance with anti-plagiarism regulations.
………... ………
RUTH KILUYI WAKAPISI DATE
E55/OL/13342/2004
SUPERVISOR’S DECLARATION:
I confirm that the work reported in this project was carried out by the candidate under my supervision as the University Supervisor.
………... ………
DR. GEORGE ONYANGO DATE
LECTURER
DEPARTMENT OF EDUCATIONAL MANAGEMENT, POLICY AND CURRICULUM STUDIES
DEDICATION
ACKNOWLEDGEMENTS
TABLE OF CONTENTS
DECLARATION... ii
DEDICATION... iii
ACKNOWLEDGEMENTS ... iv
TABLE OF CONTENTS ... v
LIST OF TABLES ... ix
LIST OF FIGURES ... x
ABBREVIATIONS AND ACRONYMS ... xi
ABSTRACT ... xii
CHAPTER ONE: INTRODUCTION AND BACKGROUND TO THE STUDY ... 1
1.1 Introduction of the Study ... 1
1.2 Background to the Study ... 1
1.3 Statement of the Problem ... 6
1.4 Purpose of the Study ... 7
1.5 Objectives of the Study ... 7
1.6 Research Questions ... 8
1.7 Significance of the Study ... 8
1.8 Limitations and Delimitations of the Study ... 9
1.8.1 Limitations ... 9
1.8.2 Delimitations ... 9
1.9 Assumptions of the Study ... 10
1.10 Theoretical Model and Conceptual Framework ... 10
1.11 Operational Definition of Key Terms ... 14
CHAPTER TWO: REVIEW OF RELATED LITERATURE ... 15
2.1 Introduction ... 15
2.2 Safety Situation in Public Primary Schools ... 15
2.2.1 School Physical Environment ... 15
2.2.2 Risks and Accidents ... 18
2.3 Safety Challenges in Public Primary Schools ... 20
2.5 School Safety Management ... 25
2.5.1 Role of the School ... 26
2.5.2 School Safety Measures ... 27
CHAPTER THREE: RESEARCH DESIGN AND METHODOLOGY ... 31
3.1 Introduction ... 31
3.2 Research Design ... 31
3.3 Variables ... 31
3.3.1 Dependent Variables ... 32
3.3.2 Independent Variables ... 32
3.4 Location of the Study ... 32
3.5 Target Population ... 33
3.5.1 Schools ... 33
3.5.2 Respondents ... 33
3.6 Sampling Procedure ... 33
3.6.1 Schools ... 34
3.6.2 Respondents ... 34
3.7 Research Instruments ... 35
3.7.1 School Safety Questionnaire for Students ... 35
3.7.2 School Safety Questionnaire for Teachers ... 36
3.7.3 School Safety Questionnaire for Headteachers ... 36
3.7.4 Observation Checklists ... 36
3.8 Validity and reliability of Research Instruments ... 36
3.8.1 Validity ... 36
3.8.2 Reliability ... 37
3.9 Piloting of Research Instruments ... 37
3.10 Data Collection Techniques ... 38
3.11 Logistical and Ethical Considerations ... 39
CHAPTER FOUR:
PRESENTATION OF FINDINGS, INTERPRETATION AND DISCUSSION ... 40
4.1 Introduction ... 40
4.2 The Safety Situation in Public Primary Schools in Kasarani Sub-County ... 40
4.2.1 Safety on School Grounds ... 40
4.2.2 Safety in Physical Infrastructure ... 42
4.2.3 Safety in School Environment ... 43
4.2.4 Exposure to Risks and Accidents ... 44
4.3 Safety Challenges in Public Urban Primary Schools in Kasarani Sub-County .... 50
4.3.1 Overcrowding ... 50
4.3.2 Inadequate Teachers ... 51
4.3.3 Lack of Funds ... 52
4.3.4 Infrastructural Challenges ... 52
4.4 Factors Influencing Safety in Primary Schools in Kasarani Sub-County ... 54
4.4.1 School Location ... 54
4.4.2 Availability of Resources ... 56
4.4.3 Enrolment Rates ... 58
4.4.4 School Activities ... 59
4.4.5 Safety School Management Practices ... 60
4.5 Safety Measures Available in Primary Schools in Kasarani Sub-County ... 62
4.5.1 Safety Standards Manual ... 62
4.5.2 Fire and Emergency Procedures ... 63
4.5.3 Supervision Rates... 64
4.5.4 Safety Training... 65
CHAPTER FIVE: SUMMARY, CONCLUSIONS AND RECOMMENDATIONS ... 67
5.1 Introduction ... 67
5.2 Summary of Findings ... 67
5.2.1 Safety Situation in Public Urban Primary Schools ... 67
5.2.3 Factors Influencing Safety in Primary Schools ... 68
5.2.4 Safety Measures Available in Public Urban Primary Schools ... 69
5.3 Conclusions of the Study ... 70
5.4 Recommendations of the Study ... 71
5.5 Suggestions for Further Research ... 73
REFERENCES ... 74
APPENDICES ... 80
APPENDIX 1: SCHOOL SAFETY QUESTIONNAIRE FOR CLASS TEACHERS .... 80
APPENDIX 2: SCHOOL SAFETY QUESTIONNAIRE FOR HEADTEACHERS ... 83
APPENDIX 3: SCHOOL SAFETY QUESTIONNAIRE FOR PUPILS ... 86
APPENDIX 4: SCHOOL SAFETY OBSERVATION CHECKLIST ... 90
APPENDIX 5: LIST OF PRIMARY SCHOOLS IN KASARANI SUB COUNTY ... 91
APPENDIX 6: GRADUATE SCHOOL APPROVAL LETTER ... 92
APPENDIX 7: NACOSTI RESEARCH AUTHORIZATION LETTER ... 93
APPENDIX 8: NACOSTI RESEARCH PERMIT ... 94
APPENDIX 9: NCC AUTHORIZATION LETTER ... 95
LIST OF TABLES
3.1: Sample Frame ... 34
3.2: Response Rate... 38
4.1: Assessment of the school grounds ... 41
4.2: Assessment of the school environment ... 44
4.3: Frequency of Accidents ... 45
4.4: Frequency of Injuries per Pupil ... 46
4.5: Types Injuries Reported ... 47
4.6: Number of school days missed due to injury ... 48
4.7: Action Taken After Injury ... 48
4.8: Severity of Injuries ... 49
4.9: Number of Pupils per Class ... 50
4.10: Number of Teachers per School. ... 51
4.11: Infrastructural challenges ... 53
4.12: School Location ... 54
4.13: Income Levels of Pupil’s Families ... 56
4.14: School Enrollment ... 58
4.15: Causes of Injuries at School ... 59
4.16: Safety Management Practices ... 60
4.17: Supervision Rates at various times ... 64
LIST OF FIGURES
FIGURE 1.1: Theoretical Model ... 11
FIGURE 1.2: School Safety Conceptual Framework ... 13
FIGURE 2.1: Heinrich’s Domino Theory ... 25
FIGURE 4.1: Safety in Physical Infrastructure. ... 42
ABBREVIATIONS AND ACRONYMS
ANPPCAN African Network for the Prevention and Protection against Child Abuse and Neglect
CWS Church World Service
DPMF Development Policy Management Forum
EFA Education for All
FGM Female Genital Mutilation
FPE Free Primary Education
KENPRO Kenya Projects Organization
KESSP Kenya Education Sector Support Programme
MoE Ministry of Education
MoEST Ministry of Education, Science and Technology
NCC Nairobi City Council
SSMS Safety standard Manual for Schools TSC Teachers Service Commission
ABSTRACT
CHAPTER ONE
INTRODUCTION AND BACKGROUND TO THE STUDY 1.1 Introduction of the Study
Access to education is a basic human right. It is one of the Millennium Development goals and therefore measures should be put in place to ensure children attending school are not at risk of physical harm or injury. Schools are unique environments that harbour significant numbers of children engaged in different activities at any one point during the day (Frumkin, Geller & Rubin, 2006). Frumkin et al., (2006) emphasize the importance of school safety by their argument that schools harbour peoples’ collective dreams for the future and they are places where values are passed on, technical solutions originate and the world of tomorrow is shaped. Without doubt, school safety is a crucial issue that deserves the attention of leaders, administrators, educators, parents and other stakeholders. Studies carried out concerning school safety cannot be exhaustive because of the dynamic nature of the contemporary world and the safety concept. Moreover, ensuring that children are safe and able to learn is an essential component of an effective education system.
1.2 Background to the Study
all students while at school, they have a duty to provide reasonable supervision of students and maintain the safety of the school grounds (Jimerson & Furlong, 2006). Jimerson et al., (2006) propose that in cases of accidents in school, the school management is liable to civil damages of those harmed. According to their argument, this liability may arise from various factors and may depend on what the school did or didn’t.
Shaw (2005) presents a wide range of interpretations of what constitutes school safety. She identifies a variety of problems that schools want to be safe from: Accidents and injury, theft, self-harm, bullying and intimidation, health hazards like water and food borne diseases, sexual and racial harassment, pupil violence and aggression against pupils/staff, vandalism, arson, drugs and alcohol abuse, abduction or kidnappings, among others. To comprehensively understand the concept of school safety, it is important to examine all the aspects of school safety as highlighted by Shaw (2005). However, this is not possible with a single study due to time and financial constraints. The study focused on the physical safety within the school environment, that is, accidents and injury.
Threats to school safety can arise from human actions as vandalism, arson and violent crime; human error; natural hazards like earthquakes, floods and storms; structural and environmental hazards, etc. While students and staff are killed in unsafe schools, built in harm’s way, or not built to withstand expected and recurring natural hazards,
classrooms were destroyed. In 2007, cyclone destroyed 496 school buildings and damaged 2,110 more in Bangladesh (UNISDR, 2008).
In Uganda, nineteen school girls were killed in a dormitory fire in April 2008 in Buddo School in Kampala Uganda, (Carol Natukunda, 2008). Kenya has also witnessed mostly school fires for example: March 2001-Kyanguli Boys School Machakos, where 58 boys were burnt beyond recognition and March 1998-Bombululu Secondary School suspected electrical fault caused a fire which killed at least 24 girls (Cooper, 2015). In August 2012, eight young girls were burnt beyond recognition in a fire believed to have been caused by an electricity fault which razed their dormitory in Asumbi Girls Boarding Primary School in Homa Bay County (Kwamboka & Omoro, 2012). Injuries at school and bus accidents have also been reported; for example in July 2013, thirteen people, including nine students and four teachers lost their lives when a bus belonging to Rioma Secondary School overturned (Miruka, 2012). School safety is an issue that is receiving greater attention. Many countries have come up with ways of promoting and ensuring safety in their schools.
inappropriate school facilities and infrastructure. In Kenya, studies by (Mwenga, 2011), (Kyalo & Kipngeno, 2009), (Mwangi J, 2013) and (Omolo & Simatwa, 2010) were done with regard to school safety but they focused on secondary tier and in particular safety preparedness, awareness and implementation of safety standards and policies.
In Kenya, the policy on safety and the welfare of learners in schools is culminated in the Safety Standards Manual for Schools in Kenya; and other education circulars. This manual recognizes safety as a key component to quality education and outlines the guidelines that schools should follow to ensure safety of learners. It emphasizes among other things on safety in physical infrastructure, school environment, school grounds and disaster risk reduction.
category of children that should be considered first and foremost when discussing school safety.
The Kenya Education Act, CAP 211, stipulates that the registration of schools can only be approved if the school facilities are suitable and adequate, considering the number, ages and sex of the learners attending the school and should meet the minimum requirements of health and safety to comply with building regulations in law. The Education Act also mandates the Minister for Education to regulate the conduct and management of schools. The Directorate of Quality Assurance and Standards officers are supposed to inspect schools with regard to compliance with safety standards and guidelines. One of such regulations is prescription of minimum health and safety standards of learners and an acceptable learning environment.
was timely given the increased enrolment of learners at primary level resulting from Free Primary Education.
1.3 Statement of the Problem
Education in Kenya today has undergone massive expansion with the enrolment rates on the increase especially since the introduction of Universal Primary Education. According to the medium term plan of Vision 2030 for the period 2008-2012, enrolment in primary schools rose from 6.1 million in 2002 to 8.2 million in 2007, while national net enrolment ratio was 91.6 percent, the highest it has been in the Kenyan history(Ministry of State for Planning National Development and Vision 2030 (2009). The high enrolments rates have doubtlessly impacted on the primary schools capacity in terms of infrastructure and human resources. Consequently, the government policy on funding education is extremely inadequate and does not adequately address the infrastructural needs. The amount of funding remitted mainly goes to teachers’ salaries and other administrative costs leaving huge gaps in other areas such as basic physical facilities (ANPPCAN report, 2005).
Despite the efforts by the Ministry, the legal provisions and safety standards, there is still a big concern over safety in schools because of the broad and dynamic nature of the matter. The persistent recurrence of safety problems in schools even after the release of the Safety and Standards Manual in 2008 raises questions on the state of safety in schools. Given the massive expansion of Education in Kenya, the widening scope of school safety characterized by dynamic nature of incidents in schools, children’s particular vulnerability to physical hazards, the high enrolment rates due to Free Primary Education amid the limited infrastructural, financial resources and teacher shortages; there is need for school safety research particularly in primary schools. The study therefore addressed this gap by determining the state of safety in public primary schools in Kasarani Sub-county of Nairobi County and made recommendations on what should be done to enhance school safety in order to secure the safety of learners in particular.
1.4 Purpose of the Study
The purpose of the study was to determine the state of school safety in public urban primary schools Kasarani Sub-county in Nairobi County and particularly in Kasarani District.
1.5 Objectives of the Study
The specific objectives of the study were:
i) To establish the safety situation in public urban primary schools in Kasarani Sub-county.
iv) To establish the safety measures available to enhance safety in primary school in Kasarani Sub-county.
1.6 Research Questions
The study was guided by the following research questions: i) What is the safety situation in public urban primary schools? ii) What are the safety challenges in public urban primary schools?
iii) What are the factors influencing the state of safety in the primary schools?
iv) What safety measures or precautions have the primary schools put in place to enhance safety?
1.7 Significance of the Study
The study provides useful information on safety in primary schools to school administration and teachers that may enable them to come up with appropriate safety measures in their respective schools in order to enhance school safety. The study is also beneficial to school children because it makes recommendations to create an environment where children can feel well, learn and play safely, thrive and reach their full potential without fear of injury or illness.
children where safety concerns are present. Finally, the study provides added information to the body of knowledge in the area of school safety that may form a basis for further research and recommendation of any relevant adjustment policy towards school safety in schools.
1.8 Limitations and Delimitations of the Study
This section describes situations and circumstances that may have affected or restricted the research methodology and data analysis.
1.8.1 Limitations
Limitations are the shortcomings, conditions or influences that cannot be controlled by the researcher that place restrictions on the methodology and conclusions (Simon & Goes, 2013). The following were the limitations of this study:
i) The study was not carried out in all public primary schools in Nairobi City County due to time constraints so the sample size might not have been adequate enough to guarantee accurate generalization in the whole county. However, the study ensured that the sample size was as representative as possible.
ii) School safety is a sensitive issue, coupled up with interference of the school timetable reduced the response level. This was addressed by seeking permission with school headteachers who in turn assigned class teachers to distribute the questionnaires at convenient times.
1.8.2 Delimitations
i) School safety is very broad and not all components of safety as outlined in the Safety Standards Manual for Schools were covered. The study focused on the physical safety of pupils in regard to the school grounds, school environment, physical infrastructure and disaster and risk reduction and;
ii) Drugs, violence, diseases and other health issues relating to the school physical environment were excluded from the study for purposes of obtaining manageable data for analysis and interpretation.
1.9 Assumptions of the Study
Assumptions are things assumed to be true.
i) The study assumed that both headteachers, class teachers and students will have some basic forms of safety knowledge that would help them to objectively fill the questionnaire;
ii) The study assumed that all the schools had some measures or precaution in place to reduce risk or disaster ; and
iii) The study assumed that each school had cases of reported accidents or incidents among the pupils. This would help gauge the safety situation and risk levels.
1.10 Theoretical Model and Conceptual Framework
Unsafe Schools Safe Schools
School based-risk factors
School location
Overcrowding
Poor supervision
Understaffing
Poverty
Staff incompetence
Deteriorating physical facilities
School based-protective factors
Good quality physical facilities
Consistency of student supervision
Adequate number of teachers
Trained & experienced teachers
Neighborhood stability
Availability of resources
School location
Figure 1.1: Theoretical Model (Sprague & Walker, 2002)
According to Sprague and Walker, risk factors are conditions that move the school to poor safety. The greater the number of risk factors/conditions, the more powerful they are, and the longer they are in evidence, the greater their destructive impact on the school safety. Protective factors have the potential to buffer, offset and reduce the destructive impact of risk conditions on the school status and operation. Based on Sprague and Walker’s conceptualization, schools can be distributed a long this dimension in terms of performance indicators that document how relatively safe or unsafe they are. For example the levels of supervision, number of incidents or accidents and safety measures available, condition of the school grounds and physical infrastructure among others.
down by Laxton and Sprague (2005) to three multi-level factors, namely; school characteristics, characteristics of community served by the school and characteristics of individual students. Laxton et al., (2005) conceptualized school-violence associated variables using a risk and protective factors model. They proposed that the risk for school safety is determined by individual student characteristics, community characteristics and the school characteristics.
School safety was best summed up by Barton (2009) who argued that schools are best positioned to be viewed using a continuum from safe to unsafe given the specific student, school and community characteristics. This is to say school safety is dependent on the three factors. If an individual school registers a positive profile across the three dimensions, it is much more likely to experience acceptable levels of safety than if it registers a negative profile where risk factors are in evidence.
This model provided a basis for school safety indicators which are the independent variables of the study. Basically, the independent variables of the study are the risk and protective factors identified in the model. Based on this model, Gottfredson (2001) reasoned that prevention efforts directly targeting these risk and protective factors will reduce the problem of school safety. Educational stakeholders can use this approach to foster safe and secure environments.
Independent Variables Dependent Variable
Figure 1.2: School Safety Conceptual Framework; Source: Researcher, (2016)
The conceptual framework identifies the dimensions of safety in relation to the physical safety of pupils in school. It shows that for schools to ensure the physical safety of pupils and prevent accidents, injuries and bodily harm, the four dimensions of school safety as highlighted by the Safety Standards Manual have to be considered with regard to the safety situation of the school, challenges, factors and safety measures in place.
STATE OF SCHOOL SAFETY SCHOOL SAFETY
SITUATION
SCHOOL SAFETY CHALLENGES
SCHOOL SAFETY FACTORS
1.11 Operational Definition of Key Terms
Safety: Freedom from danger and possible harm by learners.
State: Position of something with respect to conditions and circumstances. Safety Situation: A set of things happening and conditions existing in a particular
place that affect safety.
Hazard: A condition that exposes a learner to personal harm, injury or death. Protective Factors:
Conditions that have the potential to buffer, offset and reduce the destructive impact of risk conditions to learners.
Risk Factors: Conditions that make a school unsafe and prone to accidents for learners.
Risk:
The likelihood that an occurrence will cause harm to learners. School Safety: A school condition in which students are safe and feel safe from
physical harm.
Standards: The level or measure of quality and attainment of safety.
CHAPTER TWO
REVIEW OF RELATED LITERATURE
2.1 Introduction
This chapter provides a review of literature related to safety management and state of safety in public primary schools with regard to school safety situation, challenges and factors affecting school safety and school safety measures. One theory was explored in an effort to give an in depth understanding of the safety concept.
2.2 Safety Situation in Public Primary Schools
School safety situation is a set of things happening and conditions existing in a school that can affect safety of learners. The set of things happening in regard to safety are risks, accidents and injuries given the condition of the school grounds, environment and physical structure. Sprague et al., (2002) proposed that the relative safety of a school is presented in terms of the number and nature of risk and protective factors present. In this context, the risk and protective factors define the safety situation of a school.
Risk factors are conditions that move the school to the direction of less safety. The greater the number of risk conditions, the more powerful they are, and the longer they are in evidence, and the longer they are in evidence, the greater their destructive impact on the school’s safety. Protective factors have the potential to buffer, offset and reduce the
destructive impact of risk conditions on the school status and operation.
2.2.1 School Physical Environment
chemicals and biological agents; the site on which a school is located; and the surrounding environment including the air, water, and materials with which children may come into contact, as well as nearby land uses, roadways and other hazards (WHO; Information series on School Health-2003). The Ministry of Education and Church World Service (2008) safety manual defines school grounds (environment) as the entire enclosure designated for use by the school for any of its activities such as learning, playing, games or sports. Such grounds should be large to house the required physical infrastructure, including classrooms, offices, latrines, playing grounds and assembly walkways, among others. The school ground must be well managed and the necessary documents of ownership obtained from the Ministry of Lands or the Local Authority, whichever is appropriate.
Equally important as far as the school environment is concerned are the traffic zones. The traffic zones may include the physical characteristics of a school zone, the design, the school parking, drop-off and pick-up zone, bus routes, pavement markings/indications and traffic control or speed limit for school vehicles and parents’ vehicles. Other factors
to be considered in school traffic zones are the age of the learners, their population, and the modes of transport used by the learners to and from school among many others.
buildings and facilities are made available and they serve the purpose for which they were built, it is also important that safety issues are considered. It is, therefore, important to note that schools should not be established anywhere just because there is availability of buildings and facilities.
Schools located near busy roads or water bodies have increased risks. Falls and injuries within the school grounds can occur as a result of poorly maintained schools or poor construction management, broken windows, open pits, unsupervised parking lots and swimming pools, dilapidated steps, exposed nails, and missing stair rails present obvious hazards and increase the risk of injury. One of the standards from The Ministry of Education and Church World Service (2008) safety manual is that school grounds should, wherever possible, be located in places with least climatic hazards such as floods, wind effects and similar natural hazards. Similarly, schools should be located away from disruptive landuse activities such as industrial facilities, bars, heavy traffic routes, sewage or dump sites etc. Given the state of urban planning in the city, this might not be the case of many schools especially the private ones.
These areas, including the play ground are places where most accidents and injuries are likely to occur. A school that is well planned and maintained fosters an environment that enables effective teaching, promotes safety and reduces the likelihood of accidental injury (Jenne & Greene, 1976).
In conclusion, to ensure safety of children at school, school authorities/management should identify school facility safety hazards and permanently remediate them. This will render school facility safe. Similarly, by applying monitoring, maintenance and timely repairs, most safety hazards can be eliminated or at least minimized. A safe school environment should allow children to play safely and ensure staff freedom to supervise and interact with the pupils. School physical structures should be appropriate, adequate and properly located, devoid of any risks to users or to those around them. They should also comply with the provisions of the Education Act (Cap 211), Public Health Act (Cap 242) and Ministry of Public Works building regulations/standard.
2.2.2 Risks and Accidents
efforts should not only be directed at a few occurrences of serious injuries when there are so many incidents that provide significant opportunities for prevention. While major injuries are rare, small incidents provide many opportunities to prevent the major injuries from occurring. Safety actions are most effective when directed at incidents and minor accidents with a high loss potential. Accidents, risks, incidents, and injuries at school are predictable and preventable. If schools understand the interrelatedness of these situations, then approach should focus on prevention. Prevention is cheaper than first aid, medical treatment and administrative costs.
2.3 Safety Challenges in Public Primary Schools
The introduction of free primary in 2003 saw gross enrolment rate (GER) increase from 92% in 2002 to 104% in 2003 of the school age children population (Otach, 2008), resulting in more than 1.5 million children who were previously out of school joining primary schools (UNESCO, 2005). This increased enrolment resulted to a number of challenges which in turn affect school safety. These challenges as pointed by KENPRO (2010), include congested classrooms, limited physical facilities and shortage of qualified teachers. According to KENPRO (2010), the ratio of teacher-pupil in some schools was found to be 1:70 far beyond the recommended ratio of 1:40. Inadequate physical facilities were also cited as a challenge resulting from free primary education where schools did not have adequate classrooms to accommodate the large number of pupils resulting in congestion. KENPRO also found that a number of classroom conditions were poor and lacked sufficient desks.
Other studies have also cited similar challenges for public primary schools. Wanjohi (2013)in his study about the issues affecting free primary education in Kenya also found that the increase in enrolment brought about constraints on the scarce teaching and learning resources. He argued that that the government had not been able to keep up with the pace of maintaining the balance between teacher demand and supply resulting in high teacher-pupil ratio.
that could not accommodate the large number of pupils enrolled and that most classrooms were congested, in poor condition and poorly lit. MoEST (2005) found that the biggest infrastructure challenges facing schools were inadequate classrooms and poor state of existing facilities.
2.4 Factors Affecting Safety in Public Primary Schools
Sprague et al., (2002) proposed four factors as potential sources of vulnerability to school safety, namely: Design, use and supervision of school space; administrative and management practices of the school; nature of neighbourhood and community served by the school and characteristics of students enrolled. Laxton (2005) narrowed down the factors to three, namely; school characteristics, characteristics of the community served by school and characteristics of the school population. School characteristics were listed as total school enrolment, average student/teacher ratio, number and type of entrances/exists, level and patterns of supervision, location and design, traffic patterns and their management and size of the school relative to capacity.
Musimba (2005) conducted a research on a comparative study of the levels of adherence and implementation of safety standards guidelines in secondary schools in Machakos District and established that lack of finance was the main cause of failure in levels of implementation of the guideline. This implies that levels of funding are a factor as far as schools safety is concerned. His study however, only considered the aspect of implementation of guidelines and did not consider how lack of funds affects the other areas of safety such as physical environment, school physical structure and safety measures.
Without funding, schools cannot improve and expand their facilities to match increased student enrolment and address overcrowding. Before the introduction of FPE, parents through the cost sharing policy contributed to construction and maintenance of school
facilities. This changed with the introduction of FPE where it was assumed that
Government would take care of all costs of running schools. According to the Nairobi
City County Taskforce on Education (2014), the FPE fund committed towards
infrastructure, school repairs and maintenance is not adequate to maintain school
infrastructure resulting to deterioration of public schools (NCC, 2014). This deterioration
of the physical facilities affects safety as pointed by Salminen et al., (2014) that the
physical environment of the school is a contributing factor to majority of school injuries.
many activities that present a range of hazards. Passmore, Gallagher and Guyer (1989) argue that distribution of injuries changes over time due to students’ development of physical skill, strength, size, judgment, balance, and experience with hazards. They agree with the statement that the developmental stage of children is a factor in safety. According to them, the rates of playground injuries decrease as elementary school children mature, while the rates of athletic injuries increase steadily through middle/junior high school to high school.
Most accidents and injuries in school occur during school activities like sports and games, play activities, trips and excursions, classroom and outdoor activities, experiments, swimming and other extracurricular activities. For example, hazards and risks during school activities can be as follows: playground equipment/item, steps and slopes, litter, used needles, trees, electric wires, swimming pools, sharp corners/edges, parking lots and other unsupervised places.
that all trips be subjected to vigorous risk assessment which must be suitable and sufficient.
Jenne et al., (1976) proposed that the location of a school directly affects the safety, wellbeing and educational experience of the student. This statement concurs with UNICEF (2009) proposal that schools should not be located close to sources of excessive noise (traffic, railways, industries, informal sector activities) or excessive pollution or odors (waste belts, abattoirs). According to UNICEF, locations should protect children from safety, health and environmental hazards, such as flooding, excessive noise, odor, dust, waste belts, fuel depots, small- and large-scale industries, traffic, crime and vandalism. The same views were emphasized by the MoE (2008) in the safety and standards manual for school where it proposed that wherever possible, school grounds should be located in places with least climatic hazards such as floods, wind effects and similar natural hazards and disruptive landuse activities such as industrial facilities, bars, heavy traffic routes, sewage or dump sites.
Figure 2.1: Heinrich’s Domino Theory (1931)
Based on this theory, all incidents are directly related to the factors (dominoes) which are; Social Environment and Ancestry, Fault of Person, Unsafe Act or Mechanical or Physical Hazard (unsafe condition), Accident, and Injury. This theory outlines the sequence of accidents as follows: - Injury, caused by an accident, due to; unsafe act and/or mechanical or physical hazard, due to; Fault of the Person, caused by their; ancestry and social Environment. When there is an injury or property damage, all five factors are involved. If the fifth domino falls, it is because the first domino fell causing the others to fall in turn. If one of the factors in the sequence leading to an accident can be removed, the loss can be prevented. For example, eliminating an unsafe act makes the action of the precedent factors ineffective. The first three dominoes represent the factors that affect safety and cause accidents and injuries.
2.5 School Safety Management
Kirwan (1998) described safety management as the actual practices, roles and functions associated with remaining safe. Safety management practices not only improve learning
Heinrich’s Domino Theory
conditions but also positively influence learners’ attitudes and behaviours with regard to safety, thereby reducing accidents in school (Vinodkumar, 2010).
2.5.1 Role of the School
Schools apart from imparting knowledge and skills, perform the important role of caring for children while their parents are at work. In this role, schools serve to contain children, and increasingly, to protect them from accidental or intentional harm. A positive and responsible attitude to safety by the school is, therefore, important.
Schools merit special concern because of children’s vulnerability and present an unparalleled opportunity to promote children’s health and safety (Frumkin et al., 2006).
Their argument about the rationale behind school safety and team approach to safety is fundamental as far as this study is concerned. The emphasis on the children’s
vulnerability and health is significant in regard to safety in primary schools. The vulnerability of primary school children by virtue of their ages, the exploratory nature of children’s play/learning activities and to some extent their ignorance of risks associated
According to Beckmann et al., (1995) and Alexander et al., (1992), the educator is expected to act as a prudent father of the family, because in his/her status and position, is delegated to act in the place of the parent. This statement although sounding hard on the school and the educator, best sums up the degree of responsibility the school or the educator should take in ensuring safety of children in school.
2.5.2 School Safety Measures
UNICEF (2009) proposes that schools should have resources and procedures in place to deal swiftly and decisively with specific dangers to children health and safety like warning systems, training teachers and students in simple first-aid skills, installing fire extinguishers and emergency lighting, scheduling evacuation drills and creating designated assembly points, safe areas and ways of calling for assistance. According to Bray, Van Wyk and Oosthuizen (1989), the school should provide proper supervision, instructions and control to learners to ensure their safety. He argues that children sometimes act absent mindedly especially when they are in a group and it is, therefore, the legal duty and the responsibility of the educator to provide sufficient supervision, and to safeguard learners from reasonable foreseeable harm or danger. His arguments are particularly significant and directly applicable to safety in regard to primary schools as the focus of this study.
learners. It can well be said that the study of school safety in schools should be carried out by category of the level of learners.
All these arguments point out to the need for school safety management. Safety management at school may include safety planning, school safety regulations/ practices and emergency preparedness among others. Safety of learners is a phenomenon that cannot be ensured properly without effective management and planning. Malcom (2001) set out a series of principles for managing safety in primary schools. His common sense approach to safety in young children is very significant to safety in primary schools. Accidents in children can to some extent be predicted from what teachers know about children, for example, an electric kettle may not be a hazard in the staffroom but in a classroom. Malcom also identifies items which are essential like first aid, evacuation and training and emphasizes the playground where most accidents are likely to occur. His argument that the way you manage safety in primary school cannot be the same way you manage safety in high school or college points out children vulnerability that calls for special attention when looking at safety issues in primary schools. He does not identify the safety issues as such or the potential hazards within the school compound which this study is keen about. His recommendations and the safety manuals are worth noting.
represent a large pool of data that could be collected and learned from. The chief task of near miss management is to identify near miss and it is the key of the management. The final aim of safety management is the realization of intrinsic safety which means before the occurrence of an accident, it could be prevented by safety measures, rules and regulations. However, safety management based on near miss although more progressive than accident based, cannot be looked at as entirely effective since it might be difficult to record and document all the near miss incidents.
In safety management, hazards are important factors that help people to identify the accidents forming mechanics. Without question, safety management based on hazard is the key to achieve intrinsic safety. This is perhaps the best approach as far as safety management in primary schools is concerned because the daily activities in primary schools present very many opportunities where the hazards can be identified and accidents averted. This approach can be emphasized by Malcom (2001) who identified factors to consider in safety management. The factors as laid down are as follows:
Hazard Identification; the school needs to be aware of what can hurt the pupils.
Risk assessment; this is the degree of risk attached to the identified hazard.
Likelihood; how likely can the harm occur?
Population involved; the school needs to know who is really at risk.
Competence; the levels of pupils, their age and knowledge need also to be
considered.
involving people of low competence (as in the case of primary school pupils), will require significant control measures put in place. Vinodkumar et al., (2010) summarized what school safety management should entail. They identified safety management principles as follows; management commitment, communication and feedback, participation, training, safety policies, rules and regulations. Management commitment will ensure that safety is a priority and deliberate efforts will be made to ensure safety through communication, ensuring participation in safety activities, safety training, safety policies and rules and regulations.
CHAPTER THREE
RESEARCH DESIGN AND METHODOLOGY 3.1 Introduction
The purpose of the study was to determine the state of school safety in public urban primary schools in Kasarani Sub-county in Nairobi County. This chapter presents the research design, variables, location of the study, target population, sampling procedures and study instruments. The final part deals with data collection procedures and data analysis techniques.
3.2 Research Design
The study adopted the descriptive survey research design to determine the state of school safety in public urban primary schools in Kasarani Sub-county. Survey can be used for purposes of description, explanation and exploration. Descriptive research is used to obtain information concerning the current status of a phenomenon to describe what exists with respect to variables or conditions in a situation.
According to Orodho (2009), survey design is the most frequently used method for collecting information about people’s attitudes, opinions, habits or any of the variety of
education or social issues. For this reason, descriptive survey was the most suitable research method to explore the state of school safety in public urban schools because it seeks to obtain data that will describe the school settings in relation to safety.
3.3 Variables
3.3.1 Dependent Variables
The dependent variable of the study was school safety. Schools are described as safe or unsafe depending on the risk and protective factors present.
3.3.2 Independent Variables
As discussed earlier in the theoretical model, school safety can be viewed using a continuum from safe to unsafe given the protective/risk factors present (Barton, 2009). The physical component of school safety can be described along four areas. School safety is, therefore, dependent on the following factors;
i) School Safety situation ii) School Safety challenges iii) School Safety factors iv) School Safety measures
3.4 Location of the Study
Singleton (1993) made two observations that are essential in carrying out research. One, that the ideal setting for any study is one that is directly related to the researcher’s interest and second; that the ideal setting of any study should be easily accessible to the researcher. Kasarani was of interest to the researcher in that the area is wellknown to the researcher and easily accessible.
3.5 Target Population
The target population comprised the public primary schools in Kasarani Sub-county and the respondents were teachers and pupils.
3.5.1 Schools
The target population for the study was the 26 public primary schools in Kasarani Sub-county in Nairobi City County (NCC, 2016).
3.5.2 Respondents
The respondents for the study comprised headteachers, class teachers and students in public urban primary schools in the Kasarani Sub-county in Nairobi City County. Kasarani Sub-county has a total of 28,506 pupils and 610 teachers in the 26 public primary schools. Teachers are in charge of the daily operations, activities in the school and the children attending school and can give background information of the community served by the school.
3.6 Sampling Procedure
3.6.1 Schools
Kasarani Sub-county was purposively selected because of its accessibility and familiarity to the researcher. According to Mugenda and Mugenda (2003), a sample of 10% is adequate. Hence, out of 26 public primary schools in Kasarani Sub-county, Kenya, 10 schools were sampled. This sample accounted for 38% of the total population which enhanced the study representation. Simple random sampling was used to select 10 schools out of the population of 26.
3.6.2 Respondents
Stratified, purposive and simple random sampling procedures were used to sample the respondents. The respondents were first divided into three strata/sub-groups; the head teachers, the class teachers and the students. All the headteachers of the ten schools were purposively sampled. The teachers in the ten schools were purposively sampled where only class teachers of the main classes from class one to eight were picked. Students were first purposively sampled by class where only upper classes were picked and then each class was subjected to a simple random sampling procedure where each student in the class had an equal chance of being picked. Table 3.1 gives the sample size of the respondents:
Table 3.1: Sample Frame
Respondents Total Population Sample Size
Head teachers 10 10
Teachers 610 80
Pupils 28,506 400
Total 29,126 490
3.7 Research Instruments
Peterson, Miller and Skiba (2004) noted that instruments can contribute to the field of school safety only when they include a more complex and representative set of factors involved. Two types of research instruments were used in the study; questionnaires and observation checklist. According to Orodho (2009), a questionnaire has the ability to collect a large amount of information in a reasonably quick space of time, ensure anonymity, allow use of standardized question and have uniform procedures besides being easier to complete.
The questionnaire was used to elicit information on the state of safety, safety concerns, safety challenges and measures put in place to ensure safety of pupils in public primary schools in Kasarani Sub County. The questions were both open and close-ended questions to give respondents freedom to express their views or opinions and make suggestions as well as guide them to give specific responses. A rating scale to measure the opinion of the respondents on the state of safety, challenges, occurrences and supervision rates was used where the upper two positive scales implied a state of safety while the lower two negative scales implied a wanting state of safety in the schools. Questionnaires were administered to all participants in the study through drop and pick method. Three sets of questionnaires for the headteachers, class teachers and pupils were used.
3.7.1 School Safety Questionnaire for Students
3.7.2 School Safety Questionnaire for Teachers
The teacher questionnaire gathered data on teacher and student characteristics, enrolment rates by class, incident occurrences, supervision practices and general effects of safety on schooling. The questionnaire was issued to the class teachers.
3.7.3 School Safety Questionnaire for Headteachers
The school questionnaire was filled by the principals or headteachers to gather information on school characteristics, safety precautions and policies and staff needs.
3.7.4 Observation Checklists
Observation is one of the most important and extensively used methods in social science. Observation checklist was used to establish the nature and state of the schools physical facilities, location of the school, organization of school traffic zones (drop-of/ pick-up points), proximity to other facilities and any other relevant information about the schools.
3.8 Validity and reliability of Research Instruments
Validity is the extent to which a test measures what it is supposed to measure while reliability is the degree to which a test consistently measures whatever it measures (Cronbach, 1990).
3.8.1 Validity
the clarity of instructions were improved to ensure they accurately yield the kind of information required.
3.8.2 Reliability
Reliability is the extent to which a test gives consistent results. Standard questions were clearly constructed and pre-tested to ensure consistency in measurement. Test-retest method was used where respondents administered identical sets of a scale of items at two different times under equivalent conditions. The correlation coefficient to establish the degree of similarity between the two measurements was computed using Spearman rank order correlation as follows;
rxy = NΣxy – (Σx) (Σy)__________ √ [NΣx2 – (Σx2)] [NΣy2–(Σy2)] Where;
N= number of respondents X = scores from the first test Y = scores from the second test
A correlation coefficient (r) of about 0.75 is considered high enough to judge the reliability of the instrument (Orodho, 2004). For this study, the instrument’s reliability yielded a correlation coefficient of 0.815 which was quite reliable for the study.
3.9 Piloting of Research Instruments
one of the schools where questionnaires were administered to the head teacher, one class teacher and a few students.
3.10 Data Collection Techniques
The study collected qualitative and quantitative data using an observation checklist and self-administered questionnaires. A pick and drop method was employed for the questionnaires administered to the schools. To interrupt the school schedules, the researcher requested the schoolheads to assign contact persons who in this case were deputy headteachers or senior teachers to administer the questionnaires to other teachers and the pupils. The researcher then followed up the contact persons and picked the questionnaires once they were filled.
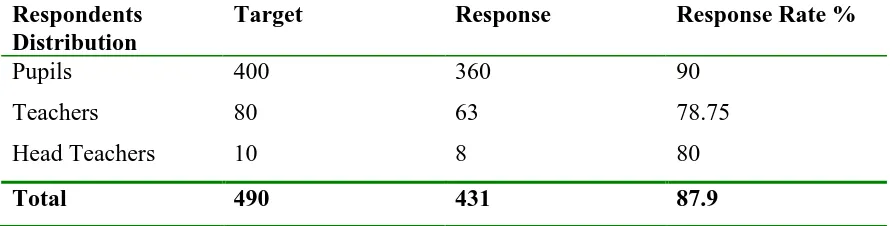
Table 3.2: Response Rate Respondents
Distribution
Target Response Response Rate %
Pupils 400 360 90
Teachers 80 63 78.75
Head Teachers 10 8 80
Total 490 431 87.9
Source: Field Data (2016)
3.11 Logistical and Ethical Considerations
Logistical and ethical consideration were ensured by first, acquisition of a letter from the University and a research permit from the National Council for Science and Technology prior to going to the field for data collection. In addition, a clearance letter and authority to carry out research in the Public Primary Schools was sought from the Nairobi City Council Education Department. Permission was also sought from the schools management, creating rapport with the schools, contact persons and assurance on confidentiality and anonymity were assured.
3.12 Data Analysis, Interpretation and Reporting
CHAPTER FOUR
PRESENTATION OF FINDINGS, INTERPRETATION AND DISCUSSION
4.1 Introduction
This chapter entails the findings of the study based on the data collected from the field guided by the study objectives and research questions. The study sought to establish the State of School Safety in Public Primary Schools with specific focus on Kasarani Sub County in Nairobi City County. The data was analyzed and the information presented in form of pie charts, bar graphs and tables. The interpretation and presentation of data was guided by the study objectives under the following subheadings and their indicators:
i) The safety situation in public urban primary school in Kasarani Sub-county; ii) Safety challenges in public urban primary schools in Kasarani Sub-county; iii) Factors influencing safety in primary school in Kasarani Sub-county; and
iv) Safety measures put in place to enhance safety in primary school in Kasarani Sub-county.
4.2 The Safety Situation in Public Primary Schools in Kasarani Sub-County This section discusses the safety situation in public primary in Kasarani Sub-county. Key areas addressed in the section include; School Physical Infrastructure, School Grounds, and Disaster and Risk reduction.
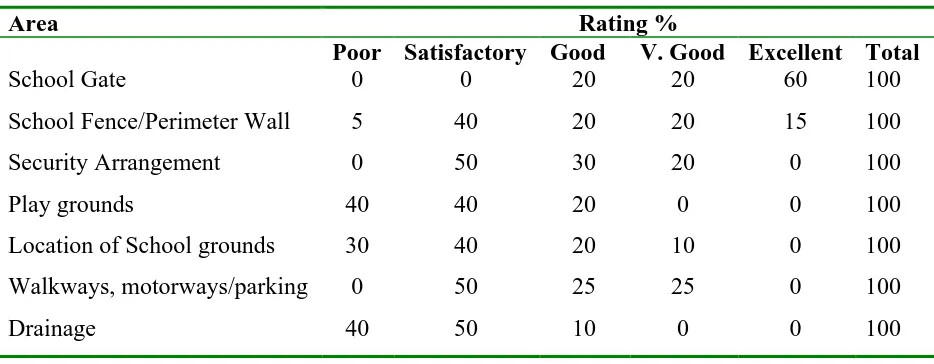
4.2.1 Safety on School Grounds
highlighted under school grounds like school gate, fences, playgrounds, location among others were rated. Table 4.1 shows the ratings:
Table 4.1: Assessment of the school grounds
Area Rating %
Poor Satisfactory Good V. Good Excellent Total
School Gate 0 0 20 20 60 100
School Fence/Perimeter Wall 5 40 20 20 15 100
Security Arrangement 0 50 30 20 0 100
Play grounds 40 40 20 0 0 100
Location of School grounds 30 40 20 10 0 100 Walkways, motorways/parking 0 50 25 25 0 100
Drainage 40 50 10 0 0 100
Source: Field Data (2016)
From the findings, one hundred per cent of the schools had a school gate. The schools had perimeter walls or fence although in a few cases, the perimeter wall was incomplete. A number of schools had the barbed wire fence while a few had a section fenced by iron sheets. This implies that schools are compliant with the Ministry of Education regulations requiring schools to have a fence and gate to keep school children away from harm and limit entry of unauthorized persons in the schools. Forty per cent of the school grounds were uneven and not well maintained.
Forty per cent of the schools reported poor drainage. It emerged that during the rainy seasons the pupils were not able to use the playground because they were muddy and flooded. Some students from the schools in slums reported that their school was flooded with rain water and sewage and were not able to come to school for a number of days during the rainy season. Although the Ministry of Education guidelines stipulate that schools should be located in places not prone to hazards like floods, drainage of school grounds emerged also as a factor that should be put in consideration as far as safety on school grounds is concerned.
4.2.2 Safety in Physical Infrastructure
The physical infrastructure of most public urban schools was found to be poor. Using the observation checklist, different areas in the school were observed and scored to see which areas were safe and which ones were not. The pupils were also asked to rate the safety of different areas in their school to help rate the safety of the school’s physical infrastructure. The ratings for the different areas are given in Figure 4.1 below:
From the findings indicated in Figure 4.1, 77.7% of the pupils rated the school gate as excellent while 69.4% rated the playgrounds poor followed by walkways, motorways and parking (55.5%) and staircases (55.5%) and toilets (41.5%).
Safety of the corridors and staircases was also wanting. Most of the staircases and corridors were narrow and had one way for both entry and exit. Some of the buildings were run down with most of them having broken window panes which pose a safety risk to the children. According to Nhlapo (2006) and Szuba and Young (2003), schools should ensure safe conditions for facility users, by creating a physical setting that is appropriate and adequate for learning through school facilities maintenance like repair, replacement and general upkeep of physical features as found in school buildings, grounds and safety systems. This was not the case as the general condition of the physical infrastructure of the schools indicated lack of proper maintenance of the facilities hence rendering them unsafe for users.
4.2.3 Safety in School Environment
The Safety Standards Manual for Schools describes environmental safety as the proper and sustainable management of the physical surroundings of the school which include management of waste, maintenance of plants and animals within the school compound. Equally important as pointed out by WHO (2003) is the protection from biological, physical, and chemical risks that can threaten children’s health. The different areas of the
Table 4.2: Assessment of the school environment
Poor Satisfactory Good V. Good Excellent Total
Ventilation 0 20 50 20 10 100
Lighting 10 20 40 30 0 100
Waste disposal 20 50 30 0 0 100
Adequacy of buildings 20 60 20 0 0 100
Regular facilities inspection 20 30 40 10 0 100
Source: Field Data, (2016)
As results in Table 4.2 indicate, there are areas that need improvement. Ventilation was rated generally well with 50% of the learners indicating that it is good. Ten per cent of the pupils indicated that lighting was poor. In a few schools, learners indicated that there was no lighting in their classrooms which made it difficult for them to study during early morning or evening. Waste disposal, adequacy of building and regular inspection facilities were each rated poor by 20% of the learners. A number of children indicated that the roofs of their classrooms leak during rainy seasons and the classroom floors were uneven. Inadequacy of classrooms was also cited as expected in urban schools given the high enrolments rates. According to WHO (2003), the components of a healthy school environment are provision of basic necessities, protection form biological, physical and chemical harm. From the results, it is evident that schools have not adequately provided safe school environment.
4.2.4 Exposure to Risks and Accidents
Accidents
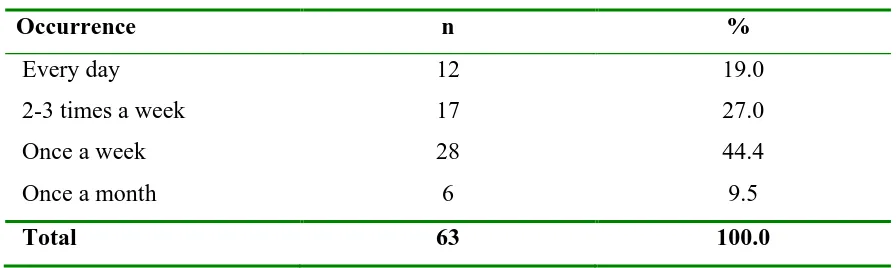
The study sought to find out the occurrence of accidents and the injury characteristics regarding frequency of injuries, type, severity, source and duration. Table 4.3 shows the frequency of accidents in the schools;
Table 4.3: Frequency of Accidents
Occurrence n %
Every day 12 19.0
2-3 times a week 17 27.0
Once a week 28 44.4
Once a month 6 9.5
Total 63 100.0
Source: Field Data (2016)
Frequency of Injuries
Given the time students spend at school and the variety of activities they engage in, the school environment presents many opportunities for injury. The study sought to find out the frequency of injuries to pupils and the results are shown in Table 4.4;
Table 4.4: Frequency of Injuries per Pupil
Injury Occurrences n %
One time 133 36.9
Two times 78 21.7
Three times 10 2.8
More than three times 41 11.4
Never 98 27.2
Total 360 100
Source: Field Data (2016)
The students were presented with the various possible safety issues mainly injuries and were asked to state the frequency at which they have been injured on the school grounds, the cause of the injury and the action taken. The findings show that a cumulative percentage of 72.8% of students have been injured at least once while 27.2 % have never been injured during school hours. According to Manciaux and Romer (1986), the injury rates in children remain fairly constant throughout childhood while the kinds of injuries tend to change with age. This statement agrees with the findings given that the study sampled older learners (class 7 and 8) and the injury rates seemed constant.
Types of Injuries
classrooms and stairs. From the study, the types of injuries reported are shown in Table 4.5.
Table 4.5: Types Injuries Reported
Type of Injury n %
Cut/Burn 81 31
Bruise/Bump/Swelling 85 32
Sprain/Fracture 25 10
Nose Bleed 62 23
Chipped/Broken Teeth 11 4
Total 265 100
Source: Field Data (2016)
Table 4.5 shows that among the injuries reported, major injuries experienced in most schools were bruises and swelling (32%), followed by cuts (31%) then nose bleed (23%), sprains/fractures (10%) and chipped/broken teeth (4%). From the study, it emerged that the main causes of injuries were falls and/or collision with other children. The results seem to agree with a number of studies like Fothergill and Hashemi (1991) and Schelp (1991) which cited fractures, bruises, and cuts as being common injuries among children. While the most frequent injuries in this study were bruises/swelling, Schelp (1991) on the other hand found fractures to be the most frequent. The foregoing could be attributed to differences in school environment and nature of activities.
Impact
Table 4.6: Number of school days missed due to injury
The students were asked to indicate if at all the number of days they missed school due to the injuries and their responses are indicated in Table 4.6.
No. of Days Missed School n %
None 134 51
1 Day 63 24
2-3 Days 37 14
4-5 Days 13 5
A week 16 6
Total 263 100
Source: Field Data (2016)
Although most injuries reported were minor cuts and bruises that could heal quickly, significant numbers were quite serious, resulting in absence from school, medical attention and hospitalization. From the findings, a cumulative percentage of 49 missed school due injuries indicating the severity of the injuries as pointed out by US Congress (1995) who proposed that school days lost is an indicator of severity. These findings are also consistent with Nyangahu, Odero, Ogonda, Shisanya and Morema (2015) whose study on characteristics of injuries among children attending public primary schools in Kisumu municipality found that an average number of missed school days were four days.
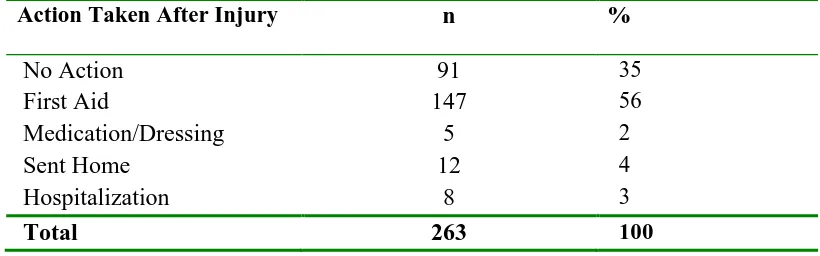
Table 4.7: Action Taken After Injury
Action Taken After Injury n %
No Action 91 35
First Aid 147 56
Medication/Dressing 5 2
Sent Home 12 4
Hospitalization 8 3
Total 263 100
Source: Field Data, (2016)
Fifty six per cent of the pupils, who reported injury, indicated that they received first aid at school, 4% were sent home, 2% received medication/dressing and 3% were hospitalized. Thirty five per cent of the pupils indicated that no action was taken. From the results, it is evident that schools take action after injuries which show that schools are compliant with the Ministry of Education guideline which directs that schools should undertake remedial emergency action in case of sudden illness or accidents and thereafter inform the parents or guardians.
Table 4.8: Severity of Injuries
The study sought to find out the severity of injuries and the responses for the levels of severity are indicated in table 4.8.
Severity of Injury n %
Critical 4 6.3
Marginal 31 49.2
Negligible 28 44.4
Total 63 100.0