Available Online at www.ijcsmc.com
International Journal of Computer Science and Mobile Computing
A Monthly Journal of Computer Science and Information Technology
ISSN 2320–088X
IMPACT FACTOR: 5.258
IJCSMC, Vol. 5, Issue. 9, September 2016, pg.150 – 160
IoT BASED GARBAGE GAS
DETECTION SYSTEM
Sindhoor S
M.Tech 4th Semester, Department of Information Science and Engineering, BIT, Visveswaraya Technological University, India
Abstract- Waste management is the precise name for the collection, transportation, disposal and monitoring of waste. Curb side collection, Incineration is the most common method of disposal in which waste is collected at regular intervals by specialized trucks and subjected for combustion. Diseases which are caused by garbage gases are Asthma, Cholera, various skin diseases etc. The gases emitting from the garbage are methane, carbon monoxide, carbon dioxide, nitrogen. To know the severity of the gases, sensors are deployed which sense the real time data of the garbage gases and transmit the sensed data to the base station. This proposed system mainly aims at transmitting the collected sensor data to the receiver node wirelessly (point to point communication), in parallel it sends the data to the ThingSpeak IOT cloud for graphical representation. On the other side receiver node receives the data from transmitter node and finally sends the SMS to the required user. GPS is added in to the transmitter sensor node in order to locate the location of transmitter node. GSM shield is used to send the received data to the authorized person.
Keywords: Wireless Sensor Network, Internet of Things, GSM, GPS, Ethernet shield, XBEE wireless communication and ThingSpeak.
I. INTRODUCTION
In engineering and also in science, a system is a part of the universe that is studied. There is a remaining part of the universe that exists beyond the boundaries of the system into the environment. It is also known in thermodynamics as a reservoir as environment. Depending on the type of system, the linear momentum, conservation of angular momentum, charge, or other property (including hot day) may interact with the environment by exchanging energy mass. This information theory in some areas, information can also be exchanged. The environment, except for these interactions ignores the analysis of the system.
resources, weather resources that affect the human survival and economic activities. It can be distinguished by the concepts component of the natural environment. It is difficult to find a natural environment which is generally in a continuous change in the ideal of 100% natural to other extreme 0%. More precisely, we have the degree of consideration for various aspects or components of the environment and natural can be seen that non-uniform way. For example, if we take the agricultural field and considering the structure of the mineralogical composition and soil, we will find that the first is very similar to that of the other one and the structure is very different. Natural environment will be used as synonym for habitat.
Introduction to Garbage gases: The disposal of garbage and the treatment of garbage produce several unwanted greenhouse gases. These gases are harmful in nature which contributes the climatic change in the environment. The highest part of the greenhouse gas includes Methane gas. Methane releases at the time of breakdown of several organic matters in the landfills. Other form of the gas which are emitting from the various waste disposals contains Carbon dioxide. But CO2 is less powerful greenhouse gas. Recycling of the waste particles produces few more gases. The reduction of waste particles in the environment decreases the climate change. It also helps in the reduction of various diseases which affects the human being.
Internet of Things: The IoT abbreviated as Internet of Things is the physical objects network. Mainly includes devices, buildings, vehicles and other items which are embedded with the electronics, sensors, software’s and network connectivity which enables the objects to collect and exchange the data. The objects in the Internet of Things allows to sense and control remotely across existing network infrastructure. Opportunity creation for physical world directs the integration into computer based systems. An improved efficiency will be resulted. The accuracy and economic benefit also achieved. Augmentation of Internet of Things with the sensors and the actuators, technology becomes the more general instance of classes of cyber and physical systems, that encompasses the technologies like smart cities, smart homes, smart grids and the intelligent transportation systems. Each of the things is uniquely identifiable with the embedded computing systems but also it is able to interoperate within the existing infrastructure of Internet. The experts used to estimate that IoT consists of almost 50 billion objects by the year 2020.
II. RELATED WORK
and emitting gases from garbage. They worked on particular composition and used high cost sensors.
N. Giannopoulos, C. Giannopoulos, A. Kameas’s paper mainly deals with the implementation and design of wireless sensor network for monitoring variables of environment and effectiveness will be evaluated. With the experience, they confronted problems such as data consistency and network synchronization. They provided design methodology and guidelines for building a system (2). Here mentioned guidelines are complicated, it includes a tough network infrastructure with components which are used for designing and implementation of WSN and also cost of the hardware is comparatively more.
Guillermo Barrenetxea, Franc¸ ois Ingelrest, Gunnar Schaefer, and Martin Vetterli approached by studying wireless sensor networks in the past few years, most results are of theoretical nature and were obtained outside of a practical context. This can be problematic for real applications, especially in the area of environmental monitoring where many factors, such as harsh weather conditions, can greatly influence the performance of such a network, while reliable delivery and high quality measurements are required. Sensor Scope is an interdisciplinary project, lab orated by environmental and networking researchers, that aims at narrowing the gap between theory and practice. Several successful real world deployments have already been undertaken in rugged environments. They analyse the particular requirements of environmental monitoring and how these requirements have been met in the Sensor Scope project and also present an application example of a deployment, undertaken in a harsh mountain environment (3). Here they are using GSM signals. And this paper is purely based on assumptions.
K. Lu, Y. Qian, D. Rodriguez, W. Rivera, and M. Rodriguez all addressed the design issues of an important type of WSN, i.e., WSNs that enable environmental monitoring applications. Overview and analysis of the system under design in the coastal area acoustic monitoring will be provided at the beginning. They did analysis for the provided system and provide the noval architecture that provides the future wireless sensor networks design which provides the monitoring services of the environment. The main focus of the framework is layer design of the network. The considerations in the framework are 1) Heterogeneous WSN shall be provided in the future, 2) The advanced wireless communication technologies must be supported by the designed network layer, 3) Services and applications requirements must be supported by the network layer, 4) Monitoring functionality must be provide by the designed network layer (4). But they cannot address the cost of the deployment of sensors and other requirements and they designed this paper based on assumptions of ongoing project.
the data of forest temperature, bioinformatics, water contamination, traffic control, telecommunication etc. Due to the advancement in the area of wireless sensor network and their ability to generate large amount of spatial/temporal data, always attract researchers for applying data mining techniques and getting interesting results. So they presented the detection of sensor data irregularities, Sensor data clustering, Pattern matching and their interesting results and with these results we can analyse the sensor node data in different ways (5). They applied complex data mining techniques, they are talking about the different ways for analysing the sensor data but cost of deployment and analysis of the sensor data is more.
III. PROPOSED SYSTEM
Garbage is a waste generated due to the various activities generated by various activities such as industry waste, vegetable waste, commercial waste, house hold wastes etc. Improper utilization of the garbage may pose several environment issues namely generation of various hazardous gases which leads to the various health issues. Curb side collection, Incineration is the most common method of disposal in which waste is collected at regular intervals by specialized trucks and subjected for combustion. While carrying the garbage, it must be carried and disposed by following various types of protocols.
The processing of garbage involves the carrying the garbage from one place to other through autos, trucks, cycles etc. But while carrying the gases, the people who collect the garbage must follow some of the rules and regulations. So that it should not affect the environment and the people of the society.
But at the time of processing in the cities is important. Because, in recent days the garbage collection is not collecting properly due to lack of workers, specialized vehicles and other means. So, the garbage which is on the road or land is degrading itself and emits a bad smell. And also in the garbage collectors, it’s not cleaned properly, it emits a bad smell and causes the different diseases like cholera, skin diseases etc. The proper utilization of garbage can help us to get some gases. Some may harm and some are useful. The useful gases which are emitting from the garbage can be utilized for commercial purpose also.
The gases which are emitting from the garbage can cause various diseases and harm the environment. So to know what is the concentration of the garbage in various places and in the main container, this project is designed and implemented in various places and tested the same.
Earlier, people of the society and the concerned officials used to know that some sort of gases are emitting from the garbage. But they don’t know the exact values which are emitting from the garbage. Also they are not getting any data. The people of the society must inform for the concerned officials back to back once the garbage is collected.
from the garbage should be monitored. A hardware or any other means must be installed in the place of garbage. The sensors are going to deploy in the garbage. The sensors must be low cost, less power consumption sensors. With those sensors, sense the gases which are emitting from the garbage and send the same information and send the same information must be stored in the public cloud. Also information must be displayed in the web side accordingly. An SMS has to be sent to the authorized person.
IV. SYSTEM DESIGN
Figure 1: Data Flow Diagram Level-0
The Yourdon/DeMarco notation is followed in the data flow diagram. Figure 1 represents the data flow diagram Level-0. It mainly consists of various gases unit, confuguration, data aggregation and processing unit, storing the data in cloud with displaying unit and SMS unit. The first part which is the various gases unit which comprises of different gases like methane, carbon monoxide, carbon dioxide and temperature. The processing unit mainly consists of Arduino uno board, Xbee board. The cloud part involves Thingspeak cloud which is used in this project. The SMS unit mainly consists of GSM module to send SMS to the authorized person.
Figure 3 Data Flow Diagram of Processing module Level-1
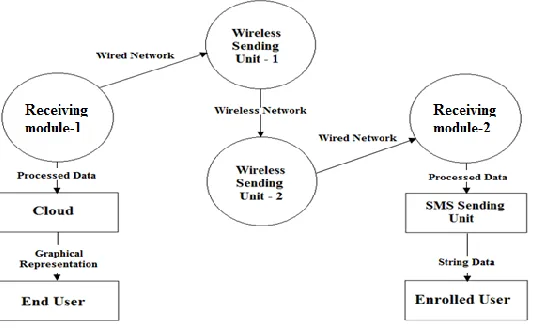
Figure 4 Data Flow Diagram of Receiving module Level-1
Figure 5 Data Flow Diagram of Receiving module Level-2
V. IMPLEMENTATION
(1) (2)
The transmitter section (1) consist of various sensors such as carbon dioxide sensor, carbon monoxide, methane and nitrogen these sensors are nothing but transducers which converts non electrical quantity into electrical quantity why because in nature all are non-electrical in form. Sometime sensors are analog or digital in nature, if the sensors in analog in nature the values produced from the sensor vary with respect to time on the other hand digital sensors they produces only two values either 0 or 1, it is always better to use the sensor with analog in nature to get perfect values.
These values are feed to the heart of our proposed system i.e. Arduino Uno microcontroller board embedded with atmega328 microcontroller, the main function of this board to accept the values from various sensors which is connected to the various analog pin of the Arduino platform and process the values to feed the data to IOT cloud i.e. thing speak and transmit the same values wirelessly using Xbee shield, the communication between Arduino and Xbee is asynchronous in nature because there is no clock signal or start bits used to synchronize the communication. The Xbee board at the transmitter is configured as API coordinator mode so it creates a network and accepts the data from routers of same network (Private area network) each time the Xbee receive 8 bits at the baud rate of 9600 and Xbee boards before connecting to the Arduino Uno platform it must be configured with the software’s i.e. X-CTU or cool term to make it as coordinator.
Receiver section (2) consists of an Arduino Uno platform, Xbee board and GSM (global system for mobile communication). In any network it consists of coordinator, router and end devices. End devices are only communicating to the router, on the other hand router communicates to each other and finally data has sent to the coordinator. The Xbee used at the receiving section configured as API-coordinator so it receives the data from all the router in the network and this data is processed in Arduino Uno and finally make use of GSM shield to send SMS to the authorized person to take care of the garbage’s.
The transmission flow chart starts from Start and ends at updating the sensed values to the ThingSpeak cloud. The receiver section starts from Start and ends by sending SMS to the authorized person or enrolled person.
VI. RESULTS DISCUSSION
The results are displayed in the IoT ThingSpeak cloud. The graphical representation of the results is as shown below.
(1) (2)
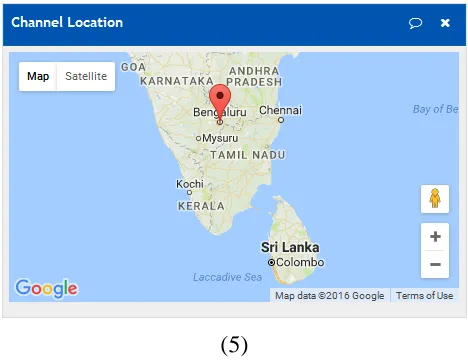
(5)
The content of the carbon dioxide gas in the garbage in figure 1. Here the graph is with the time versus the methane gas. 250-350 ppm for normal background concentration levels in the ambient air at the outside environment. Figure 2 represents the concentration of carbon monoxide. The level of CO which affects the health that effect from CO levels is approximately from 1 to 70 ppm, which are uncertain. Most of the people are not going to experience any of the symptoms. Figure 4 shows the concentration of Methane gas which is extremely dangerous when it is confined to spaces. Methane gas is poisonous for breathe and can kill the humans and animals. Methane (Natural Gas) gas exposure limit is 500ppm. Figure 5 represents the location of the garbage where the hardware is deployed.
VII. CONCLUSION & FUTURE WORK
The toxicity in the garbage gas cause many deadly diseases. To know the level of various garbage gases, the IOT for garbage gasses detection system is constructed. Here the sensors are going to sense the gases and send the same information to the ThingSpeak cloud and an SMS will be send to the concerned person. To access information in the ThingSpeak cloud, the user should have ID and Password to access the cloud, look at the various intensity of gasses and the SMS is forwarded to the required person. Two modules are designed here. One module helps in sending the data to the ThingSpeak cloud. The other module helps in sending SMS to the concerned person.
If the level of Methane gas crosses 500ppm, it may cause severe effect on the environment and to the people around. Also, if Carbon dioxide gas crosses 1000ppm and Carbon monoxide crosses 70ppm it cause severe head ache for the people around. If the temperature crosses 40 degree centigrade, it causes severe effect on nature and to the people around. The system works fine in the range 90 to 100mtr under obstacles and it works fine in the range of 150 to 250mtr in open space.
In this project, the results will be displayed in a public cloud. In future, results can be displayed in a private cloud. Authentication is not included in various levels of the project. It can be included while transmitting and receiving the data, so that third party like hackers is not going to receive the data.
ACKNOWLEDGEMENT
I would like to thank my guide Dr. R. Nagaraja, Professor & Coordinator-PG studies, BIT, Bengaluru for successful completion of this project. The work reported in this paper is supported by the college BIT, Bengaluru. I would like to thank all the teaching and non-teaching staff of the college for their support to complete this project.
REFERENCES
1. Detection of Landfill Gases by Chemoresistive Sensors Based on Titanium, Molybdenum, Tungsten Oxides, Elisabetta Comini, Vincenzo Guidi, Matteo Ferroni, and Giorgio Sberveglieri, IEEE SENSORS JOURNAL, VOL. 5, NO. 1, FEBRUARY 2005
2. N. Giannopoulos, C. Giannopoulos, A. Kameas “Design Guidelines for Building a Wireless Sensor Network for Environmental Monitoring” Proc. of 2009 Panhellenic Conference on Informatics, Corfu Greek, September 2009, pp. 148-152.
3. Guillermo Barrenetxea, Franc¸ ois Ingelrest, Gunnar Schaefer, and Martin Vetterli. “Wirless Sensor Network for Environmantal Monitoring: The SesnsorScope Experience”, Proc. of 2008 International Zurich Seminar on Communications, Zurich, Switzerland, March 2009, pp. 98-101.
4. K. Lu, Y. Qian, D. Rodriguez, W. Rivera, and M. Rodriguez “Wireless Sensor Networks for Environmental Monitoring Applications: A Design Framework”, in Proc. IEEE Global Communications Conference, Washington, DC, November 2007, pp. 1108-1112.
5. Mittal. Ruchi and Bhatia. M.P.S “Wireless Sensor Networks for Monitoring the Environmental Activities” Computational Intelligence and Computing Research (ICCIC), IEEE International Conference, Coimbatore, India, December 2010, pp.1-5.
6. A Complete Beginners Guide To The Arduino Earthshine Design Arduino Starters Kit Manual A Complete Beginners Guide To The Arduino To Noncommercial.
7. XBee Wireless Sensor Networks for Temperature Monitoring by Vongsagon Boonsawat, Jurarat Ekchamanonta, Kulwadee Bumrungkhet, and Somsak Kittipiyakul, School of Information, Computer, and Communication Technology, Sirindhorn International Institute of Technology, Thammasat University, Pathum-Thani, Thailand
8. The carbon monoxide, carbon dioxide, methane and the temperature sensor details will be taken from the website
9. The details of Thingspeak API cloud is taken from the website
http://community.thingspeak.com/2015/10/official-thingspeak-library/
10.The details of Internet of Things and applications used from IoT are taken from the website