EFFECT OF QUALITY OF ROAD INFRASTRUCTURE ON COUNTY ECONOMIC DEVELOPMENT IN KIAMBU COUNTY, KENYA
DAVID MUGO KIHARA C153/CTY/33245/2014
A RESEARCH PROJECT SUBMITTED TO THE SCHOOL OF HUMANITIES AND SOCIAL SCIENCES IN PARTIAL FULFILMENT OF THE REQUIREMENTS FOR
THE AWARD OF A MASTERS DEGREE IN PUBLIC POLICY AND ADMINISTRATION, KENYATTA UNIVERSITY
DECLARATION
I declare that this project is my original work and has not been previously published or submitted elsewhere for award of a degree. I also declare that this contains no material written or published by other people except where due reference is made and author duly acknowledged.
Student Name: David Mugo Kihara Reg. C153/CTY/33245/2014 Sign………. Date………. I do hereby confirm I have examined the master’s project of David Mugo Kihara.
Sign ……… Date ...
Dr. Wilson Muna Supervisor
DEDICATION
ACKNOWLEDGEMENT
I wish to express my gratitude to my supervisor Dr. Wilson Muna for his guidance, remarks and proper tracking during my master’s project, residents of Nyanduma ward for their well coordinated research and support that they gave me.
ABSTRACT
TABLE OF CONTENTS
DEDICATION... iii
ACKNOWLEDGEMENT ... iv
ABSTRACT ... v
LIST OF TABLES ... ix
LIST OF FIGURES ... x
LIST OF ACRONYMS ... xi
DEFINITION OF TERMS... xii
CHAPTER ONE ... 1
INTRODUCTION... 1
1.1 Background of the Study ... 1
1.1.1 Road Infrastructure ... 2
1.1.2 County Development in Kenya ... 3
1.2 Statement of the Problem ... 4
1.3 Objectives of the Study ... 5
1.4 Research Questions ... 6
1.5 Justification Significance of the Study ... 6
1.5.1 Justification of the Study ... 6
1.5.2 Significance of the Study ... 7
1.6 Scope of the Study... 7
1.7 Limitations of the Study ... 7
CHAPTER TWO ... 9
LITERATURE REVIEW ... 9
2.1 Introduction ... 9
2.2 Empirical Literature Review ... 9
2.3 Theoretical Review ... 15
2.3.1 Ecological Systems Theory... 15
2.3.2 Social Infrastructure Theory ... 16
2.3.3 Empowerment Theory ... 17
2.4 Conceptual Framework ... 19
2.5 Research Hypothesis ... 20
5RESEARCH METHODOLOGY ... 21
3.1 Introduction ... 21
3.2 Research Design ... 21
3.3 Study Variables ... 21
3.4 Site of the Study ... 22
3.5 Target Population ... 22
3.6 Data Collection Instruments ... 23
3.7 Data Collection Procedure ... 23
3.8 Validity and Reliability of the Study Instrument ... 24
3.9 Data Analysis Methods and Presentation ... 24
3.10 Ethical Considerations... 25
CHAPTER FOUR ... 26
DATA ANALYSIS AND PRESENTATION ... 26
4.1 Introduction ... 26
4.2 Response Rate ... 26
4.3 Demographic Information ... 27
4.3.1 Gender ... 27
4.3.2 Age Bracket in years ... 27
4.3.3 Level of Education ... 28
4.3.5 Position in the Sub-Location ... 28
4.4 State of Road Infrastructure ... 29
4.5 Financial Investment in Road Infrastructure ... 30
4.6 Road Maintenance ... 31
4.6 Regression Analysis ... 32
4.7 Discussion of the Results ... 33
SUMMARY, CONCLUSIONS AND RECOMMENDATIONS ... 36
5.1 Introduction ... 36
5.2 Summary of the Findings ... 36
5.3 Conclusion ... 38
5.5 Areas of Further Study ... 39
REFERENCES ... 40
APPENDIX I: LETTER OF INTRODUCTION ... 44
APPENDIX II: RESEARCH QUESTIONNAIRE ... 45
APPENDIX III: STUDY’S TIMELINE ... 49
LIST OF TABLES
Table 3. 1 Target Population………..22
Table 4. 1 Gender ... 26
Table 4. 2 Gender ... 27
Table 4. 3 Level of Education ... 28
Table 4. 4 Position in the Sub-Location... 29
Table 4. 6 State of Road Infrastructure ... 29
Table 4. 5 Financial Investment in Road Infrastructure ... 30
Table 4. 7 Challenges in the Development of Road Infrastructure ... 31
Table 4. 8 Model Summary ... 32
Table 4. 9 ANOVA ... 32
LIST OF FIGURES
LIST OF ACRONYMS CBD Central Business District
GDP Gross Domestic product
DEFINITION OF TERMS
Infrastructure: the large capital intensive natural monopolies such as highways, water and sewer lines, communication networks and other transport facilities. It further extends to include various physical structures used by a lot of industries as inputs in the production of goods and services
Development: Act of improving by expanding, enlarging or refining
County: a geographical region of a country used for administrative or other purposes. County Development: The act of improving by expanding, enlarging or refining a geographical
region of a country
Quality of roads: This represents roads that meet extensive and efficient levels of operation in the county. This is considered by regarding them as tarmacked.
Road Infrastructure; These are capital intensive investments in roads and highways for purposes of improving the transport of goods and services.
Status of road; This is the condition of determining whether a road meets the quality of roads criteria such that there is an extensive and efficient level of operation in the transport sector.
Financial investment; Investing money in road infrastructure so as to improve its quality, allowing for its extensive and efficient use.
1
CHAPTER ONE
INTRODUCTION 1.1 Background of the Study
There is no universally accepted definition of infrastructure, but a number of scholars have all attempted to define it in one way or another. Collier and Venables, (2016) defined infrastructure from an economic point of view to mean the large capital intensive natural monopolies such as highways, water and sewer lines, communication networks and other transport facilities. In any given modern economy, the management of energy, water, transport systems, digital communications, waste disposal networks and facilities cannot be ignored as they are essential parts of any competitive economy (Wagenvoort et al., 2010). It has been proved that well designed and developed infrastructure has long term benefits which in turn can translate to overall economic growth, productivity and increased value of the land which would further spillover into various aspects of the economy. Although infrastructure does not directly affect economic development, it remains an important part driving various parts of the economy. Investment in infrastructure, therefore, has to be a clearly thought of process, with pre-established objectives and a road map to ensure the investment is within its goal of driving the economic growth, thus avoiding yielding of minimum returns to the economy.
affects economic development directly, it is through the general contribution it possesses as an additional input in the production process in every aspect of the economy. Indirect impact is felt through raising the total factor of productivity by reducing the all the associated costs, hence efficient production.
It is evident that infrastructural development has a lot of positive impact on various levels such as output, productivity and the long term growth rates of any given economy. Sufficient investing in infrastructure has proved vital since it compliments other investments within the economy, while little attention to infrastructural investment acts as a hindrance to other investments (Bhattacharya, Romani and Stern, 2017). It is also important to establish that the investment on infrastructure must remain a controlled exercise since massive investment has no add value on the economy if other important sectors are left unattended.
1.1.1 Road Infrastructure
In Kenya, infrastructural development has been slow over a number of decades, but over the past few years’ efforts have ensured it picks up. The Kenya’s Vision 2030, especially under the economic pillar, the general development of infrastructure has been given a lot of emphasis due to its unquestionable role in ensuing there is massive economic growth. This has seen a number of projects start such as the development of standard gauge railway systems to complement the old meter gauge that has served the economy for decades, exp0ansion of the energy and communication sectors among other significant areas (Maparu and Mazumder, 2017).
Road construction in the whole country has been a major area of emphasis in the last ten years or so. Kiambu County has been one of the biggest beneficiaries of these road projects by the government with both the Northern and Southern Bypasses cutting right through the rich county. Beyond these two major roads, the county has been lucky to have other important roads built. The Githunguri-Ndumberi Road, the Thika Road Town Roads and the Githunguri CBD Roads also form part of these road networks that continue to flood the county. Evidently, the development of these projects has had a massive impact on the economy of the region in a number of ways. Therefore, it is under this background that this study is based and the objective is to look into the development of road infrastructure and how this has impacted development specifically on Kiambu County.
1.1.2 County Development in Kenya
economic development and in ensuring the resources are equitably distributed. According to articles 191 and 192 of the 2010 constitution and the county government act of 2012, these counties are described as single member constituencies that are vital in the election of members of the senate and women representatives to the national assembly of the country.
The basis of these counties can be further traced from the previously recognized 47 districts. The 2013 general elections were used as the perfect measure of their size and respective boundaries following massive re-organization of the entire administration system in the country. Therefore, counties fall under the new administrations system with the central government having in place county commissioners in every county to represent its interests. Some of the milestones associated with county development in Kenya so far include the ability to make both the central and county governments more responsible and accountable to the people. Counties also provided platforms where people could participate in decision making process where they have the chance to propose what they need. Counties brought governing closer to the people, encouraged social diversity in the country, decentralized power and ensured there is balance in economic development in the country.
1.2 Statement of the Problem
Several researchers have investigated how road transport I critical to development. Banerjee, Duflo and Qian, (2012) studied how access to transportation infrastructure impacted economic growth in China and asserted that good roads increase access to rural area mostly known to be rich in raw materials. Their results also pointed out that proximity to transportation networks have a moderate positive causal effect on per capita GDP levels across sectors. Based on this, the researcher intends to show whether the current state of road infrastructure in Kiambu county has a similar effect on growth of GDP. Additionally, as pointed out by Adero and Aligula, several challenges are faced in the transport sector in the east African community as a whole. According to them, this and sub-optimal mix of transport modes contribute substantially to a higher cost of doing business relative to other regional blocs. This not only affects the economy thereby slowing development. This call for an inquiry into the factor that affect the development of road transport o as to ascertain what can be done to change the situation. This study therefore intends to provide this solution in as far as Kiambu County is concerned.
A study on road infrastructure on economic competitiveness in Kenya by Njoro (2016) revealed that infrastructure has a great impact on the economic development of any given geographical area. In the study, it was revealed that infrastructure development has been identified by Kenya’s Vision 2030 as an important factor. This study was therefore poised to narrow the cope down to Kiambu County, thereby identifying the impact that could result by improving road infrastructure.
1.3 Objectives of the Study
i. To assess how the status of roads affect county economic development in Nyanduma Ward, Kiambu County, Kenya.
ii. To determine how financial investment in road infrastructure affects economic development in Nyanduma Ward, Kiambu County, Kenya.
iii. To investigate the extent of road maintenance in the county and how it affects the economic development of Nyanduma Ward, Kiambu County, Kenya.
1.4 Research Questions
The research questions were as follows;
i. To what extent has the current state of roads affected county economic development in Nyanduma Ward, Kiambu County, Kenya.?
ii. What is the effect of financial investment in road infrastructure on county economic development in Nyanduma Ward, Kiambu County, Kenya.?
iii. Does road maintenance have any correlation with economic development of Nyanduma Ward, Kiambu County, Kenya?
1.5 Justification Significance of the Study 1.5.1 Justification of the Study
the sector and identify the main challenges in the development of road infrastructure in the county. All these play a critical role in the economic development of the county as a whole. 1.5.2 Significance of the Study
Taking a look at these three factors therefore allows the researcher to create a connection between road infrastructure development and the improvement of the economic status of the area under investigation. The significance of this study therefore spreads far and wide up to a point where it is relevant to inform government policy and decision making especially around infrastructural development. This means highlighting the relationship between the development of road networks in the county, and the expected benefits and disadvantages affecting not just the people of the county, but also the entire country. Finally, the study was important for the public to understand the direct impact investing on infrastructure will have on their quality of life.
1.6 Scope of the Study
The study focused on the effect of road infrastructure on county development in Kiambu County. Specifically, the study focused on Nyanduma Ward, South East of Lari Constituency in Kiambu County. The researcher intends to collect information about the current state, financial structure, and challenge in challenges in the development of road infrastructure from the three main sub locations in the ward namely Gachoire, Nyanduma and Kagwe.
1.7 Limitations of the Study
academic purposes, and that the information required to be filled would not compromise them in any way.
CHAPTER TWO
LITERATURE REVIEW 2.1 Introduction
This chapter entailed the review of relevant and related literature based on the established study objectives. This chapter also outlined the empirical review, theoretical review, the conceptual frameworks and the gaps in research.
2.2 Empirical Literature Review
This section provided the empirical review conducted by the researcher. It reveals the studies that have been conducted to show the state of roads in Kenya, the financial structure in place to facilitate road structure and finally some of the challenges in challenges in the development of road infrastructure.
2.2.1 State of Road Infrastructure
to have a higher index of ease of doing business, meaning that more investments are made in these regions thus improving their economic status. Similarly, a study by Straub (2008) scrutinized the impact of infrastructure investment on East Asia's economic growth using a growth-accounting basis and cross-country regression. The results showed no significant impact of infrastructure on growth, contradicting the results of Seethepaili, Bramati, and Veredas (2008).
Calderon and Chong (2009) provided a comprehensive assessment of the impact of infrastructure development on economic growth in Africa by using physical indicators in the telecommunications, power, and transport sectors. Data for 136 countries for 1960-2005 were regressed by using non overlapping five-year period observations. To address econometric issues like unobserved country and time-specific effects as well as potential reverse causality, an instrumental variable technique was used. The study assessed the impact on per capita growth of faster accumulation of infrastructure stocks and of enhancement in the quality of infrastructure services. The findings presented that growth was positively affected by infrastructure stocks and the quality of infrastructure services.
2.2.2 Financial investment in road infrastructure
Just like any other form of infrastructure, road infrastructure is highly dependent on funding. As such, the financial structure of a country will dictate the quality as well as quantity of infrastructure adopted. Several studies have asserted this to be true. For instance, Shepherd and Wilson (2009) revealed that bilateral trade flows in Southeast Asia were caught up by transport infrastructure. Hoekman and Nicita (2008) on the other hand established that deprived roads and ports, below par performing customs agencies and procedures, weakness in regulatory capacity, and limited access to finance and business services affected trade.
Wilson, Mann, and Otsuki (2015), when extending the gravity model to trade enablement measures and to a larger sample of seventy-five countries, postulated that port efficiency and the delegations for infrastructure quality for the services sector, such as the use, speed, and cost of the interne, significantly affected trade flows. Limao and Venables (2011) also used a gravity model which included dummy variables representing possibilities of transit. Infrastructure was measured by variables including paved and unpaved roads, railways, and telephone lines. Infrastructure was established to be an important factor in determining transport costs, especially for landlocked countries. They estimated that differences in infrastructure accounted for 40% of transport costs for coastal countries and 60% for landlocked countries. This brings out roads as important means in accessing social amenities. A study by John (2014) suggest that road infrastructure investments lead to changes in generalized transport costs, through shorter distances or higher speeds, which give rise to reductions in fuel, capital, and labor costs. Such changes will have impacts in the transport system.
improved accessibility to social infrastructure like schools and health centers, increased opportunities to access education and health facilities and improved social interaction and mobility, which are important for social and economic development; improved access to markets by reducing transport costs; improvement of the marketability of perishable goods through timely and cheaper transport that will provide a direct incentive for more market-oriented agriculture, with more profitable cash crops, an increase in rural income and also additional employment opportunities.
A study Bryceson, (2016) investigated how effective road investment is in addressing mobility and social service accessibility in rural areas by using comparative data from Ethiopia, Zambia and Vietnam. It also investigated the question of whether roads can end geographical isolation and economic and social marginalization for poorer communities. The findings indicated that rural road investments have the potential to facilitate development and poverty alleviation, subjective to other key factors and basic preconditions that are linked to the realization of benefits. These include: the existing density of the rural road network, the level of social and economic infrastructure provisioning, the level of ownership and access of motorized transport in the rural population and the level of purchasing power of rural households to access public transport. The study indicated that when roads enhance mobility it occurs in association with motorized transport, thereby providing easier movement for communities. This could result in poverty alleviation when the savings in travel time and the travel distances covered provide more economic opportunities or improved access to social services.
2.2.3 Road Maintenance
are vital to any development agenda. Moreover, because of its intensive use of infrastructures, the transport sector is an important component of the economy and a common tool used for development. At the aggregate level, efficient transportation reduces costs in many economic sectors, while inefficient transportation increases these costs. In general, transport projects that improve overall accessibility. They improve businesses ability to provide goods and services, and people's ability to access education, employment and services) and reduce transportation costs including travel time, vehicle operating costs, road and parking facility costs.
In a study on maintaining sustainable urban transport, Pojani & Stead (2015) pointed out that policy makers have three main tools or instruments at their disposal. They can fund infrastructure investments such as building a new road or subway line; they can use price instruments such as taxes on gasoline or subsidies for public transit; or they can issue regulations such as fuel efficiency or safety standards. With these tools, policy makers can affect both the supply and demand for transport, which, in turn, lead to changes in the costs of transport services, accessibility and the magnitude of externalities. These changes stimulate economic responses in terms of trade, location choices or transport use and thus shape the ultimate development outcomes that policy makers seek.
network of roads of high quality is essential for trouble-free road transport, which is the most widely-used mode of transport in countries such as Slovakia (Masarova & Ivanova, 2013) The advantages of road transport include transporting passengers and carrying goods regardless of distance directly to a destination, the relatively high speed and no time restrictions. Road transport and its infrastructure enable to carry people as well as materials, raw materials, semi-finished and semi-finished products intended for sale. Road infrastructure affects the flexibility and mobility of the workforce, which is reflected in the employment level. Moreover, higher employment level makes the standard of living grow. The degree to which the road infrastructure is developed has an impact on several areas, such as for instance the development of tourism, influx of foreign investments, regional development (Mathew, 2014).
2.2.4 Road Maintenance
The challenges in the development of road infrastructure is perhaps the biggest challenge faced by developing countries in Africa, Kenya being one of them. These challenges are often related to a lack of support from government, dependency on external funding, political influence and corruption, lack of experience, lack of proper planning, fear of losing job, loss of competition, loss of control of the network, contractors’ performance and attitude as well as challenges in estimating the cost. Sultana, Rahman and Chowdhury, (2012) pointed out that road authorities always strive to reduce the maintenance costs of road infrastructure systems. According to them, contracting out road maintenance to the private sector based on performance measures is an alternative solution to maintain road infrastructure in a cost-effective way.
socioeconomic structure in developing countries. Another study on road infrastructure policies in Kenya revealed that existing policies are a stumbling block towards effective maintenance of roads in the country. They pointed out that development and maintenance of physical infrastructure are prerequisites for rapid economic growth and poverty reduction, as they influence production costs, employment creation, access to markets, and investment.
2.3 Theoretical Review
2.3.1 Ecological Systems Theory
Also known as the Human Ecology Theory and formulated by psychologist Urie Bronfenbrenner, the theory highlights that any human development is influenced by the different types of environmental systems. By doing so, the theory is responsible for making us comprehend why our behavior changes depending on the environment that we are in for instance when in front of family, at school or at work (Onwuegbuzie, Collins, and Frels, 2013).
According to the ecological systems theory, during the development process, there are five environments in which individuals interact and form relationships. These environmental systems include the micro, mesosystem, the exosystem, the micro system and finally the chronosystem.
i. The Micro System represents the direct environment we have in our lives which is basically a small circle of friends, family, classmates, teachers, neighbors and other relevant individuals with whom there is direct social contact. Therefore, the micro system regards us as key contributing factors to the construction of such environments rather than mere participants in the socialization process.
iii. The Exosystem ensures there is a link between an individual’s active participation and where they do not have an active role. for instance, the relationship between the child and the mother is so strong, but when the mother is away for some time the child might conflict with the father or develop a strong bond with him.
iv. The Macro system represents the actual culture of the person. This includes their socioeconomic status within society, their ethnicity, race and general environment in which they reside. For instance, one is motivated to work harder each day when they come from a poor family.
v. The Chronosystem involves all the transitions and shifts in one’s life such as the socio-historical contexts that shape a person’s direction. For example, divorce; it is a life transitions that not only affects the couples’ relationship, but also the behavior of the children. It is a negative impact at the beginning before it is stable and agreeable.
2.3.2 Social Infrastructure Theory
that are paramount to the development process such as equal political power and labor productivity distribution and a social coalition structure.
The availability of such social infrastructures is a key indicator of the strengths and weaknesses visible in that particular community, the resources that are of importance to the community and the general direction in which the community is likely to follow in pursuit of it objectives and development agenda. Therefore, the development of social infrastructure depends solemnly on the assessment of the factors that are most pertinent to the whole community (Frischmann, 2012). The theory also recognizes that, quality of these factors affects the degree to which members of the community connect and invest in the development process, and the general sense of ownership.
2.3.3 Empowerment Theory
The empowerment theory carries an underlying value to social change by affecting outcomes at the individual, organization and community levels. A theory of empowerment, therefore, must consider both the process and the outcomes associated with the processes. This means that whatever actions, structures or activities put in place must result in a certain level of empowerment to all those involved (Hepworth, Rooney, Rooney, and Strom-Gottfried, 2016). Every member must be considered as a separate entity and empowerment must be tailored so that outcomes respond to their needs. For example, the kind of empowerment that a single 16-year-old mother might require in order to develop themselves must be very different from the kind of empowerment needed by a recently widower middle-aged man.
population specific in order to result to desired outcomes. The course of action will only be deemed empowering if it allows the population gain control of the process, obtain the resources that are necessary for the development process and finally enable them critically understand the fundamental value of their social environment. Through this, people are destined to become independent in solving their problems and in making important decisions.
2.4 Conceptual Framework
Independent Variables Dependent Variables
Figure 2. 1 Conceptual Framework Current State of Road
Infrastructure • Tarmacked Roads • Condition of the existing
Rough roads • Access to towns
County Development
• Quality of Roads • Cost of Transport • Ease of doing business • Level of Poverty reduction • Social benefits accrued Financial Structure in place to
facilitate Road Infrastructure • Allocated funds
• Financial Management • Financial Accounting
Road Maintenance • Work in progress
• Future Plans to maintain the road
Intervening Variables • Government
2.5 Research Hypothesis
H01; The current state of roads does not have a significant effect on county development in
Nyanduma Ward, Kiambu County
H02; The financial investment in road infrastructure does not have a significant effect on
county development in Nyanduma Ward, Kiambu County
H03; Road maintenance does not have a significant effect on county development in Nyanduma
CHAPTER THREE
5RESEARCH METHODOLOGY 3.1 Introduction
This chapter outlined the methods that was used to collect the data necessary for the study. This encompassed the identification of study population and the determination of the sample size for the study. The chapter further outlined the design that the study intends to adopt, how the necessary data was collected and analyzed, and all the inference techniques needed.
3.2 Research Design
This section discussed the descriptive research design that was adopted by the study. The study intended to use this design because it made it possible for the researcher to collect information through both personal accounts and observations made by the respondents concerning the topic of study. Furthermore, it gave them the freedom they need to describe this topic from their own experiences rather than based on theory (Lambert, 2012).
3.3 Study Variables
3.4 Site of the Study
The study was carried out primarily in Kiambu County. Although the site was selected due to the concerns about the state of roads and general infrastructural development in the area, but since the arrival of the new government coupled with the New Kenya 2010 Constitution, development of road infrastructure has been one of its biggest focuses, and Kiambu County became one of the largest beneficiaries of this project.
Since Kiambu County is vast and the research cannot be undertaken in every corner of the County, the researcher purposely selected Kiambu-Nyanduma Ward as the main area of study. The area was selected due to the challenges in terms of development of road infrastructure that have been observed in the area. The Ward is served by the two main roads, i.e. the Northern Bypass and the Githunguri-Kimende Road. Other roads within the Ward include the Nakuru-Naivasha Road. In total the Ward has 7 kilometers of tarmac road.
3.5 Target Population
Table 3. 1 Target Population
SN Location Population of County Officials in Road Infrastructure Departments
1 Gachoire 26
2 Nyanduma 12
3 Kagwe 23
Total 61
Given that this number is small, the study intends to include all the individuals indicated above, which meant that this study was a census.
3.6 Data Collection Instruments
This study used questionnaires as the main data collected instrument. Rowley (2014) indicated that questionnaires are efficient tools of data collection when the study uses a descriptive research design. He also stated that they are also efficient because they give the researcher a larger scope under which to objective responses to research questions. They were designed a semi-structured with closed ended questions only to regulate the amount of demographic information respondents provide while at the same time maintaining their answers to the issues related to the topic of study. The questionnaire comprised of three sections; A, B and C Section A will be used to collect demographic information about the individuals while section B was used to collect information about road infrastructure. Finally, section C comprised of questions regarding county development in general.
3.7 Data Collection Procedure
were included in the study. The purpose of the study as well as the objectives were communicated to the respondents on time, prior to the process.
3.8 Validity and Reliability of the Study Instrument
Christensen, Johnson and Turner (2011) defined the validity of a research instrument as its ability to measure all the variables chosen for the study. This therefore is determined by the kind of questions included in the research questionnaire. They should be able to measure one element at a time, be clear and precise on the nature of their inquiry. This was done through appraisal and verification by the supervisor and other experts during proposal defence.
Reliability on the other hand was also described by Christensen, Johnson and Turner (2011) as the level of consistency indicated by the scale of a research instrument. Consistency means that in the event that the study is conducted again, say twice of three times, then the results obtained will be similar. As indicated by Cho and Kim, (2015), the best way to achieve reliability is to have a consistent scale measuring all the question included in the questionnaire. There are several scales that can be used including two point yes or no scale, three, four, five and seven point Likert Scales. In this case, the five point Likert scale that was adopted by this study so as to give the respondent a wider range of answers on which to provide their view about a statement or question. Once this has been achieved, the scale was verified using Cronbach’s alpha derived from SPSS (Version 22) to determine its suitability. A Cronbach’s alpha of 0.6 and above indicated that the scale is reliable (Cho and Kim, 2015).
3.9 Data Analysis Methods and Presentation
means, frequencies and percentages of the demographic information and answers given on the objectives by the respondents which were all presented in tables. A multiple regression equation was also fitted. The following model was used;
Y= β0 + β1X1 + β2X2 + β3X3 + β4X4 + ε
Where Y= County Development X1= State of Road Infrastructure
X2= Financial investment in road infrastructure
X3= Road Maintenance
β0 –Constant value
β1 - coefficient for Current State of Road Infrastructure
β2 - coefficient for Financial investment in road infrastructure
β3 - coefficient for Road Maintenance
ε- Error term
3.10 Ethical Considerations
CHAPTER FOUR
DATA ANALYSIS AND PRESENTATION 4.1 Introduction
This chapter presented the analysis, presentation and interpretation of the data collected from the questionnaires after it was analyzed with the help of SPSS version 24. Descriptive statistics such as frequency distribution and percentages were used to present the general information collected from the respondents. Further, regression analysis was conducted to explain the effect of quality of road infrastructure on county economic development in Kiambu county, Kenya. The findings are presented in form of tables and graphs.
4.2 Response Rate
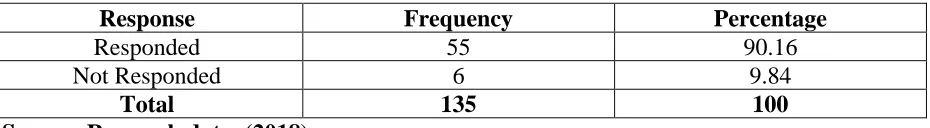
A total of 61 questionnaires were administered to respondents selected from sub-locations namely Gachoire, Nyanduma and Kagwe. However, only 55 of them were answered and returned for analysis. Table 4.1 provides a report that the study managed to receive 55 duly filled questionnaires out of 61 possible responses, which constituted a response rate of 90.16%. This response was deemed adequate and sufficient to make conclusions about the population selected by the study (De Vaus, 2013.
Table 4. 1 Gender
Response Frequency Percentage
Responded 55 90.16
Not Responded 6 9.84
Total 135 100
4.3 Demographic Information
In order to analyze the nature of respondents, the researcher asked the respondents to provide general information. This section has provided the results regarding gender, age bracket, highest level of education and the job position held in the sub-county’s office of roads and infrastructure. The results are provided as indicated below;
4.3.1 Gender
The study sought to identify the gender of the respondents that took part in the research. Table 4. 2 Gender
Gender Frequency Percent
Male 38 69.1
Female 17 30.9
Total 55 100.0
Source; Research data, (2018).
Table 4.2 provides that the study reported that 69.1% (38) of the respondents were female while 30.9% (17) were male. The significance of this is that responses obtained were from both male and female respondents.
4.3.2 Age Bracket in years
The respondents were also requested to indicate the age brackets they fitted into.
Age Bracket Frequency Percent
20-25 5 9.1
26-30 12 21.8
31-35 24 43.6
36-40 11 20.0
41 -50 3 5.5
Total 55 100.0
Their responses were obtained and analyzed as represented in table 4.3. The study found out that majority of the respondents was between the age of 31 and 35 years. This was represented by 43.6%. 20% of them were between 36-40 years, 21.8% were between 26-30 years, 5.5% were between 41-50 years while only 9.1% between 20-25 years. The implication of this is that majority of the respondents were above the required age and were, therefore, eligible to take part in a research.
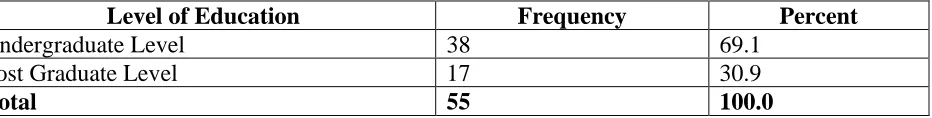
4.3.3 Level of Education
Additionally, the researcher wanted to identify the level of education possessed by each respondent that took part in the study.
Table 4. 3 Level of Education
Level of Education Frequency Percent
Undergraduate Level 38 69.1
Post Graduate Level 17 30.9
Total 55 100.0
Source; Research data, (2018).
Table 4.3 revealed that 30.9% of the respondents had attained post-graduate level while 69.1% had attained undergraduate level of education. The significance of this is that the respondents included in the study were knowledgeable enough to understand the questions being posed to them in the questionnaire.
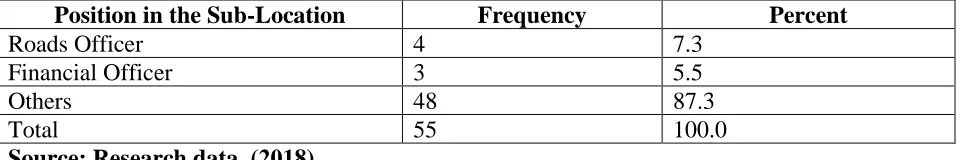
4.3.5 Position in the Sub-Location
Table 4. 4 Position in the Sub-Location
Position in the Sub-Location Frequency Percent
Roads Officer 4 7.3
Financial Officer 3 5.5
Others 48 87.3
Total 55 100.0
Source; Research data, (2018).
Table 4.4 reveals that majority of the respondents were officers meant to observe and help out on various assignments as assigned to them by their respective road officers. Thy made up the largest section as represented by 87.3%. The road officers were represented by 7.3% while only 3 financial officers are employed in the three sub-locations. From the analysis above, it was revealed that all the respondents included in the study interacted with the road infrastructure department in their respective locations and therefore had the knowledge necessary to answer the questions presented to them in the questionnaires. This allowed the researcher to collect relevant information related to the topic of study.
4.4 State of Road Infrastructure
The study also wanted to find out the state of road infrastructure in the three sub locations identified from the county. Table 4.6 indicates the results
Table 4. 5 State of Road Infrastructure
Statement Mean SD
Most major roads have been tarmacked 2.69 1.303
Feeder roads have been maintained and are passable 1.80 1.129 A significant number of feeder roads are lined up for tarmacking 3.00 1.319 There are policies in place to expand road network coverage in the ward 2.69 1.373 The county government works in conjunction with KENHA to ensure rules are
regulations are followed
1.78 1.066 There is a patrol unit that mans the roads to ensure they are used well 1.82 1.056
Average 2.29
On average, the study found that most major roads have been tarmacked (M=2.69, SD= 1.303), feeder roads have been maintained and are passable (M=1.80, SD=1.129, a significant number of feeder roads are lined up for tarmacking (M=3.00, SD= 1.319), there are policies in place to expand road network coverage in the ward (SD=2.69, SD=1.373), that the county government works in conjunction with KENHA to ensure rules are regulations are followed (M=1.78m SD=1.066) and that there is a patrol unit that mans the roads to ensure they are used well (M=1.82, SD=1.056). An average mean of 2.29 implied that most of the respondents agreed that the state of road infrastructure has a role in the economic development of the county.
4.5 Financial Investment in Road Infrastructure
The study sought to find out the nature of financial investment received by each sub-location selected from Kiambu County. Table 4.5 indicates the results.
Table 4. 6 Financial Investment in Road Infrastructure
Statement Mean SD
The sub-county receives enough funds for roads 3.93 .940 All major roads have been scheduled for tarmacking 2.65 1.377 Poor policies have affected financial cash flow 3.05 1.339 Corrupt and irresponsible leaders hamper the financial process 2.64 1.296 There is a poor financial structure that needs to be changed all together 3.93 .940 There is an enormous roads repair backlog that delays any further investment 2.33 1.320
Average Mean 3.08
Source; Research data, (2018).
meant that the respondents are neutral on whether financial investment in road infrastructure influences the county’s economic development.
4.6 Road Maintenance
Finally, the study sought to find out the challenges of road infrastructure. Table 4.7 indicates the results obtained from the respondents.
Table 4. 7 Challenges in the Development of Road Infrastructure
Statement Mean SD
Huge cost of road building 3.24 1.232
Insufficient equipment for road repairs 2.85 1.311
Poor implementation of axle weight guidelines and rules 2.75 1.336
An enormous Roads rehabilitation backlog 2.33 1.233
Lack of particular standards and capability for decentralized county roads 2.20 1.282
Little regulation and contractual ability 2.04 1.305
Infringement on road reserves 1.93 1.016
Heavy traffic jams and overpopulation in urban areas 1.80 .951 Insufficient research on other affordable materials for building road 1.73 .990 Average Mean
Source; Research data, (2018).
4.6 Regression Analysis
The study conducted a multiple regression analysis to determine the relationship between the independent and the dependent variables. This would establish the effect of quality of road infrastructure on county economic development in Kiambu county, Kenya. Table 4.8 indicated an R-Square 0.361 of indicating that 36.1% of the independent variables explained the dependent variable.
Table 4. 8 Model Summary
Model Summary
Model R R Square Adjusted R Square Std. Error of the Estimate
1 .601a .361 .324 .43873
a. Predictors: (Constant), Road Maintenance, Status of Road Infrastructure , Financial Investment
Source; Research data, (2018).
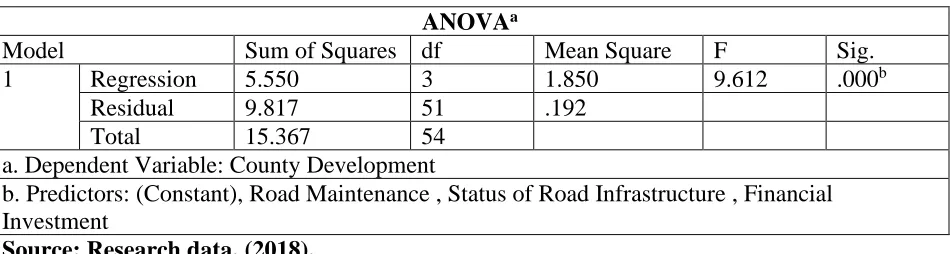
ANOVA table 4.9 reported a significant F statistic value of 9.612, p=0.000 implying that the regression line adopted by the study was the line of best fit.
Table 4. 9 ANOVA
ANOVAa
Model Sum of Squares df Mean Square F Sig.
1 Regression 5.550 3 1.850 9.612 .000b
Residual 9.817 51 .192
Total 15.367 54
a. Dependent Variable: County Development
b. Predictors: (Constant), Road Maintenance , Status of Road Infrastructure , Financial Investment
Source; Research data, (2018).
Table 4. 10 Coefficients
Coefficientsa
Model Unstandardized
Coefficients
Standardized Coefficients
t Sig.
B Std. Error Beta
1 (Constant) 1.018 .334 3.049 .004
Status of Road Infrastructure
.229 .084 .381 2.731 .009
Financial Investment .219 .104 .293 2.097 .041
Road Maintenance .387 .080 .543 4.824 .000
a. Dependent Variable: County Development Source; Research data, (2018).
The regression line was as follows;
Y=1.018 + 0.219 X1 - 0.229 X2 + 0.387 X3
Where X1= State of Road Infrastructure
X2= Financial investment in road infrastructure
X3= Road Maintenance in the development of road infrastructure
4.7 Discussion of the Results
SD= 1.339), corrupt and irresponsible leaders hamper the financial process (M=2.64, SD=1.296), there is a poor financial structure that needs to be changed all together (M=3.93, SD=0.940), and that there is an enormous roads repair backlog that delays any further investment (M=2.33, SD= 1.320).
This result also means that the respondents agreed that most major roads have been tarmacked (M=2.69, SD= 1.303), feeder roads have been maintained and are passable (M=1.80, SD=1.129, a significant number of feeder roads are lined up for tarmacking (M=3.00, SD= 1.319), there are policies in place to expand road network coverage in the ward (SD=2.69, SD=1.373), that the county government works in conjunction with KENHA to ensure rules are regulations are followed (M=1.78m SD=1.066) and that there is a patrol unit that mans the roads to ensure they are used well (M=1.82, SD=1.056).
Finally, the respondents identified the biggest challenge to be a lack of particular standards and capability for decentralized county roads (M=3.24, SD= 1.232), followed by little regulation and contractual ability (M=2.85, SD=1.311), then poor implementation of axle weight guidelines and rules (M=2.75, SD=1.336). They also pointed out that there was insufficient equipment for road repairs (M=2.33, SD= 1.233), insufficient research on other affordable materials for building road (M= 2.20, SD= 1.282), that there was a huge cost of road building (M=2.04, SD=1.305) and that there was infringement on road reserves (M=1.93, SD= 1.016), heavy traffic jams and overpopulation in urban areas (M=1.80, SD= 0.951) and finally, that here was an enormous Roads rehabilitation backlog (M=1.73, SD= 0.990).
CHAPTER FIVE
SUMMARY, CONCLUSIONS AND RECOMMENDATIONS 5.1 Introduction
This chapter presents the summary of the study, conclusions, recommendations, limitations of the study and suggestions for further study.
5.2 Summary of the Findings
This study sought out to find out the effects of quality of road infrastructure on county development of Nyanduma Ward, Kiambu County. Specifically, the study investigated how the status of roads affect county economic development in Nyanduma Ward, Kiambu County, Kenya, determined determine how financial investment in road infrastructure affects economic development in Nyanduma Ward, Kiambu County, Kenya and wanted to find out how the main challenges in the development of road infrastructure affect county economic development in Nyanduma Ward, Kiambu County, Kenya.
turn can translate to overall economic growth, productivity and increased value of the land (Wagenvoort et al., 2010).
Therefore, this study identified three sub-locations namely Gachoire, Nyanduma and Kagwe in Nyanduma ward, Kiambu County and investigated how Financial Investment in Road Infrastructure, State of Road Infrastructure and Road Maintenance in the maintenance of Road Infrastructure affected its development. Results indicated that there is a poor financial structure that needs to be changed all together, that not all major roads have been scheduled for tarmacking, that poor policies have affected financial cash flow and that corrupt and irresponsible leaders hamper the financial process. It was also revealed that there is a poor financial structure that needs to be changed, and that there is an enormous roads repair backlog that delays any further investment.
On the other hand, the study found that most major roads have been tarmacked, that feeder roads have been maintained and are passable and that a significant number of feeder roads are lined up for tarmacking. It was also established that there are policies in place to expand road network coverage in the ward, that the county government works in conjunction with KENHA to ensure rules are regulations are followed and that there is a patrol unit that mans the roads to ensure they are used well.
was infringement on road reserves. Furthermore, heavy traffic jams and overpopulation in urban areas as well as an enormous roads rehabilitation backlog were some other challenges identified. These results are comparable to those identified by Duflo and Qian, (2012) and Njoro (2016). 5.3 Conclusion
Based on the study findings, therefore, the study concludes that financial investment in road infrastructure influences the county’s economic development. This is also true for the effect of state of road infrastructure and challenges faced in the economic development of the county. From the coefficients, challenges of road infrastructure have the greatest impact on road infrastructure (0.387 per unit increase), followed by the status of roads (0.229 per unit increase) and lastly financial investment (0.219 per unit increase). Additionally, student t statistics tests also revealed that the effect caused by these three variables was statistically significant. Specifically, the t statistic for Road Maintenance is t=4.824, p=0.000<0.005, while that for state of roads and financial investment is t=2.731, p=0.009 <0.005 and t=2.097, p=0.041 <0.005.
5.4 Recommendations of the Study
exercise since massive investment has no add value on the economy if other important sectors are left unattended.
It is also true that infrastructural development has been slow over a number of decades in Kenya. However, there have been signs of change over the past few years as the country gears up towards vision 2030. This study therefore recommends more effort to be made towards improving the roads since the general development of infrastructure has an unquestionable role in ensuing there is massive economic growth (Maparu and Mazumder, 2017).
Therefore, based on the first objective, this study recommends the county government of Kiambu to address the status of roads and ensuring that they are in good shape as this has a direct impact on its development status. As far as the second objective is concerned, this study recommends the development of a better financial structure in the county that will foresee all financial investments made towards the development of road infrastructure in Nyanduma Ward, Kiambu County, Kenya. Finally, the study also recommends the county government of Kiambu to allocate a significant amount of resources towards the maintenance of roads in the county as this will have a positive impact its economic development.
5.5 Areas of Further Study
REFERENCES
Agénor, P. R., & Moreno-Dodson, B. (2006). Public infrastructure and growth: New channels and policy implications. The World Bank.
Aggarwal, S. (2013). Do rural roads create pathways out of poverty? Evidence from India.
Journal of Development Economics, 133, 375-395.
Behar, A., & Venables, A. J. (2011). Transport costs and international trade. Handbook of transport economics, 97-115.
Bell, C. (2012). The benefits of India's rural roads program in the spheres of goods, education and health: joint estimation and decomposition. The World Bank.
Benítez-López, A., Alkemade, R., & Verweij, P. A. (2010). The impacts of roads and other infrastructure on mammal and bird populations: a meta-analysis. Biological conservation, 143(6), 1307-1316.
Cascetta, E., Carteni, A., Pagliara, F., & Montanino, M. (2015). A new look at planning and designing transportation systems: A decision-making model based on cognitive rationality, stakeholder engagement and quantitative methods. Transport policy, 38, 27-39.
Frischmann, B. M. (2012). Infrastructure: The social value of shared resources. Oxford University Press.
Gawande, K., Hoekman, B., & Cui, Y. (2011). Determinants of trade policy responses to the 2008 financial crisis. The World Bank.
Giang, D. T., & Pheng, L. S. (2011). Role of construction in economic development: Review of key concepts in the past 40 years. Habitat international, 35(1), 118-125.
Gwilliam, K. (2011). Africa's transport infrastructure: Mainstreaming maintenance and management. The World Bank.
Haggblade, S., Hazell, P., & Reardon, T. (2010). The rural non-farm economy: Prospects for growth and poverty reduction. World development, 38(10), 1429-1441.
Hepworth, D. H., Rooney, R. H., Rooney, G. D., & Strom-Gottfried, K. (2016). Empowerment series: Direct social work practice: Theory and skills. Nelson Education.
Ismail, N. W., & Mahyideen, J. M. (2015). The Impact of infrastructure on trade and economic growth in selected economies in Asia.
Jerome, A. (2011). Infrastructure, economic growth and poverty reduction in Africa. Journal of infrastructure development, 3(2), 127-151.
Mwansa, S. (2010). Copperbelt Feeder Roads Project: A Case Study of Mpongwe. Jesuit Centre for Theological Reflection (JCTR).
Onwuegbuzie, A. J., Collins, K. M., & Frels, R. K. (2013). Foreword: Using Bronfenbrenner’s ecological systems theory to frame quantitative, qualitative, and mixed research.
Peterson, N. A. (2014). Empowerment theory: Clarifying the nature of higher-order multidimensional constructs. American journal of community psychology, 53(1-2), 96-108.
Portugal-Perez, A., & Wilson, J. S. (2012). Export performance and trade facilitation reform: Hard and soft infrastructure. World development, 40(7), 1295-1307.
Saslavsky, D., & Shepherd, B. (2014). Facilitating international production networks: The role of trade logistics. The Journal of International Trade & Economic Development, 23(7), 979-999.
Schweikert, A., & Chinowsky, P. (2013). Re-Defining “Project Impact”: Incorporating Social Considerations into the Rural Road Prioritization Process. In Engineering Project Organization Conference 2013.
Starkey, P. (2007). Rural transport services in Africa: Lessons from rapid appraisal surveys in Burkina Faso, Cameroon, Tanzania and Zambia. Sub-Saharan Africa Transport Policy Program, SSATP Working Paper, (87-B).
Starkey, Paul, and Africa Region. Rural transport services in Africa. Working Paper, Sub-Saharan Africa Transport Policy Program (SSATP), 2007.
Straub, S. (2008). Infrastructure and growth in developing countries: recent advances and research challenges. The World Bank.
Straub, S., & Terada-Hagiwara, A. (2010). Infrastructure and growth in developing Asia.
APPENDIXES
APPENDIX I: LETTER OF INTRODUCTION Dear respondent,
My name is David Mugo Kihara, a student at Kenyatta University, carrying out a study on the effect of quality of road infrastructure on county economic development in Kiambu county, Kenya. This is a partial fulfillment of the Requirement for the Award of a degree in Master’s in public policy and administration.
The attached questionnaire contains three sections, ‘A’, ‘B’ and ‘C’. Section A will be used to collect demographic information about the individuals while section B will be used to collect information about road infrastructure. Finally, section C will comprise of questions regarding county development in general.
Your responses will be treated with the utmost confidentiality and used for research purpose only. All questionnaires are to be collected within (2) weeks of receipt thereof.
Regards
APPENDIX II: RESEARCH QUESTIONNAIRE SECTION A: DEMOGRAPHIC INFORMATION
Please tick as appropriate in the boxes using a tick (√) or cross mark (x).
1. Gender
Male [ ] Female [ ]
2. Age Bracket in years
20-25 [ ] 26-30 [ ] 31-35 [ ] 36-40 [ ]
41 -50 [ ] 51 and Above [ ] 3. Highest level of education
a) Undergraduate Level [ ] b) Post Graduate Level [ ]
c) College [ ]
d) Any other (Specify) ………...
4. What is your position in the sub-location
a) Roads Officer [ ]
b) Financial Officer [ ]
SECTION B: ROAD INFRASTRUCTURE
Respond to these questions based on a scale of 1-5 where 1-Strongly Agree, 2-Agree, 3-Neutral, 4-Disgree, 5-Strongly Disagree
1. Financial Investment in Road Infrastructure
Statement 1 2 3 4 5
1 The sub-county receives enough funds for roads 2 All major roads have been scheduled for tarmacking 3 Poor policies have affected financial cash flow
4 Corrupt and irresponsible leaders hamper the financial process
5 There is a poor financial structure that needs to be changed all together 6 There is an enormous roads repair backlog that delays any further
investment
In this section, you will be presented with questions on the current State of Road Infrastructure. Respond on your own words
7. According to your understanding, what is the current state of roads affected county economic development in Nyanduma Ward, Kiambu County, Kenya?
……… ……… ……… State of Road Infrastructure
Statement 1 2 3 4 5
8 Most major roads have been tarmacked
9 Feeder roads have been maintained and are passable
10 A significant number of feeder roads are lined up for tarmacking
11 There are policies in place to expand road network coverage in the ward 12 The county government works in conjunction with KENHA to ensure
rules are regulations are followed
In this section, you will be presented with questions on how the Financial Structure in place to facilitate Road Infrastructure. Respond on your own words
13. Do you foresee any increase in economic performance of the ward if there is a significant increase in the finances allocated to road infrastructure? Please explain your answer. ……… ……… ………
In this section, you will be presented with questions on maintenance of Road Infrastructure. Respond on your own words
14. What is the effect of financial investment in road infrastructure on county economic development in Nyanduma Ward, Kiambu County, Kenya?
……… ……… ………
15. How do challenges in the development of road infrastructure affect county economic development in Nyanduma Ward, Kiambu County, Kenya?
……… ……… ………
Statements 1 2 3 4 5
16 Huge cost of road building
17 Insufficient equipment for road repairs
19 An enormous Roads rehabilitation backlog
20 Lack of particular standards and capability for decentralized county roads 21 Little regulation and contractual ability
22 Infringement on road reserves
23 Heavy traffic jams and overpopulation in urban areas
24 Insufficient research on other affordable materials for building road
SECTION C: COUNTY DEVELOPMENT The following are statements about county development in Kiambu.
Respond to these questions based on a scale of 1-5 where 1-Strongly Agree, 2-Agree, 3-Neutral, 4-Disgree, 5-Strongly Disagree
1-Strongly Agree, 2-Agree, 3-Neutral, 4-Disgree, 5-Strongly Disagree
Statement 1 2 3 4 5
25 Roads have contributed to growth of industries
26 Good roads have helped in increasing the demand and supply of goods in the market
27 Prices have remained stabilized because of easy transportation 28 Consumers enjoy the benefits of goods not produced locally. 29 Good roads have enabled the identification of market competition 30 Good roads have led to increase in mobility of labor and capital 31 Road network has provided better and faster access to customers.
32 Good road network has ensured even flow of commodities into the hands of the consumers throughout the period of consumption.
33 Good roads bridge the gap between production and consumption centers. 34 Good roads have controlled traffic jam thus enhancing education and other
economic activities to be fast.
APPENDIX III: STUDY’S TIMELINE
S/No ACTIVITY PERIOD
1 Writing and submission of Concept note January – April 2018 2 Proposal writing and presentation April – Novermber 2018
3 Proposal defense December 2018
4 Corrections after defense December 2019
5 Submission of corrected proposal to graduate school Data analysis
January 2019
6 Application for research permit January 2019
7 Data collection January-March 2019
8 Data analysis March-April 2019
APPENDIX 6: THE BUDGET FOR THE STUDY
S/No Item Description Rates Quantity Total
Amount 1 Internet connection Data 2,500 16 months 40,000
2 Transport Allowances 1,200 15 Days 12,000
3 Photocopying papers Reams 500 12 Reams 6,000
4 Printing Pages 10 1000 Pages 10,000
5 Meals Meals 1000 15 Days 15,000
6 Research assistants 5 days 2,000 2 20,000