Available online: https://edupediapublications.org/journals/index.php/IJR/ P a g e | 339
Analysis and Design of Composite Flyover Bridge
G.Narender1, C.Manikanta Reddy2, M.Shiva koti Reddy3, 1
(Project guide, Assistant Professor, Anurag Engineering College)
2
(HOD, Assistant Professor, Anurag Engineering College)
3
(Structural Engineering, Anurag Engineering College)
ABSTRACT
Project deals with the Design of a grade separator in an intersection. The location is at four roads junction at LB Nagar, which is facing major traffic problems due to the construction. We have done a traffic survey and designed all the structural parts for this grade separator.
The grade separator is of 640 m length with 21 spans, 20m per span. It consists of a deck slab, longitudinal girders, cross girders, deck beam, pier and foundation. Structural design of one span was made for all the above components.
Slab is designed by working stress method as per the recommendation of IRC: 21-2000, Clause 304.2.1. Cantilever slab is designed for maximum moment due to cantilever action. Longitudinal girders are designed by Courbon’s method. Cross girders are designed mainly for stiffness to longitudinal girders. Elastomeric reinforced bearing plate is used.
The deck beam is designed as a cantilever on a pier. The Pier is designed for the axial dead load and live load from the slab, girders, deck beam. Foundation designed as footing for the safe load bearing in the soil. All the elements are designed by using M25 grade concrete and Fe415grade steel. Designs are based on Working stress and Limit state method as per IRC: 21-2000 and IS: 456-2000.
INTRODUCTION OBJECTIVE
The project area is having very high density of traffic flow. The public felt inconvenient to cross the busy LB nagar to Dilsukunagar highways &therefore the flyover is essentially required at the junction. For easy traffic flow of agricultural goods and industrial goods without traffic congestion flyover or over bridges is essential to overcome the traffic congestion required.
Project deals with the Design of a grade separator in an intersection. The location is at four roads junction at LB Nagar town, which is facing major traffic problems due to the construction. I have done a traffic survey and designed all the structural parts for this grade separator. All the
drawings are drafted by Auto- CAD 2013 and analysis by STAAD pro vis8.
INTRODUCTION
A. Present trend of development:
Our nation being primarily an agricultural country. 90% of population is depending upon it and 10% of population depending upon industrial activities. For conveying the product materials such as food grains, industrial goods the roads are essential.
The roads and bridges are very important for growth of economy of the country. Now our country is being developed by developing roads and bridges.
Types of roads and bridges:
In our country there are so many types of roads are being constructed
1) Cart roads
2) Minor district roads 3) Major district roads 4) Sate highway roads 5) National highways roads
Accordingly the culverts bridges, flyover, are being constructed as mentioned below, For small cart road and minor district roads, small culverts bridges, small flyover are constructed with minimum class A load. For major district road, state highway road, national highway roads, major bridges and flyovers are being constructed for easy flow traffic. The flyover or over bridges are to be designed Class A loading and AA loading.
Necessity of flyover or over bridges:
For easy traffic flow of agricultural goods and industrial goods without traffic congestion flyover or over bridges is essentially to overcome the traffic congestion required.
B. Traffic census:
For designing any bridges or flyover the traffic census is essential to ascertain the traffic census to observe the vehicles census.
Selection of site:
The following points are the guiding factors for selection of suitable site,
Available online: https://edupediapublications.org/journals/index.php/IJR/ P a g e | 340
2) The site should have more traffic congestion. 3) The availability of men and materials are to be ascertained
Selection of types of flyover:
We have to select types of flyover according to traffic censes
Land acquisition:
If the highways or government promote land are not available at site the private land to be acquired for construction of our bridges.
Benefit cost ratio:
The annual cost of above ratio is calculated by taking 10% of interest at 1% of depreciation on the incurred expenditure of the project and administrative expenses of the project. Now the ratio between the cost networks overcomes of indirect income such that road tax is to be calculated for reasonable periods. For any project these ratio should be 1:1
Estimate:
The cost of the project includes expenditure on various items from planning to the yearly maintenance up to the end of useful life of the project. Generally they are,
1) Cost of preliminary survey 2) Cost of acquisition of land 3) Cost of various structure 4) Maintenance cost 5) Operation cost
6) Cost of tools and plants
7) Cost of establishment of construction.
Location:
Construction of a flyover across LB nagar road in town. The length of flyover 40m and approach length is 600m. The total length of flyover is 640m and width of 17m.
C. The component of the project:
This project is consist of main deck slab, deck beam, piers, girders, foundation, handrails, wings of slope is 1 in 30. Soil available is clay mixed with gravel. The bearing capacity of soil is 245kN/m². The width of road is 17m, length of deck is 40m c/c of pier is 20m, cross beam as also being placed at 4m c/c. The diameter of pier is 1.2m.
D. Traffic Survey
Traffic survey was made on 06.01.2015 in the project site from 6.00 pm to7.00 pm. This time was selected on the basic of the past traffic study as an average of peak hour. All the four arms of the site were observed and the number of vehicles passed was converted to PCU’s (Passenger car unit).
Traffic Projection:
The passenger car unit of a vehicle type has been found to be depends up on the size, and speed of the vehicle type and environment. They are not dependent on the flow and road width. As per IRC:
92-2000, the traffic volume limit is
10000PCUs/hour. The capacity of junction was estimated at 6547 PCS’s / hour. The design period is taken as 30 years. One year would be taken for the construction. So traffic is projection. So traffic is projected for 32 years, and then the design is made and it was 11068.
E. Traffic Scenario at LB Nagar Junction
Center (LB Nagar Junction) intersection on NH is one of the critical locations that carry a high volume of traffic. The speed survey conducted on this stretch of the highway also indicated a peak hour average speed of 19kmph. The study has mandated a flyover to be built at this junction (by 2015. Location and proposed orientation of flyover is presented in Figure 1.
From the traffic analysis carried out, it can be seen that a flyover is mandated at this location in 2015.
Table 1-1: Projected Traffic at LB Nagar Junction
Figure 1-1: Projected Traffic at LB Nagar Junction
ENGINEERING SURVEYS & INVESTIGATIONS
A. General
Various engineering surveys have been carried out for the proper planning and design of the grade separator at the proposed junction. Following surveys have been carried out:
• Topographical survey
• Trial pit/subsoil investigations
• Geotechnical investigations for foundations • Material survey
B. Topographical Surveys
Available online: https://edupediapublications.org/journals/index.php/IJR/ P a g e | 341
develop a Digital Terrain Model (DTM), to take care of design requirements of grade separated facility, identifying areas of restriction and their remedies. The data collected will result in the final design and is also used for the computation of earthwork and other quantities required.
As first step of the field study, satellite imagery maps of the location were collected and examined thoroughly to have firsthand information about the area and to decide on the possible improvement options. It also helped out in finalizing the extent of topographical survey.
1. Detailed Survey of Topographical Features
Topographical survey using total station has been carried out to collect sufficient data to form the digital terrain model and to prepare the map of the physical features of the area. Following existing features have been captured during the survey:
• Building lines, type of buildings (shops or houses, number of stories), trees and Right of Way boundary if available at site by presence of boundary stones.
• Road edges, centerline, shoulders/footpaths, median etc
• Identifying all religious places, its locations, boundary lines and clear dimensions of compound walls and entrances.
• All service lines both above and below ground such as OFC cables, water and sewer pipes, gas pipes, electrical poles and cables, telephone poles and lines etc.
• Location of traffic islands, median, rotaries, dividers etc.
• Location of road side drains, clearly identifying the type (open/close), width of drain, including the beginning and end of drains.
• Positions of transformers, mast, towers etc
• Apart from the above, the names of intersecting roads and other landmarks are also recorded and incorporated in the drawing.
Topographic survey was carried out using Total Station of 5-sec accuracy for detailed mapping and with higher accuracy total station during the traversing (min 3 sec). As part of the survey, the following activities were carried out (i) Installation of Bench Mark Pillars: As first step of the survey, Bench mark pillars were installed as described below:
Bench mark pillars were constructed at every 250m interval. The pillars are in the form of concrete blocks of size 15 X 15 X 45 cm with a nail fixed at the center of the top surface were
embedded up to a depth of 30cm in to the ground. The BM pillars were painted in yellow and details such as BM number and reduced level were clearly
marked. Logical numbering sequence was
followed.
(ii) Cross – Sections: Cross sections along the road have been taken at every 10 m interval in longitudinal direction for a minimum width of 15m or up to the building lines from the centerline of the existing carriageway on either side of the road. Cross section levels were taken at
• Centerline of existing carriageway and median edges
• Points between centerline and edge of carriageway
• Shoulder/Footpath edges/carriageway edges • Additional points at locations of change in ground/critical points
(iii) Longitudinal Section: Longitudinal section levels along the centerline were taken at every 10m interval. Where curves or important features were encountered, this interval was suitably reduced. Cross sections points for the required width was taken corresponding to each point in the longitudinal section.
(iv)Map Plotting: The existing features surveyed were directly imported into Computer Aided Software and the details of the same has been plotted and presented for ready reference.
A. Trial Pit/ Subsoil Investigations For Pavement Design
Available online: https://edupediapublications.org/journals/index.php/IJR/ P a g e | 342
properties of the sub-grade, base and sub-base layers of the existing road including thickness of different layers of pavement.
• Grain Size Analysis • Atterberg Limits • Modified Proctor • CBR Values
• Field Density and Moisture Content
IMPROVEMENT PROPOSALS AND DESIGN STANDARDS
A. General
The junction caters for highly congested and crammed traffic throughout the day especially during peak hours. Based on the results of the surveys and investigations described in chapter 2 and 3 an arrangement best suiting to the traffic pattern is proposed for improving the situation. Proposal is evolved giving due consideration to minimize land acquisition. All the site constraints have been taken care while formulating the improvement scheme. The main objective is to improve the present state of affairs immensely and make the movement of traffic manageable to the possible extend, though a fully conflict free situation cannot be realized.
B. Geometric and Structural Design Standards
Geometry of NH 65 has a mild curve in this stretch and hence the elevated structure also follows a geometry having mild curve. As this project road falls within urban limits, relevant IRC design standards with due consideration to the latest directive and guidelines of MOSRTH/IRC were followed, as far as possible, while formulating the design standards. Other National and International standards were also referred to wherever found
relevant. Standards for the various components are briefed below.
1. Geometric Standards
IRC: 86 – 1983, “Geometric Design Standards for Urban Roads in Plains”.
IRC: 92-1985, “Guidelines for the design of interchanges in urban areas”
Design Speed: The ruling design speed of 100Kmph is adopted for the flyover and at grade roads. Carriageway Width based on the traffic requirement as per projections, four lane Configuration is proposed for the flyover and two lane widths is proposed for the service roads. Foot cum drain of 2m is proposed. Camber of 2.5% is proposed for carriageway of flyover as well as service roads. Super Elevation A maximum super elevation of 5.6% is adopted.
Horizontal Geometry, a design speed of 100kmph is proposed for the flyover and at grade roads. The minimum horizontal curve radius proposed is 800m. The radius beyond which super elevation is not required is 1800m.Vertical alignment is designed based on the provision of IRC SP: 23. Design of vertical geometry has two components, viz. design of gradients, and design of Vertical curves were designed using a minimum “K-value” of 74 for crest and 42 for sag for speed 100 kmph. A gradient of 3% is proposed at the location of obligatory spans. Care was taken to limit the start and end gradients of the vertical curves within the ruling gradient.
2. Road Signage and Markings
Proper signage and markings are vital for safety and guidance of the drivers. Junction improvement drawings shall show warning and regulatory signs at appropriate locations. The signs are of reflector type to be noted easily at night. All road signs are in conformity with the provisions of IRC 67 – 2001- Code of Practice for Road Signs and IRC SP 31 – 1992 - New Traffic Signs. Roadside lighting is provided for the flyover as well as service roads. Lamp poles are fixed at the edges of flyover. The road markings are in conformity with IRC 35 – 1997 Code of Practice for Road Markings with Paint and other IRC Standards.
C. Structural Design Standards
Available online: https://edupediapublications.org/journals/index.php/IJR/ P a g e | 343
the provisions of IRC/IS codes are found inadequate.
Following IRC/IS Codes are followed in the design IRC: 5 -1998 Standard Specifications & code of Practice for Road Bridges
Section -I. General Features of Design
IRC: 6-2000 Standard Specifications & code of Practice for Road Bridges,
Section -II. Loads and Stresses
IRC: 18-2000 Design Criteria for Pre-stressed Concrete Road Bridges (Post-
Tensioned Concrete) (Third Revision)
IRC: 21-2000 Standard Specifications & code of Practice for Road Bridges,
Section -III. Cement concrete (Plain and reinforced) IRC: 22-1986 Standard Specifications and Code of Practice for Road Bridges,
Section VI -Composite Construction (First Revision)
IRC: 78-2000 Standard Specifications & code of Practice for Road Bridges, - Foundations & Substructure.
IRC: 69-2005 Guidelines and Specifications of Expansion joint
IRC: 83(Part-III)-2002 Standard Specifications and codes of Practices for Road Bridges, Section IX – Bearing, Part II: POT Bearings
IS 2911-1979 Code of practice for design and construction of pile foundations
For the items not covered in the above specifications, provisions of following standards are followed in the given order of priority:
• Provisions of IS codes of Practices:
• Relevant Provisions of BS codes of practices • Sound Engineering Practices, technical Literature/ Papers & Provisions of relevant codes of advanced and developing countries.
D. Details of Improvement Proposals
Taking into consideration the volume of traffic and pattern of movement, for decongesting the junction, it is proposed to provide a flyover along NH 65 which carries major share of traffic. This also segregates the through traffic from cross traffic. In view of high volume of traffic along this route, dual 2 lane carriageway separated by a central median is proposed for the flyover structure. Each 2 lane carriageway, intended for each direction of traffic, has a width of 7.5m with crash barriers of 0.5m width on extreme outer ends. The central median has a width of 1m. The existing alignment of NH 65 is followed for the flyover.
The flyover is on structure except for a small length on either ends. Earthen ramps with
Available online: https://edupediapublications.org/journals/index.php/IJR/ P a g e | 344 DESIGN REPORT
A. General
Detailed design of the proposed flyover has been carried out based on the data collected during various surveys like topographical survey, geotechnical survey and also as specified in the traffic study findings. Apart from different survey outcomes, the urban environment of the area also played a major role in deciding the span length, type of superstructure, shape of substructure etc. Latest versions of relevant standard codes of practices published by Indian Roads Congress (IRC) and MOSRTH standard specifications have generally been followed in finalizing the design concept and in the design of various structural components.
B. Structural Arrangement of Flyover
The 4 lane elevated structure is proposed to have a total width of 17.0 m consisting of 7.5m carriageway for each direction of traffic, 0.5 m wide crash barriers on either outer ends and 1.0 m wide median at the centre. The alignment of the existing road is followed for the flyover structure also. Vertical clearance varying from 5.8m to 6.8m is provided for the obligatory spans at the junction proper. The obligatory span consists of two numbers of 40 m each. Post-tensioned I-girders with cast in situ deck slab is proposed as superstructure.
The girders shall be spaced at 2.2 m apart with cross diaphragms at supports. The cross diaphragms shall be resting on POT-PTFE bearings. RCC hammer headed piers with shaft flaring towards top portion and straight portion below is proposed. Pier cap shall be cantilevered out to accommodate the girders. RCC trestle abutments are proposed. Reinforced earth walls are proposed to retain earth behind the abutment and on sides of ramp portion.
The foundation system consists of bored cast in situ pile groups of 1.2m diameter with average founding levels about 25 m below the existing ground level. Six numbers of piles are proposed for the abutments and 8 numbers are proposed for piers.
C. At Grade Roads
The at- grade roads on either side of the flyover shall be of two lane configuration with carriageway width of 7.5 m. Footpaths and drains having width 2m are provided on the outer edges. Typical arrangement of flyover and at grade road is given in the previous section.
Design Methodology
1. Geometric Design Standards
Available online: https://edupediapublications.org/journals/index.php/IJR/ P a g e | 345 Proposed Geometry
Horizontal Geometry a design speed of 100kmph is adopted for the flyover. The detailed Horizontal Alignment Report is given below in
Table 5-2.
Vertical Geometry
Design of vertical geometry has two components, viz. design of gradients, and design of vertical curves. Vertical curves were designed using a minimum “K-value” of 74 for crest and 42 for sag for speed 100kmph. Care was taken to limit the start and end gradients of the vertical curves within the ruling gradient. Details of proposed vertical curves are given in Table 5-3.
E. Pavement Design
1. Design of Flexible Pavement for New Pavement as per IRC: 37-2001
Traffic Forecast and Design Traffic. Traffic data obtained from traffic survey and analysis have been used for design of pavements. Out of the various types of vehicles encountered during classified traffic volume counts LCV, Bus, 2-Axle and multi axle trucks have been considered as commercial vehicles in pavement design. Table 5-4
gives the summary of ADT obtained from the traffic survey for the proposed approaches to grade separators.
Design Traffic in CMSA (Cumulative Million Standard Axles). The design traffic is considered in terms of cumulative number of standard axles to be carried during the design life of the road. Its computations involves estimates of the initial volume of commercial vehicles per day, lateral distribution of traffic, the growth rate, the design life in years and the vehicle damage factor to convert commercial vehicles to standard axles.
Available online: https://edupediapublications.org/journals/index.php/IJR/ P a g e | 346
used to compute the design traffic Ns, in terms of the cumulative number of standard axles.
D = Lane Distribution Factor- Since the present study is for the construction of dual two lane, D is adopted as 75% of the total number of commercial vehicles in each direction for dual two lane.
F = Vehicle Damage Factor (VDF) - defined as equivalent number of standard axles per commercial vehicle. It is a multiplier to convert the number of commercial vehicles of different axle loads and axle configuration to the number of standard axle load repetitions.
If Initial traffic volume in terms of number of commercial vehicles per day varies from 0 to 150, 150 to 1500 & more than 1500 commercial vehicles per day, national average vehicle damage factor as per IRC: 37-2001 is taken as 1.5, 3.5 & 4.5 respectively.
Ns = Cumulative no. of Million Standard Axles (CMSA)- The design traffic in terms of cumulative number of million standard axle load repetitions obtained as per IRC 37 for a design period of 15 years are given in the Table 5-6.
Thus, from the above table the design traffic in terms of cumulative number of million standard axles (CMSA) is rounded up & taken as 20 CMSA and 15 CMSA for Approach flyover and adjacent roads.
2. Existing Sub grade and Design CBR
Borrow Area: The samples collected from nearby borrow area and shows good quality soil
which can be used for the sub grade. The 4 days soaked CBR value of the sample tested found to be 8% and the same is proposed to be used for sub grade.
Design CBR: Keeping in view the soil characteristic as stated above, the pavement for the project road has been designed adopting CBR value of sub grade as 8%.
Pavement Design
Considering the sub grade soil CBR of 8% and design traffic as given in Table 5-6, the new flexible pavement thicknesses obtained for a design life period of 15 years as per IRC 37 works out as under in Table 5-7.
Structural Design Standards
The design methodology is mainly devised from the method of construction proposed to be adopted. Considering the intensity of daily traffic taking this route which warrants speedy completion of the whole work, pre- cast construction method is adopted. The post tensioned girders shall be casted in the yard and transported to the site and thus ensuring minimum time for construction. Designs have been done for transfer and service stages.
Loading Standards the structural system is designed for loadings as per IRC 6: 2000. The basic loadings considered are:
• Dead load constituting of self -weight of structural members
• Superimposed dead load constituting of weight of wearing coat, crash barrier and median
Available online: https://edupediapublications.org/journals/index.php/IJR/ P a g e | 347
is based on the severe exposure condition. Design mix is proposed for all grades of concrete.
F. Design of Superstructure 1. Post tensioned Girders
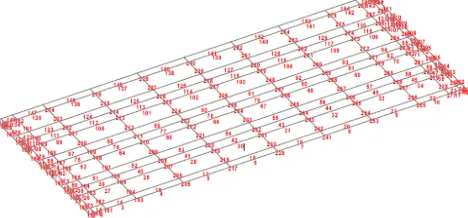
Grillage Analysis of Girder. A grillage model of the superstructure arrangement is prepared. The longitudinal members of the grillage are formed by the main girders. The cross girders and deck slab form the transverse members of the grillage.
Section Properties, The section properties of various members of the grillage are calculated. Area of cross section, Moment of inertia, location of centre of gravity etc is calculated. A small value of torsional moment of inertia is used in the analysis to get worse effects on the members. The members in the grillage are idealized in to the following.
(i) Virtual members: This forms the extreme edges of the superstructures. These edge members are given negligible properties as to include them in the analysis to complete the form but not to include its effect.
(ii) End girder members: This represents the end girders on either side. The property of this member is calculated by considering a T- section. The cantilever portion of deck slab on one side and deck slab length equal to half the spacing between the girders on the other side together form the flange of the T-section. At the locations of the curves, the cantilever length of the deck slab is taken as the average cantilever length at two nodes of each member. The web portion is constituted by the I-girder.
(iii) Mid girder members: This represents the intermediate girder. The property of this member is calculated by considering a T- section. The deck slab length equal to half the spacing between the girders on the either side forms the flange of the T-section. The web portion is constituted by the I-girder.
End Cross Girder Members: This represents cross girders provided at the pier/abutment locations. The property of this member is calculated by considering a T- section. Effective width is considered based on the longitudinal girder spacing. (v) Intermediate Cross Diaphragm Member: This represents diaphragms provided at the mid span of girder. The property of this member is calculated by considering a T-section. Effective width is considered based on the longitudinal girder spacing. (vi) Other Transverse Members: The span of the grillage is divided into equal number of convenient sections.(imaginary) The property of these members are calculated based on its position and the spacing of this imaginary sections. Accordingly following different entities are considered
• Slab Adjacent to End Cross Girder: The property of this member is calculated considering it as a rectangular section the depth being the depth of the deck slab and the width being the width from slab edge to the mid of the spacing between imaginary sections. The effective width of end cross girder considered in the design is deducted from the width calculated for this member.
• Slab Adjacent to Intermediate Cross Girder: This is considered only if the intermediate cross girder is provided. The property of this member is calculated considering it as a rectangular section the depth being the depth of the deck slab and the width being the spacing between imaginary sections. The effective width of intermediate cross girder considered in the design is deducted from the width calculated for this member.
• Middle Slab: The property of this member is calculated considering it as a rectangular section the depth being the depth of the deck slab and the width being the spacing between imaginary sections.
Available online: https://edupediapublications.org/journals/index.php/IJR/ P a g e | 348
rectangular section the depth being the depth of the cantilever portion of deck slab and the width being the spacing between imaginary sections.
End Cantilever Slab: This forms the corner members of the grillage. The property of this member is calculated considering it as a rectangular section the depth being the depth of the cantilever portion of deck slab and the width being half the spacing between imaginary sections.
Loads
(i) Dead Load: The dead weight of each component is calculated from the area of cross section calculated for each member. The dead weight of each member is applied as UDL. Density of concrete is taken as 25kN/m3.
(ii)Superimposed dead load: Load due to crash barrier, median, wearing coat and precast panels is included in this. The loads are applied locally on the members on to which the loads are transferred (separate analysis is carried out to distribute the footpath load on different girders). The utility load is considered separately. Density of concrete is taken as 24kN/m3. Density of wearing coat is considered as 22kN/m3. Utility load is taken as 2kN/m.
(iii) Live Load: Moving load analysis is carried out for both Class A and Class 70R load cases (and their combination where required). Different positions of wheels in the transverse directions are considered as to induce maximum effect. Two typical cases were considered
• The wheel was arranged at minimum distance (as specified in IRC 6-2000) from the crash barrier edge.
• The worst effect due the live load case was combined with the Dead load and Superimposed dead load as to arrive at the design values of moments and shear.
Figure 5-4: Grillage model for superstructure analysis
Design of PSC Girder the design of PSC girder is carried out based on accepted theories.
Following losses were considered in the design Initial losses
• Elastic shortening
• Relaxation of steel (one part –IRC 18-2000 – clause 11.4)
(ii) Time dependent losses • Shrinkage of concrete
• Relaxation loss (remaining part) As per IRC 18:2000, (Cl 11.4), three times 1000hr value due to relaxation is considered in service condition. • Creep losses
• Long term time dependent losses: 20 % of total loss due to shrinkage, creep and relaxation losses (iii) Other effects
• Differential shrinkage: The effect of differential shrinkage is calculated considering a differential shrinkage strain of 0.00010 and reduction factor of 0.43.
• Temperature effects: The effect of rise/fall of temperature is considered as explained in IRC 6-2000. As per code specification (IRC 18-2000) 50% of live load is considered in arriving at the stresses while considering temperature effects.
The design has been carried for the worst girder. The design at critical sections like support, L/8 etc are also checked to arrive at the number of strands to be de-bonded at respective locations in case of pre-tensioned girders and to arrive at the cable profile in case of Post tensioned girders.
The design is checked for ultimate strength (moment and shear) in accordance with IRC -18-2000 Clause 12.
Transverse Analysis for Deck Slab Design the transverse analysis of the deck slab is carried out using software. The slab is treated as a continuous member supported at the girder locations. The self -weight of deck slab is applied as uniformly distributed load on the slab. The load due to crash barrier, wearing coat and median is considered as the superimposed dead load. This is also applied as UDL, at respective locations. For the application of live load, various possible critical arrangements of wheel loads are considered. For different arrangements, the effective dispersion of each wheel and the net distributed load is calculated. This load is applied as UDL over the worked out dispersed area. The following cases of live loads were studied:
(i) The maximum wheel load at minimum distance from the crash barrier edge
Available online: https://edupediapublications.org/journals/index.php/IJR/ P a g e | 349
(iv) One span loaded and the adjacent span with no load
All the above cases are checked for Class A load and Class 70R load. An impact percentage of 10 is adopted for the live loads. Combination of different live load cases with the Dead load and Superimposed dead load is carried out. The following design moments are calculated:
(i) Maximum hogging moment at the extreme support (cantilever location)
(ii) Maximum hogging moment at the intermediate support
(iii) Maximum sagging moment at mid span between supports
The design is carried for the critical moment. The design is also checked for composite action as per IRC 22-1984. End Cross Girders: End cross girder is analyzed as a continuous beam with loads from dead load of longitudinal girder, deck slab, superimposed dead load and live load as pointed loads at girder ends. The self -weight of the Cross girder is considered as UDL.
Loadings.
(i) Dead Load: The self -weight of the superstructure is considered as the dead load. For RCC works the density of concrete is taken as 24kN/m3. For PCC and wearing course works, the density is taken as 22kN/m3.
(ii) Live Load: The design is done for two lanes of live loading. Worst case of the following combinations is considered for girder design: • Two lanes of IRC 70R - near median on either carriageway
• Two lanes of IRC 70R – one near crash barrier and other one near median on other side
• Four lanes of IRC Class A – near crash barrier • Four lanes of IRC Class A – near median • Two lanes of IRC Class A – near crash barrier • Two lanes of IRC Class A – near median
• Two lanes of IRC Class A near crash barrier on one side and one 70R on the other side
• Two lanes of IRC Class A near median on one side and one 70R on the other side
(iii) Impact: Provision for impact or dynamic action due to live load is accounted as per Clause211.1 of IRC 6: 2000. The live load is incremented by the impact percentage. For Class A loading the impact percentage is calculated as per the standard formula in Clause 211.2 or Fig 5 of IRC 6:2000. For Class 70R loading impact is considered as per clause 211.3.
Analysis of the superstructure is carried out on a FEM model. A grid model representing the
deck slab and supporting arrangement with truss members is developed. Analysis model for transverse analysis of deck slab is also done in FEM software. Design moments and shear forces are taken from the output of the software.
Design of Substructure and Foundation
The design of substructure and foundation of the flyover is carried out based on IRC 6-2000 and IRC 78-2000. The latest amendments of IRC 6:2000, IRC 78:2000 etc are adopted in the design. RCC hammer headed piers with flaring on the top portion and straight portion below is proposed. Pier cap is provided over the flaring. Abutments are designed similar to piers with no earth pressure forces. The effects of load from one side span alone are considered in the abutment design.
Primary Loads considered:
(i) Dead Load: Vertical load due to dead load of the superstructure on the abutment and the self -weight of abutment is considered. The density of concrete is taken as briefed above.
(ii) Superimposed Dead Load: Vertical load from superstructure due to superimposed dead load is considered under this loading.
(iii) Live Load: Effects due to following cases are studied and worst case of these is considered in the design.
• Single lane IRC 70R placed at extreme end • Two lanes of IRC 70R
• Single lane of IRC class A • Four lanes of IRC class A
CONCLUSIONS
In this project traffic survey was conducted to know the hourly Passenger Car Unit (HPCU) at FOUR ROADS Intersection, Hyderabad. From survey the value of HPCU of the intersection is 6547 by considering future taking the design period of 30 years, the value of HPCU is found 65273. From the above result it is proposed a grade separator at that round about.
In this grade separator the main components consists of Deck slab, longitudinal girder, Cross girder, bearing plate, Pier and Foundation. The geometric design of the grade separator was done by using IRC Code Books.
The Deck slab is designed by using IRC: 6-2000 codal provisions. Here after in further we have to consider the analysis, longitudinal girder, estimation, steel requirement and cost of Analysis and Design of flyover. All dimensions are in mm
REFERENCES
1.
Thevaneyan K. David; John P. Forth; andAvailable online: https://edupediapublications.org/journals/index.php/IJR/ P a g e | 350
Behavior of a Stub-Type Integral Abutment Bridge” J. Bridge Eng., 2014, 19(6):-ASCE
2.
Huffaker, Conner D., "Bahavior and Analysis of an Integral Abutment Bridge"(2013). All Graduate Theses and
Dissertations Paper 1718.Utah State University
3.
Harry White 2nd, Engineering ResearchSpecialist II (2007) “Integral Abutment Bridges: Comparison of Current Practice between European Countries and the United States of America “Special Report 152 July 2007, Transportation Research and Development Bureau New York State Department of Transportation, 50 Wolf Road, Albany NY 12232.
4.
Trilok Gupta, Anurag misra (2007), “Effect on support reaction of skew bridges”, Journal of bridge engineering, ARPN. Vol. 2, No. 1.5.
Shreedhar, R., Rashmikharde, (2009), “Effect of skew bridge for moving loads”, International journal of scientific &engineering research, vol - 4, issue feb-2013, ISSN 2229-5518.6.
Vikash Khatri, P.R., Maiti. P.K., Singh and Ansumankar, (2010), “Analysis of skew bridge using computational methods, /ISSN: 2250- 3005”, Banaras Hindu University, Varanasi.7.
Maher, Eyad Fadda, Emad Akawwi,(2008), “Design of T-beam bridge by finite element method”, (KMITL), Vol.8, No. 1.
8.
Arindam Dhar, Mithil Mazumder, Somnath Karmkar, (2013), “Effect of skew angles on longitudinal girder (shear, moment) and deck slab of an IRC skew bridge, The Indian Concrete Journal.9.
Krishna Raju, N., (2009), “Design ofbridges”,IBM publication, Fourth Edition.
10.
Vazirani, V.N, Ratwani, M.M, (2009), “Design of Reinforced Concrete structure”, Khanna publications, 16th edition, Delhi.Krishna Raju, N., (2013), “Pre-stressed Concrete”, Mc Graw Hill education, Fifth Edition.11.
A. LAKADE, A. K. Gupta, D. B. Desai (2013) “A Project Management Approach Using ERP and Microsoft project in Construction Industry” OSR Journal ofMechanical and Civil Engineering (IOSR-JMCE) ISSN: 2278-1684, PP: 21-24.
12.
Andrew Fernans Tom, Sachin Paul (2013) “Project Monitoring and Control using Primavera” International Journal ofInnovative Research in Science,
Engineering and Technology Vol. 2, Issue 3, March 2013 ISSN: 2319-8753