Scholarship@Western
Scholarship@Western
Electronic Thesis and Dissertation Repository
12-11-2018 10:00 AM
Electroacoustic Assessment of Hearing Aids and PSAPs
Electroacoustic Assessment of Hearing Aids and PSAPs
Manan Sheel
The University of Western Ontario
Supervisor Parsa, Vijay
The University of Western Ontario
Graduate Program in Electrical and Computer Engineering
A thesis submitted in partial fulfillment of the requirements for the degree in Master of Engineering Science
© Manan Sheel 2018
Follow this and additional works at: https://ir.lib.uwo.ca/etd Part of the Signal Processing Commons
Recommended Citation Recommended Citation
Sheel, Manan, "Electroacoustic Assessment of Hearing Aids and PSAPs" (2018). Electronic Thesis and Dissertation Repository. 6027.
https://ir.lib.uwo.ca/etd/6027
This Dissertation/Thesis is brought to you for free and open access by Scholarship@Western. It has been accepted for inclusion in Electronic Thesis and Dissertation Repository by an authorized administrator of
i
Hearing aids and personal sound amplification products (PSAPs) are commonly used
assistive devices for treating hearing loss. Due to the diversity in the hardware and signal
processing algorithms in these devices, comprehensive verification of their performance is
essential. Existing standards for assistive hearing devices are primarily used for quality
control purposes and do not quantify their performance in a perceptually-relevant manner.
The aim of this thesis was to develop a comprehensive electroacoustic testing toolbox for
hearing devices that encompasses both quality control and perceptually-relevant measures. In
particular, a test sequence was developed to assess the effectiveness of noise reduction
feature in assistive hearing devices. Several commercially-available hearing aids and PSAPs
on the “best seller” list at Amazon.ca were evaluated using the toolbox. Key results include:
(a) hearing aids differ in their noise reduction performance; (b) some of the popular PSAPs
do not meet the ANSI standards and are capable of producing dangerous sound pressure
levels; and (c) hearing aids performed better than PSAPs on perceptually-relevant metrics.
Keywords
Hearing Aids, Personal Sound Amplification Products (PSAPs), Hearing Aid Speech
Perception Index (HASPI), Hearing Aid Speech Quality Index (HASQI), Short-time
ii
Acknowledgments
First, I would like to thank my supervisor Dr. Vijay Parsa for guiding me throughout my
research. He was always supportive and helped me to learn so many new things step-by-step.
I, gaining so much knowledge of the subject, without ever feeling burdened, would not have
been possible without him.
Then, I would like to thank my parents and aunt, for their constant emotional support, who
always kept me hopeful.
After that, I will thank anyone who thought of my good, for unknowingly, he/she has also
iii
Table of Contents
Abstract ... i
Acknowledgments... ii
Table of Contents ... iii
List of Tables ... vi
List of Figures ... viii
List of Appendices ... xi
Chapter 1 ... 1
1 Introduction ... 1
Hearing in Humans ... 1
Hearing Loss and Treatment ... 2
A Typical Hearing Aid... 4
The need for Electroacoustic Measures ... 7
Problem Statement and Thesis Contributions ... 8
Chapter Organization ... 9
Chapter 2 ... 10
2 Electroacoustic Testing ... 10
Standards for Testing Hearing Aids ... 10
Standards for PSAPs Testing ... 10
Other Measures ... 11
2.3.1 STOI ... 11
2.3.2 HASPI, HASQI ... 12
Literature Review... 14
2.4.1 Previous Research on Perceptual Metrics ... 14
iv
2.4.3 Previous Evaluation of PSAPs ... 15
Chapter 3 ... 17
3 Testing Hearing Aids ... 17
Test Sequence ... 17
Experimental Setup ... 18
MATLAB GUI... 21
Hearing Aids Tested ... 22
Hearing Aid Parameter Computation... 22
3.5.1 Attack Time and Release Time ... 23
3.5.2 Processing Delay ... 23
3.5.3 Amount of Noise Reduction ... 24
3.5.4 STOI ... 24
3.5.5 Objective SNR ... 25
3.5.6 HASPI and HASQI ... 25
3.5.7 Internal Noise Floor ... 26
3.5.8 Repeatability ... 26
Results ... 27
3.6.1 Comparison of Hearing Aid Parameters ... 27
Chapter Summary ... 37
Chapter 4 ... 38
4 Testing of PSAPs ... 38
Description of PSAPs ... 38
Methodology ... 39
PSAP Testing ... 41
4.3.1 Fit to Standard Audiograms ... 41
v
4.3.3 Repeatability ... 49
PSAPs Results ... 50
4.4.1 Results (from the point of view of RMSE and SII Values) ... 50
4.4.2 Results for Parameters ... 50
4.4.3 Comparison between PSAPs and Hearing aids ... 56
Chapter Summary ... 61
Chapter 5 ... 62
5 Conclusions ... 62
Summary ... 62
Contributions... 62
Future Work ... 63
References or Bibliography ... 65
Appendices ... 68
vi
List of Tables
Table 3.1 : Standard audiograms [25] ... 22
Table 4.1 : PSAPs Price Chart ... 38
Table 4.2 : NewEar HA PSAP, First step ... 42
Table 4.3 : ZIV - 201 (P1), First Step ... 43
Table 4.4 : ZIV - 201 (P2), First Step ... 43
Table 4.5 : NewEar FDA, First Step ... 44
Table 4.6 : LYB - 44, First Step... 44
Table 4.7 : Otofonix-elite (Program 1), First step ... 45
Table 4.8 : Otofonix-elite (Program 2), First step ... 45
Table A.1 : Parameter Tables for Bernafon hearing aid ... 68
Table A.2 : Parameter Tables for Phonak hearing aid ... 69
Table A.3 : Parameter Tables for Siemens hearing aid ... 70
Table A.4 : Parameter Tables for Starkey hearing aid ... 71
Table A.5 : Parameter Tables for Unitron basic hearing aid ... 72
Table A.6 : Parameter Tables for Unitron Premier hearing aid ... 73
Table B.1 : ZIV - 201 (Program 1) PSAP Parameter Mean Table ... 74
Table B.2 : ZIV - 201 (Program 1) replication table ... 75
Table B.3 : NewEar5 PSAP Parameter Mean Table ... 76
vii
Table B.5 : NewEar FDA Approved PSAP Parameter Mean Table... 78
Table B.6 : NewEar FDA Approved PSAP replication table ... 79
Table B.7 : ZIV - 201 (Program 2) PSAP Parameter Mean Table ... 80
Table B.8 : ZIV - 201 (Program 2) PSAP replication table ... 81
Table B.9 : LYB - 44 PSAP Parameter Mean Table ... 82
Table B.10 : LYB - 44 PSAP replication table ... 83
Table B.11 : Otofonix-elite (P1) PSAP Parameter Mean Table ... 84
Table B.12 : Otofonix-elite (P1) replication table ... 85
Table B.13 : Otofonix-elite (P2) PSAP Parameters Table ... 86
Table B.14 : Otofonix-elite (P2) replication table ... 87
viii
List of Figures
Figure 1.1 : Structure of the human ear. [1] ... 1
Figure 1.2 : Sample audiograms for a normal hearing individual and a hearing-impaired individual. ... 3
Figure 1.3 : Signal processing schemes in a generic hearing aid [9] ... 4
Figure 2.1 : Block diagram of the STOI algorithm taken from [16]... 12
Figure 2.2 : Auditory model of human ear (HASPI, HASQI) [17] ... 13
Figure 3.1 : Experimental Setup for Testing Hearing Aids ... 18
Figure 3.2 : Hearing Aid in the Test Box... 19
Figure 3.3 : Verifit-2 from Audioscan [29] ... 20
Figure 3.4 : User Interface for Hearing Aids Testing ... 21
Figure 3.5 : Attack time (in seconds) for the case of speech shaped noise and multi-talker babble. ... 27
Figure 3.6 : Hearing aid output to the test sequence for speech shaped noise ... 28
Figure 3.7 : Hearing aid output to the test sequence for multi talker babble ... 28
Figure 3.8 : RMS of the noisy frames for the ANR OFF and ANR ON. ... 29
Figure 3.9 : Release time (in seconds) ... 30
Figure 3.10 : STOI Values (Speech Shaped Noise) ... 30
Figure 3.11 : STOI values (multi talker babble) ... 31
Figure 3.12 : HASPI values (speech shaped noise) ... 31
ix
Figure 3.14 : Amount of noise reduction (dB) for speech shaped noise... 33
Figure 3.15 : Amount of noise reduction (dB) for multi talker babble ... 33
Figure 3.16 : Output SNR (dB) for speech shaped noise ... 34
Figure 3.17 : Output SNR (dB) for multi talker babble ... 34
Figure 3.18 : Processing delay (in milliseconds) ... 35
Figure 3.19 : Internal noise floor (dBA) ... 35
Figure 3.20 : HASQI values (speech shaped noise) ... 36
Figure 3.21 : HASQI values (multi talker babble) ... 36
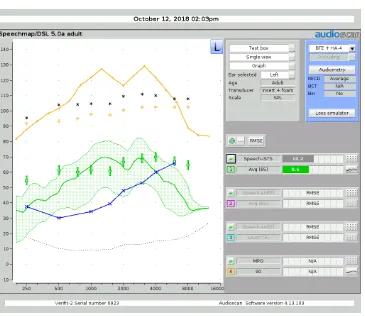
Figure 4.1 : A PSAP in the Verifit-2 system. ... 39
Figure 4.2 : Screenshot of Audioscan recording tool. ... 40
Figure 4.3 : Speechmap screenshot of ZIV - 201 (P1) for N3 audiogram ... 41
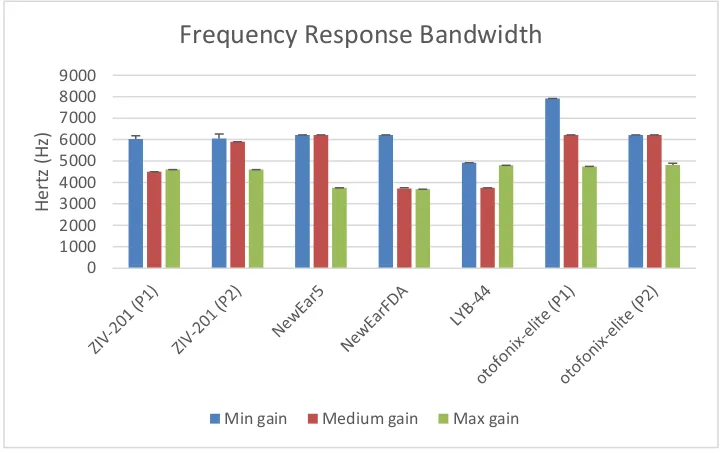
Figure 4.4 : Frequency response bandwidth (Hz) ... 50
Figure 4.5 : Distortion at 100 dB SPL output ... 51
Figure 4.6 : Distortion at 95 dB SPL input ... 51
Figure 4.7 : STOI values (speech shaped noise) ... 52
Figure 4.8 : STOI values (multi talker babble) ... 52
Figure 4.9 : High frequency gain provided (dB) ... 53
Figure 4.10 : Internal noise values ... 53
Figure 4.11 : HASPI values, comparison with clean speech ... 54
x
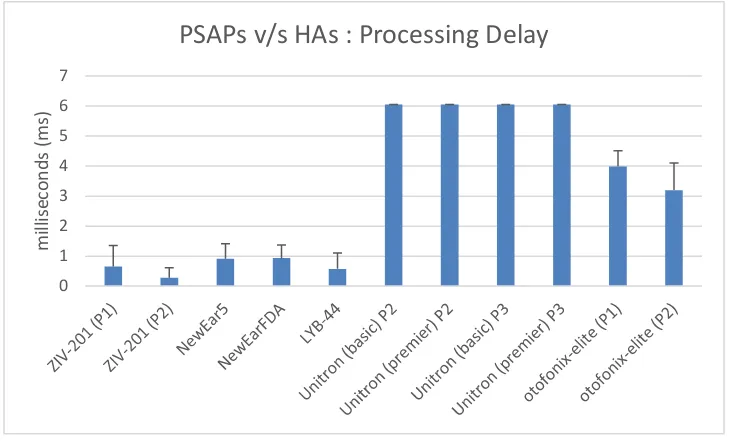
Figure 4.13 : PSAPs v/s Hearing aids: Hearing aid delay ... 56
Figure 4.14 : PSAPs v/s Hearing aids: Internal noise floor ... 57
Figure 4.15 : PSAPs v/s hearing aids : STOI (speech shaped noise) ... 57
Figure 4.16 : PSAPs v/s hearing aids: STOI (multi talker babble) ... 58
Figure 4.17 : PSAPs v/s Hearing aids: HASPI (speech shaped noise) ... 58
Figure 4.18 : PSAPs v/s Hearing aids: HASPI (multi talker babble) ... 59
Figure 4.19 : PSAPs v/s Hearing aids: Amount of Noise Reduction... 60
Figure 4.20 : PSAPs v/s Hearing aids: HASQI values ... 60
xi
List of Appendices
Appendix A: Hearing Aid Parameter Tables ... 68
Chapter 1
1
Introduction
Hearing in Humans
Figure 1.1 : Structure of the human ear. [1]
Hearing is one of the five senses for humans, and often deemed as the most important,
second only to vision [2]. Figure 1.1 displays the structure of a human ear. The outer part
of the human ear is the pinna, which acts as a funnel to channel sound waves into the
external auditory canal. The sound waves travel through the ear canal and impinge on the
tympanic membrane which vibrates in response to the acoustic variations. The tympanic
membrane is connected to the bones in the middle ear (Malleus, Incus and Stapes) which
amplify these vibrations and efficiently transmit them to the inner ear. The inner ear
consists of the cochlea, which is a spiral, snail-like structure filled with fluid. The middle
ear vibrations cause the fluid inside the cochlea to move. This causes a movement in the
hair cells present in the cochlea, and the generation of electrical impulses, which are then
Hearing Loss and Treatment
Peripheral hearing loss occurs when the sound waves are either not efficiently transmitted
to the cochlea or when there are impediments in the functioning of the inner ear [3]. The
former is termed as conductive hearing loss that originates from sound conduction
deficits in the outer or the middle ear such as fluid retention in the middle ear or impaired
functioning of the middle ear bones [3]. The latter type of peripheral hearing loss,
labeled as the sensorineural hearing loss, is more common and is caused by abnormal
functioning of the hair cells or auditory nerve fibers in the cochlea [3]. This thesis
focuses on treatment related to sensorineural hearing loss.
According to [4], hearing loss is the third most prevalent chronic condition (behind
arthritis and hypertension) in adults. In Canada, 20% of adults aged 19 to 79 years had at
least mild hearing loss in at least one ear. 47% of adults aged 60 to 79 years were
significantly more likely to have hearing loss [5]. Untreated hearing loss results in social,
economic, and health consequences. According to the information in [6], untreated
hearing loss can lead to damage in relationships, deteriorating self-esteem, reduced
psychological health, and lesser income as compared to people with normal hearing.
Hence, assistive devices and technologies that alleviate the negative consequences of
hearing loss are important.
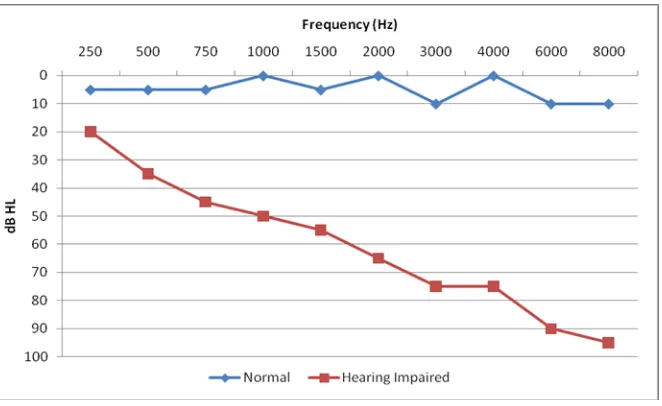
Hearing sensitivity is typically measured by obtaining an audiogram (see Figure 1.2). In
an audiogram, the sound frequencies are along the horizontal axis (increasing as we move
towards right) and the threshold for hearing in dB is on the vertical axis (increasing as we
move down). For a particular frequency, we get a point on the graph for one ear of a
person, and another point for the other ear. This point corresponds to a hearing level (in
dB) which is the level at which a sound is just audible, which means no sound below this
level at this frequency is audible to the person [7]. The audiogram serves as the basis on
Figure 1.2 : Sample audiograms for a normal hearing individual and a
hearing-impaired individual.
Also, the graphs of loudness recruitment for an individual are obtained. Loudness
recruitment is a condition in which the change in loudness perception by an individual
occurs steeply after a certain frequency. It is usually caused by the loss of outer hair cells.
These graphs also effect the prescription and fitting of hearing aids.
Hearing aids are devices which are approved by the Food and Drug Administration
(FDA), United States of America, to treat hearing loss [8]. They are often prescribed and
fitted to the listening needs of a hearing-impaired individual by an audiologist or other
hearing healthcare practitioner. Personal Sound Amplification Products (PSAPs) are
devices which are much cheaper compared to hearing aids and can be purchased
over-the-counter or online. They don’t need the support of a hearing health care professional.
The PSAPs are labelled as devices for individuals with normal hearing who engage in
activities such as listening to lectures, hunting, etc. [8] and thus, there is no need for FDA
involvement. However, due to their affordability, many people with hearing loss are
utilizing PSAPs. Hearing healthcare professionals like audiologists are not commonly
part of the process when a PSAP is acquired by an adult with normal hearing. Assistive
Listening Devices (ALDs) are devices that people can use in specific situations, where
communication in noisy and reverberant environments, where the signal-to-noise ratio
(SNR) is too low. ALDs are not regulated by the FDA and can be purchased over the
counter or online [8]. Hearables are devices which can be used to provide a better
listening experience to the user. They can also have some features for certain special
tasks like tracking calories burned, steps taken, or monitoring heart rate, etc. [8], and like
PSAPs, are not meant compensate for an individual’s hearing loss.
This thesis focuses on hearing aids and PSAPs, and as such a description of their
functionality is given next.
A Typical Hearing Aid
Current generation hearing aids incorporate sophisticated digital signal processing (DSP)
algorithms. The DSP blocks in a generic hearing aid are shown in Figure 1.3 [9].
Figure 1.3 : Signal processing schemes in a generic hearing aid [9]
The first process in a hearing aid is the picking up of sound by a microphone. Often,
more than one microphone is used for providing the directionality feature to a hearing aid
by beamforming techniques. Beamforming means to delay the output of one microphone
and then, combining it with the output of the other microphone in a way so as to reduce
noise coming from a particular direction. After the sounds are picked up, converted to
electrical signals and after the electrical signals are converted into the digital domain,
into different frequency bands and the signal processing is applied to the frequency bands
separately. This analysis is important for the subsequent processing in the hearing aid.
After analysis, an environmental classification of the signal is done, based on the features
of the signal like the relative levels of the signals in various frequency bands, spectral
characteristics, signal-to-noise ratio in different frequency bands, etc. This environmental
classification steers all the processing applied to the signal by the hearing aid afterwards.
A restaurant, a street, a hall full of people, a silent room: these can be some of the
different environments. There are two main sets of signal processing that are applied. The
first one serves to clean the sound and the second one to restore the hearing in a
hearing-impaired individual based on an individual’s audiogram and graphs of loudness
recruitment.
The sound cleaning portion has algorithms for feedback cancellation, noise reduction,
pinna simulation, and adaptive beamforming. When the sound amplified through a
hearing aid leaks out of the hearing aid and is directed back into the microphone(s) of the
hearing aid, it is amplified again creating a high-pitched whistling sound often audible to
others. This acoustic feedback is cancelled using feedback cancellation algorithms. In
addition to feedback cancellation, there are various algorithms hearing aids which can
perform noise reduction for different noise types such as stationary, impulsive or sudden
noise, wind noise, and reverberation or echoes. Noise reduction attempts to improve the
quality of sound for listeners. The pinna or the outermost part of the ear has many
functions. It helps the listener in knowing from which direction the sound is coming and
it also acts like a funnel to concentrate sound into the ear. When people use a
Behind-the-Ear (BTE) hearing aid, the benefits of the pinna are eliminated because sound is gathered
at the microphone on top of the pinna rather than into the ear canal. So, the pinna
simulation algorithm compensates for this loss through the use of two microphones and
signal processing specific to the frequency. Adaptive beamforming technique is used to
increase the signal strength of the signal coming from a particular direction. This is
attained by combining the signals from the other directions destructively. Usually, the
sound coming from the front direction is strengthened and the sound coming from the
The second set of signal processing algorithms provide frequency lowering and
level-dependent gain in a hearing aid. The gain that depends on the level of the signal is
applied separately in each frequency band according to the requirements (audiogram) of a
person. Within each frequency band, for lower levels of the input signal, a linear or
expansive gain is applied, and for higher levels, compressive gain is applied which means
that the increase in the corresponding output level is lesser than the increase in the input
level. Also, the output level is increased up to a limit beyond which it no longer
increases. This is done to avoid the listener from being subjected to inappropriately high
sound levels. Thus, the level-dependent gain processing ensures that soft sounds are
audible and loud sounds are comfortable. Finally, the frequency lowering DSP feature is
helpful when people have severe to profound hearing loss in the high frequencies. The
frequency lowering signal processing shifts high frequency sounds to the frequencies
where the person with the hearing loss can hear and thus, makes them audible. After this
processing, all frequency bands are recombined to generate one electrical signal, that
goes into the receiver, which converts it back to sound. This sound output from a hearing
aid is then heard by the person wearing the hearing aid. [9]
PSAPs are simpler electronic amplification devices that are less expensive compared to
hearing aids. Hearing aids, on average, are about 10 times costlier than PSAPs. They are
available over-the-counter and do not require prescription by an audiologist. They do not
have complex features like hearing aids and do not offer advanced signal processing.
They contain a microphone to convert incoming sound signals to electrical signals, which
are then amplified by an amplifier and fed into a speaker which converts them back to
sound signals which are heard by the wearer. In comparison to the hearing aids, most
PSAPs:
• Do not provide level-dependent amplification. Lower end PSAPs provide a fixed
frequency response that varies linearly with input level. As such, the ability to
tailor the PSAP’s response to match a given audiogram may be limited.
• Do not employ directional microphones nor do they offer the pinna compensation
• Do not incorporate transient and wind noise reduction features, although some of
them are advertised to offer noise reduction features.
Given the disparity in hearing aid and PSAP products, it is imperative that their
performance is comprehensively assessed.
The need for Electroacoustic Measures
The performance of hearing aids and PSAPs can be assessed through behavioral outcome
measures or through electroacoustic evaluations. Behavioral measurements involve
hearing impaired participants to assess the impact of their hearing technology. Examples
of behavioral measures include speech understanding in quiet and noise, and judgments
of device sound quality. Although subjective testing is the gold standard for the
evaluation of hearing aid and PSAP performance, electroacoustic measures are attractive
due to the benefits they provide. Electroacoustic measures are automatic and thus, they
consume lesser time and we do not need actual people for testing unlike subjective
testing, thus we save in resources too.
There are standards available from the American National Standards Institute (ANSI) and
the International Electrotechnical Commission (IEC), which provide guidelines for
electroacoustic characterization of hearing aids and PSAPs. For example, for hearing
aids, the standards are given in ANSI S3.22 and for PSAPs, they are given in
ANSI/CTA-2051. Some of the parameters specified in the standard include the frequency response
smoothness, bandwidth, distortion, maximum acoustic output, etc., which are good for
measuring the basic functionalities of the devices, but they do not have much perceptual
relevance. They do not tell how a person wearing the hearing devices will perceive their
performance. This perception is more related to the intelligibility and/or quality of the
sound coming out from the device. It also depends on the Signal-to-Noise Ratio (SNR) of
the sound output, because the background noise plays a key role in a person’s perception
of the sound coming from the device.
Thus, in this thesis, in addition to the parameters that provide the information on the basic
Objective Intelligibility (STOI) metrics, Hearing Aid Speech Perception Index (HASPI)
and Hearing Aid Speech Quality Index (HASQI) that have been shown to correlate with
behavioral measures were also incorporated for comprehensive benchmarking of hearing
device performance. Furthermore, parameters such as the ‘amount of noise reduction’ and ‘attack and release times for noise reduction’ have been measured that also provide
perceptually relevant information of the device performance.
Problem Statement and Thesis Contributions
Hearing aids are the most common treatment solutions for hearing loss that are prescribed
and fitted by hearing health care professionals. In addition, lower cost PSAPs are
available directly to the consumer through various retail outlets. Given the diversity in
hearing aid and PSAP devices and their processing algorithms, it is imperative to
benchmark their performance. Existing hearing aid and PSAP performance standards are
aimed for quality control of these devices, and do not portray perceptually relevant
information. In addition, while there is overlap between the hearing aid and PSAP
standards, they do not specify the same set of electroacoustic test procedures.
This thesis proposes a common framework for benchmarking both hearing aids and
PSAPs that includes both the quality control and perceptually-motivated electroacoustic
indices. In addition, this thesis focuses on the assessment of the noise reduction feature
in hearing aids and PSAPs. A test sequence was developed and the response of the
hearing aid/PSAP to this test sequence was analyzed to automatically extract several
parameters quantifying the device performance in noise, including those that have been
shown to correlate with subjective measures of speech intelligibility and quality (viz. HASPI, HASQI and STOI metrics). Such a comprehensive assessment is lacking in the
literature, especially for PSAPs. This thesis also contributes new electroacoustic data on
the performance of several PSAPs that are considered “best-sellers” on the Amazon.ca
online retail site. It is shown that many of these PSAPs can emit dangerously high sound
pressure levels, and that the perceptually-relevant metrics extracted from them are poorer
compared to hearing aids. The test protocol and the electroacoustic performance data
presented in this thesis will therefore be useful to hearing health care professionals,
Chapter Organization
The rest of the thesis is organized in the following way: Chapter 2 expands on the
standards for electroacoustic evaluation of hearing aids and PSAPs, and reviews the
literature surrounding noise reduction algorithms in hearing aids and PSAPs and the
objective metrics. It also talks about the new test sequence developed to perform these
tests and gives a review of the related literature. Chapter 3 describes the experimental
setup to conduct tests in a desktop test box and the results of testing on hearing aids.
Chapter 4 concentrates on PSAP testing and includes a description of the PSAPs, testing
methods, and results for PSAPs. Finally, Chapter 5 concludes the thesis and highlights
Chapter 2
2
Electroacoustic Testing
Standards for Testing Hearing Aids
Every few years, experts of the field come together to revise the existing standards of
hearing aid performance testing to include the demands of the present day [10]. The
hearing aids standards were revised in 2003, 2009 and 2014 to arrive at the current set of
standards given in ANSI S3.22 – 2014 [11]. These standards provide the description of
different electroacoustic parameters and the specific methods to get their values. They
also provide tolerance limits for the values of these parameters. Since hearing aids are
classified as class I medical devices, the FDA mandates that hearing aids must be tested
using these standards after they are manufactured [12].
Some of the electroacoustic parameters included in the ANSI standards for hearing aids
are distortion, internal noise, high frequency gain, maximum output, etc. These standards
focus on basic functionalities and are good for the purpose of quality control, which
means the manufacturing quality, but does not have much perceptual relevance. There
have been fast advances in hearing aid technology which have led to the development of
many new attractive features in modern digital hearing aids like directionality, wide
dynamic range compression (WDRC), and adaptive noise reduction (ANR). The ANSI
standards have failed to keep up with the fast pace of these advances and require
improvements to include the perceptually relevant parameters and also to measure the
performance of these new hearing aid features.
Standards for PSAPs Testing
The standardization of PSAPs is a topic of debate. Due to their lesser cost compared to
the hearing aids, many people are buying them. According to the results of the survey
conducted in [13], 1.5 million people with hearing impairment in the USA are buying
PSAPs to compensate for their hearing loss, and there is a significant effect on the
hearing aid market due to this [13]. The FDA does not categorize them as medical
for certain situations like hunting, bird watching, listening to someone who is far away
[14]. The need for testing the device after manufacturing applies to all medical devices,
not to electronics products. Due to the popularity of PSAPs, in 2017 the Consumers
Technology Association (CTA) in collaboration with ANSI established a standard
(ANSI/CTA – 2051) to test them. This standard is helpful in setting certain minimum
performance criteria for PSAPs, so that people know more about the functionality of the
devices they are using [15]. The ANSI/CTA standard specifies measures related to the
basic functionalities of the PSAPs, like frequency response bandwidth, frequency
response smoothness, maximum acoustic output, distortion control limits, self-generated
noise levels, and high frequency gain provided. Some PSAPs also advertise a built-in
noise reduction feature, and the standard provides a procedure for assessing noise
reduction. However, similar to the standards for hearing aids, the measures that are
evaluated do not have much perceptual relevance.
Other Measures
2.3.1
STOI
‘STOI’ is short-time objective intelligibility metrics given in [16]. It is an intrusive
metric, which means that it requires a reference signal, to which we compare the target
(test) signal. At the end of its implementation, we get a number (the STOI score) that is
related to the intelligibility of speech in the target signal. This relation is monotonic,
which means that the intelligibility is high if the STOI score is high. This score is
between 0 and 1. Zero indicates the poorest intelligibility and 1 indicates the best
intelligibility. This target signal contains the signal processed by a hearing aid that often
is corrupted by noise. In the hearing-aid, there is time-frequency weighting of the noisy
speech and ‘STOI’ is found to give results in line with the subjective listening tests for
such processing. The block diagram of the STOI computation is shown in Figure 2.1,
where the two inputs (clean and degraded speech), are decomposed using a DFT based
one-third octave band analysis. Then, they are broken up into short-time segments. Each
segment is about 330-500 ms long [16]. Then, after normalization and clipping (to make
sure that utterly degraded values in a few units do not contribute to give a very low
coefficient to get intermediate intelligibility scores, which are averaged over all bands
and all frames to get one number, which is the ‘STOI score’ related to the intelligibility
of the processed signal.
Figure 2.1 : Block diagram of the STOI algorithm taken from [16]
2.3.2
HASPI, HASQI
HASPI is the Hearing Aid Speech Perception Index, as given in [17] and HASQI is the
Hearing Aid Speech Quality Index given in [18]. They are objective metrics that can
predict the subjective speech intelligibility and quality scores, respectively, based on the
hearing aid or PSAP output signal. Their performance has been validated with several
subjective tests that included listening experiments with hearing impaired people. They
are intrusive metrics, in that they compare the hearing aid output to a reference signal.
They make use of an auditory model of the human ear. The hearing aid output passes
through the auditory model, in which compensation is made for the hearing loss, to which
the hearing aid is programmed to. For HASPI, the reference signal passes through the
auditory model for the normal human ear. For HASQI, the reference signal first passes
through a linear filter (based on the audiogram of the hearing aid being tested) before
going into the auditory model. The auditory model used is the same for HASPI and
HASQI, the block diagram of which is given in Figure 2.2. The reference and processed
signals are first resampled and undergo broadband temporal alignment. After that, they
pass through a model of the middle ear. Then, they pass through the outer hair cell model
in which bandpass filters (simulating cochlear filtering mechanism) at different center
cell functioning (a consequence of typical sensorineural hearing loss) is implemented by
broadening the bandwidths of auditory filters. After this, the signals pass through the
second step of alignment, and then through the inner hair cell model. Loss of inner hair
cells (another consequence of sensorineural hearing loss) is incorporated as a subsequent
attenuation stage in the model. Next, the group delay compensation is the last alignment
step which compensates for the delay of the filters used in the filter bank. The two
outputs of the auditory model are compared based on two measures: the cepstral
correlation and auditory coherence. Cepstral correlation takes care of the envelope of the
time domain waveforms (low frequency content) of the degraded signal, and auditory
coherence takes care of the temporal fine structure (high frequency content) of the
degraded signal. The envelope and the temporal fine structure are both important in the
intelligibility and quality of the output signal. Their results are then combined and after
application of a logistic function, we get the HASPI score, which has a monotonic
relation to the speech intelligibility. The HASPI score is between 0 and 1. Zero means no
intelligibility and ‘1’ means perfect intelligibility. HASQI also includes another measure
that takes care of the changes to the long-term signal spectrum. A combination of these
measures gives a HASQI score between 0 and 1, which has a monotonic relation to
speech quality.
Literature Review
2.4.1
Previous Research on Perceptual Metrics
Very few studies have investigated the application of objective, perceptually-relevant
speech intelligibility and quality indices for hearing aid applications. Falk et al. [19]
reviewed the performances of 12 different objective metrics of speech intelligibility and
quality that were assessed and compared for different datasets collected in different
environmental conditions for both hearing aid and cochlear implant applications. Seven
of these metrics were intrusive and five were non-intrusive. Their performance was
measured based Pearson’s correlation coefficient, Spearman rank correlation, and Root
Mean Square Error (RMSE) between predicted and true subjective data. It was seen that,
for cochlear implant devices, STOI (intrusive) and SRMR-CI (nonintrusive) performed
best. For hearing aids with speech enhancement enabled, the HASQI, PEMO-Q-HI, and
ModA metrics performed best.
More recently, Kates et al. [20] benchmarked the noise reduction algorithms in
commercial hearing aids using the HASPI and HASQI metrics. As mentioned before,
HASPI and HASQI are promising objective metrics as they have been shown to correlate
with behavioral data from hearing impaired listeners. However, the subjective validation
experiments were limited to simulated hearing aids, and this paper [20] was the first one
to apply these indices to real hearing aids. In this paper, several hearing aids from
different manufacturers, in different noise and signal processing conditions were tested.
A statistical analysis was performed on the extracted indices, to see which conditions
influence the HASPI and HASQI scores most. It was found out that HASPI and HASQI
metrics can differentiate between processing conditions, i.e. they are sensitive to changes
in these conditions. This thesis builds on these initial findings and expands them to
PSAP testing, as more research was suggested to take benefit of these metrics in clinical
applications.
2.4.2
Previous Research on Noise Reduction
Since one of the objectives of this thesis is benchmarking the noise reduction
[21] reviewed the history of noise reduction algorithms in hearing aids, including the
development of noise reduction algorithms from the era of analog hearing aids to the
present day. Bentler and Chiou [21] discuss the evidence behind the effectiveness of
noise reduction algorithms and, with various examples, demonstrate the differences in
various parameters such as the amount of noise reduction, the attack and release times,
and the threshold SNR for activation of noise reduction across various hearing aids.
Given the variability in performance across different hearing aids, this paper also stressed
the need for verification of noise reduction algorithms in hearing aids for the patients
wearing them. The difference in noise reduction performance across different hearing
aids is also highlighted in the following two articles. Brons et al. [22] evaluated the
perceptual effects of the noise reduction feature in three different hearing aids with
twenty hearing impaired listeners. Subjective outcome measures were speech
intelligibility, noise annoyance, and listening effort when the noise reduction was
activated. Results showed that the noise reduction algorithms performed differently, with
one noise reduction algorithm significantly reducing speech intelligibility. Scollie et al.
[23] proposed a verification protocol for assessing noise reduction in hearing aids. This
study analyzed the noise reduction performance of four different hearing aids and
reported that these brands differed in their engagement times for the noise reduction
algorithms, the amount of noise reduction for different noise signals, and the variability
in the noise reduction amount when “noise only” or “speech + noise” signals were used
as the test signals. Given this variability, it is imperative to assess the noise reduction
performance with both noise only, and speech + noise signals; an option that is not
currently available in clinical hearing aid test systems.
2.4.3
Previous Evaluation of PSAPs
Since PSAPs have the benefit of affordability as compared to hearing aids, the testing of
their performance is important. It is critical to know how suitable the PSAPs are for
different hearing losses and how is their performance when they best suit an audiogram.
As such, PSAP performance characteristics have been investigated in the past in diverse
ways. In Smith et al. [24] paper, seven PSAPs and four hearing aids were compared. The
such as the Equivalent Input Noise (EIN), Output SPL (OSPL90), Total Harmonic
Distortion (THD), and directionality were obtained. They were matched to the NAL-NL2
fitting targets generated for 10 standard audiograms [25]. Results from this research shed
light on the problematic nature of FDA regulation: some high-end PSAPs performed
better than some low-end hearing aids [24]. In Cheng and McPherson’s paper [26], 10
over-the-counter (OTC) hearing aids were tested to determine which target client groups
they best fit to. ANSI measures were obtained, and the OTC hearing aids were fitted to 4
prescriptive targets. Subjective testing was also performed on 10 subjects. It was found
that OTC hearing aids mostly provide high low-frequency gain and they are not suitable
for high-frequency losses (‘presbycusis’), present in elderly people [26]. In Callaway and
Punch’s article [27], eleven OTC hearing aids were tested for 3 common audiograms.
The OTC hearing aids were divided into 2 groups: low range and high range. For the low
range, ANSI measures were obtained electroacoustically and for the high range, technical
specifications were made use of. It was found that the low-range devices were not able to
meet the prescriptive targets and their electro-acoustic performance was also not
satisfactory. The mid-range devices performed better [27].
It must be noted that prior electroacoustic evaluations of PSAPs did not incorporate
perceptually-relevant metrics such as HASPI and HASQI. In addition, the amount of
noise reduction and the dynamic properties of the noise reduction algorithms in PSAPs
has not been explored. This thesis addresses these gaps in the literature by
comprehensively assessing PSAPs not only through the standardized electroacoustic
measures, but also through measures of noise reduction, attack and release times, and
Chapter 3
3
Testing Hearing Aids
Test Sequence
For efficiently computing the objective predictors of speech intelligibility and quality
from the output of hearing aids (and later PSAPs), a custom test sequence was developed.
This test sequence also allows for the assessment of time constants associated with noise
reduction and facilitates the estimation of some of the quality control measures specified
in the hearing aid and PSAP standards. This custom test sequence is a concatenation of:
• ‘Speech in quiet’ for 30 seconds • ‘Noise Signal’ for 30 seconds
• ‘Inverted Speech in quiet’ for 30 seconds • ‘Speech + Noise’ for 30 seconds
This test sequence is the modification of a test sequence that was previously developed at
the NCA. This previously developed test sequence was a concatenation of 5 segments:
• ‘Speech in quiet’ for 30 seconds • ‘Noise Signal’ for 40 seconds
• ‘Inverted Speech in quiet’ for 30 seconds • ‘Speech + Noise’ for 40 seconds
• ‘Speech – Noise’ for 20 seconds
As can be seen, the lengths of the second and fourth segment are shortened in the new
test sequence, while the fifth segment is altogether removed. It was reasoned that the first
and fourth segment need not be that long, because 30 seconds is enough time to see the
effects of noise reduction feature in hearing aids and get the related parameters. The fifth
segment was present in the previous test sequence, to separate speech and noise using
phase inversion technique. But this technique does not work for non-linear hearing aids,
and therefore was removed from the new test sequence.
The speech signal utilized in the test sequence is the International Speech Test Signal
desired SPL and SNR values. In this thesis, two types of noise were used: stationary
speech-shaped noise (SSN) and non-stationary multi-talker babble (MTB). The first
segment of this new test sequence (i.e., ‘speech in quiet’) was used to get the third-octave
spectrum, frequency response bandwidth, frequency response smoothness, and internal
noise measures for the hearing aids. In addition, this segment served as the reference
signal for HASPI, HASQI, and STOI calculation. The second segment (i.e., noise-only)
was used to measure the ‘attack time’ (in seconds) and the ‘amount of noise reduction’
(in dB) for the noise reduction algorithm in the hearing aids. This second segment can
also be used to assess the accuracy of automatic program switching (from “quiet” to
“noise” program) in hearing aids. The third sequence, because it is present after the noise
segment, was used to obtain the ‘release time’ for the noise reduction feature, after
comparison with the ‘clean speech segment’. Since the third segment is the phase
inverted copy of the first segment, linear combination of the hearing aid response to these
two segments will give an estimate of the internal noise. Finally, the last ‘speech + noise’
segment was used to estimate the ‘output SNR’ after separating speech and noise. In
addition, the response of the hearing aid to the last segment was employed as the ‘target,
processed signal’ for STOI, HASQI, and HASPI calculations.
Experimental Setup
The custom test sequence was delivered to the hearing aids using a desktop test box
experimental setup, the block diagram of which is shown in the figure below:
The experimental setup consists of two paths for the signal: playback and recording.
Playback occurs first followed by the recording path. In the playback path, the custom
digital test sequence is converted to its analog form through the USBPre-2 external sound
card. Then, this analog signal passes through the TDT attenuator which adjusts its level
and routes it to the speaker in the Brüel & Kjær type 4232 test box. The test box consists
of a reference microphone and a coupler microphone to which a hearing aid is connected
through a 2-cc coupler, as shown in figure 3.2. The hearing aid microphone and the
reference microphone are placed at the same distance from the speaker in the test box, so
that the same sound enters them. When the test sequence gets played, the reference
microphone and the hearing aid pick up the sound, which is then passed through separate
channels to the Nexus conditioning amplifier which provides the necessary amplification
to the incoming signals. The amplified signals are digitized by the USBPre-2 external
sound card and stored in the desktop computer. The data acquisition for this study
operated at a sample rate of 44100 Hz and 16 bits per sample.
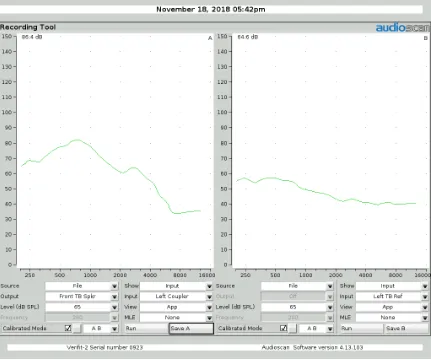
For getting the internal noise parameter, the recordings for the hearing aids were taken in
the Verifit-2 test system, because it is possible in that system to play nothing and obtain
the recordings. Also, the recordings for the PSAPs were taken in this Verifit-2 system
(which is explained in the next chapter).
The Verifit-2 system is a hearing instrument verification system, developed by
Audioscan. It can be used by audiologists and other hearing health care professionals to
know the electroacoustic properties of a hearing aid before prescribing it to the patient.
The Verifit-2 system is shown in figure 3.3 below. For this thesis, we made use of the
Speechmap tool in the system, to see how well the PSAPs fit to the audiogram targets,
and we also made use of the recording tool, to obtain recordings for hearing aids and
PSAPs at different conditions, which were used to obtain the values of required
parameters.
MATLAB GUI
A custom MATLAB Graphical User Interface (GUI) was developed using the App
Designer tool in MATLAB which automated the playback and recording of the custom
test sequence, and the calculation of the electroacoustic performance indices. As shown
in figure 3.4, the GUI has input fields for the test conditions (e.g., input signal level, type
of background noise, and input SNR). In addition, it receives information from the
audiogram, the real ear to coupler difference (RECD), and the real ear aided gain
(REAG). These frequency specific values are required for the computation of the HASQI
and HASPI values. Clicking on the “Record and get parameters” button dynamically
creates the custom test sequence, delivers it through the test box loud speaker at the
specified level, records the ensuing hearing aid response, automatically segments the
recorded signal and computes the parameters. The computed parameters are displayed on
the GUI as shown in figure 3.4. In addition, the recorded hearing aid output is stored as a
wave file on the hard disc to contribute towards a database of hearing aid recordings.
Hearing Aids Tested
Hearing aids from 5 different manufacturers (Siemens, Phonak, Unitron, Starkey, and
Bernafon) were tested. The Siemens hearing aid has 2 programs: 1 for quiet mode and 1
for noisy mode (showing noise reduction). The Phonak hearing aid has 5 programs: the
first one does not show noise reduction, while others show different degrees of noise
reduction (which increases from second to fifth program). The Unitron hearing aid has 3
programs: the second is noise reduction off and the third is noise reduction on. Starkey
and Bernafon have 2 programs each: 1 is noise reduction off and the second is noise
reduction on. For the Unitron hearing aid, two models (basic and premier) were tested.
The hearing aids can be programmed to any of the standard audiograms given in the table
below:
Table 3.1 : Standard audiograms [25]
Hearing Aid Parameter Computation
In this section are defined various parameters of hearing aids and the methods used to
As mentioned before, some of them had noise reduction feature ‘ON’ and some had noise
reduction feature ‘OFF’.
3.5.1
Attack Time and Release Time
Attack time is the time taken by the noise reduction algorithm of a device to activate after
the start of noise. Release time is the time taken for the noise reduction algorithm to
deactivate after the removal of noise. Attack time is measured by dividing the recorded
noise data into frames of length 0.1 seconds (only the second segment of the recording is
divided into frames). For the last 5 seconds of these data divided into frames, we obtain
their dB value, which is the steady state value, and to which we compare the initial
frames. Knowing the frames for which the dB value is within 3 dB of the steady state
value, we get the attack time. For the release time, the third segment of the recorded data
is divided into frames and their dB value is compared with the dB value of the first
segment of the recorded data. Knowing the frames for which the dB values reach within 1
dB of the first segment, we calculate the release time. This procedure is similar to the
definition of attack and release times for the automatic gain control algorithms by the
ANSI Standard, 2009 [11]. Attack and release times were measured for both noises:
speech shaped and multi talker babble.
3.5.2
Processing Delay
Processing delay is the time lag between the hearing aid output and hearing aid input. It
was measured by taking the cross-correlation between the hearing aid output and the
reference microphone output. The lag at which the cross-correlation is maximum was
taken to be the processing delay. This delay was also used in the extraction of the four
segments from the hearing aid output for aligning the output segments. Also, a delay
called the ‘DAQ’ delay was obtained by taking the cross-correlation between the input
(signal before playback) and the hearing aid output. This was the delay of the complete
data acquisition system, from the moment the playback was initiated through MATLAB
and the recording was acquired from the hearing aid. The ‘DAQ’ delay was also used in
3.5.3
Amount of Noise Reduction
Amount of noise reduction was measured in MATLAB for the noise-only segment of the
hearing aid output signal. It was measured for speech shaped noise and multi talker
babble for all the hearing aids.For the case of speech shaped noise, the samples that
corresponded to the first 5 seconds of the noise data were taken and compared with the
last 5 seconds (steady state) of the noise output. For comparison, the third-octave spectra
of the initial data and steady-state data were measured. The third-octave range of
frequencies was reduced to take the third-octave bands with center frequencies between
250 Hz to 4000 Hz. Then the difference of the third-octave spectra gave the noise
reduction vector that contained noise reduction values for all the bands. After that, the
bands were grouped into 3 categories: low frequency bands, mid frequency bands, and
high frequency bands. The average of noise reduction scores was taken in all three bands
which were then summed to obtain an overall noise reduction score. For the case of
multi-talker babble, the last 5 seconds of the noise output from the hearing aid for the
programs that had noise reduction were compared to the last five seconds of the program
that did not have noise reduction. The process of comparison was the same as that for
speech shaped noise.
3.5.4
STOI
STOI was defined in the section 2.3.1.It is an intrusive metric that provides a score that
has a monotonically increasing relation with the intelligibility of the noisy, processed
speech that is being tested. The 2-minute test sequence described earlier, was played in
the desktop test box and recorded through the hearing aid. From the recordings, the last
five seconds (steady state) of the first segment (speech) and the fourth segment (speech +
noise) was fed into the ‘STOI’ MATLAB function, which also takes the sampling
frequency as an input. The signals were time-aligned prior to being fed into the ‘STOI’
function. This ‘STOI’ function compares the two signals based on a correlation
coefficient. First the one-third octave spectrum of the two signals is taken. Then, they are
segmented into frames and compared after normalization and clipping. After comparison,
intelligibility is obtained. STOI was measured for both noise cases: speech shaped and
multi talker babble and for input SNRs of 0 dB and 5 dB.
3.5.5
Objective SNR
For estimating the output SNR, the ‘speech + noise’ segment of the hearing aid output
was broken up into frames and the FFT of those frames was taken. The result was
squared to get the power spectrum of the segment. This power spectrum was fed into a
Minimum Mean Squared Error (MMSE) based noise estimation function which estimates
the underlying spectrum of the noise. This noise spectrum was subtracted from the
combined spectrum of ‘speech + noise’ to get an estimate of speech spectrum. The
objective output SNR was calculated as the average difference in dB between the
estimated speech and noise spectra, which was measured for both 0 dB and 5 dB input
SNRs for the hearing aids.
3.5.6
HASPI and HASQI
HASPI is Hearing Aid Speech Perception Index and was described in the section 2.3.2. It
is an intrusive metric, i.e. it requires a reference to which the target signal is compared to.
It makes use of an envelope measure and a cross-correlation measure to compare the two
signals. The reference signal is passed through a model of normal hearing and the target
signal is passed through a model of impaired hearing before they are compared. It must
be noted that the target signal is the hearing aid output recording which was transformed
to the real ear using the RECD values. Prior to the computation of HASPI, the reference
and target signals are time aligned using the cross-correlation method and properly scaled
to represent their sound level. The HASPI MATLAB routine takes as input the reference
and target signals, the two frequencies at which these signals are sampled, the audiogram
indicating the hearing loss, and the input levels. The output is the predicted intelligibility
score between 0 and 1. A similar procedure was followed for the HASQI computation,
except for one difference. The reference signal for the HASQI procedure is filtered using
the REAG values. Thus, the reference signal is frequency-shaped to match the targets for
value between 0 and 1, with 0 representing poor speech quality and 1 representing
excellent speech quality.
3.5.7
Internal Noise Floor
This parameter represents the noise present inside the device. In other words, the noise
that is present in the hearing aid output that is not there in the input. For this
measurement, the first step of taking the recording was not done in the desktop test box,
but in the Verifit 2 hearing aid test system. We played nothing (‘none’ as source) in the
Verifit 2 System and reasoned that whatever is the output should be very close to the
internal noise on which the frequency response of the hearing aid has been applied. The
output at the reference channel should give the system noise, i.e. the noise present in the
measurement system. The hearing aid frequency response was normalized using the
linear prediction (LP) method, and the level of the LP residual minus the system noise
gave the value of the device internal noise.
3.5.8
Repeatability
Recordings were made multiple times. For every HA, for each set of conditions, 5
different recordings were taken. Values of the parameters were obtained using these 5
recordings. For all the 5 values for a set of conditions, the mean and standard deviation of
the values was measured and represented in the form of error bars on the parameter
Results
3.6.1
Comparison of Hearing Aid Parameters
Figure 3.5 : Attack time (in seconds) for the case of speech shaped noise and
multi-talker babble.
It can be seen that the attack time for hearing aids is between two and nine seconds. For
Siemens, Starkey, and Bernafon hearing aids, attack time is high for the case of speech
shaped noise. In general, attack times are low for the Unitron and Phonak hearing aids.
For the case of multi talker babble, the procedure to compute the noise reduction attack
time had to be modified. Because of the shape of the output of the hearing aid as a
response to the multi talker babble in the noise segment, we cannot use the same
procedure, i.e. we cannot compare the steady state of the noise segment to the initial part
of noise segment. This is explained in Figures 3.6 and 3.7 where the difference in the
hearing aid output for the noise portion (the second segment of the test sequence) is
apparent between the speech shaped noise and multi talker babble. The method to
measure attack time for speech shaped noise compares the initial part of the noise
segment to the later part, but as can be seen from these figures, this cannot be done for
the case of multi talker babble due to the non-stationarity of the multi-talker babble. 0 1 2 3 4 5 6 7 8 9 10
Siemens Starkey Unitron Basic Unitron Premier Bernafon Phonak Se con d s
Attack time (seconds)
Figure 3.6 : Hearing aid output to the test sequence for speech shaped noise
Thus, for the multi talker babble case, the noise segment outputs corresponding to the
adaptive noise reduction (ANR) ON and ANR OFF hearing aid settings. This is shown in
Figure 3.8, where frame-by-frame root mean square (RMS) values of the hearing aid
during the noise-only segment are plotted. The time after which the difference in the
noise level of the initial segments of the two programs reaches to within 3 dB of the
difference at steady state is the attack time in seconds.
Figure 3.9 : Release time (in seconds)
As can be seen from the Figure 3.9 above, Siemens hearing aid shows higher release
times, as compared to other hearing aids. For all other hearing aids, the release times are
less than 1 second. For the Phonak hearing aid, release times are as low as 0.1 second,
indicating that the hearing aid quickly turns of the noise reduction when background
noise ceases to exist.
Figure 3.10 : STOI Values (Speech Shaped Noise) 0 0.2 0.4 0.6 0.8 1 1.2 1.4 1.6
Siemens Starkey Unitron Basic Unitron Premier Bernafon Phonak Se co n d s
Release Time (in seconds)
0dB_SSN 5dB_SSN 0dB_MTB 5dB_MTB
0 0.1 0.2 0.3 0.4 0.5 0.6 0.7 0.8 0.9
Siemens Starkey Unitron Basic Unitron Premier
Bernafon Phonak
ST
OI
Scores
STOI Values (SSN)
STOI Values for the case of speech shaped noise are higher for 5 dB input SNR than 0
dB input SNR, which is expected. For most hearing aids there was an improvement in the
STOI values with the activation of the noise reduction algorithm. For 0 dB input SNR
case, STOI values are between 0.6 to 0.7 and for 5 dB input SNR, they are between 0.7 to
0.8.
Figure 3.11 : STOI values (multi talker babble)
Figure 3.12 : HASPI values (speech shaped noise) 0 0.1 0.2 0.3 0.4 0.5 0.6
Siemens Starkey Unitron Basic Unitron Premier
Bernafon Phonak
H
ASPI
Scores
HASPI Values (SSN)
0dB_Off 5dB_Off 0dB_On 5dB_On 0 0.1 0.2 0.3 0.4 0.5 0.6 0.7 0.8 0.9
Siemens Starkey Unitron Basic Unitron Premier Bernafon Phonak ST OI Scores
STOI Values (MTB)
STOI values for the case of multi talker babble are higher for 5 dB input SNR than 0 dB
input SNR, which is expected. Similar to the speech shaped noise results, the STOI
values are higher for ANR ON as compared to ANR OFF, which is also expected. For 0
dB input SNR case, STOI values are between 0.55 to 0.65 and for 5 dB input SNR, they
are between 0.65 to 0.75.
Figure 3.13 : HASPI values (multi talker babble)
HASPI values are high for 5 dB input SNR and for ANR ON condition. If both
conditions are there, HASPI values are highest. The effect of input SNR in increasing the
HASPI values is a bit more than the effect of noise reduction feature. 0
0.1 0.2 0.3 0.4 0.5 0.6 0.7
Siemens Starkey Unitron Basic Unitron Premier
Bernafon Phonak
H
ASPI
Scores
HASPI Values (MTB)
Figure 3.14 : Amount of noise reduction (dB) for speech shaped noise
Hearing aids show high values of noise reduction when the noise reduction feature is ON.
The noise reduction values are as high as 44 dB for the Unitron hearing aids.
Figure 3.15 : Amount of noise reduction (dB) for multi talker babble 0 5 10 15 20 25 30 35 40 45
Siemens Starkey Unitron Basic Unitron Premier Bernafon Phonak De cibels (d B)
Amount of Noise Reduction (dB) for Multi Talker
Babble
0dB_On 5dB_On 0 5 10 15 20 25 30 35 40 45 50Siemens Starkey Unitron Basic Unitron Premier
Bernafon Phonak
De
cibels
Amount of Noise reduction for SSN (decibels)
For the case of multi talker babble, noise reduction values are lower for Siemens and
Phonak hearing aids, and comparable for other hearing aids, with Starkey showing the
highest noise reduction for 0 dB input SNR.
Figure 3.16 : Output SNR (dB) for speech shaped noise
Figure 3.17 : Output SNR (dB) for multi talker babble
Both, the high values of input SNR and the noise reduction feature being ON, have a
tremendous positive effect on the values of output SNR. -5 -4 -3 -2 -1 0 1 2 3 4 5 6
Siemens Starkey Unitron Basic Unitron Premier
Bernafon Phonak
De
cibels
Output SNR (SSN)
0dB_Off 5dB_Off 0dB_On 5dB_On
-2 0 2 4 6 8 10
Siemens Starkey Unitron Basic Unitron Premier
Bernafon Phonak
De
cibels
Output SNR (MTB)
Figure 3.18 : Processing delay (in milliseconds)
Hearing aids, being, digital systems, show a little processing delay (5-7.5 ms). There is
not much difference in the delay, among the hearing aids.
Figure 3.19 : Internal noise floor (dBA)
This figure shows the internal noise values for the conditions of ANR ON and ANR OFF
for the 5 hearing aids obtained using the method of ‘lpc_estimate’. The Siemens hearing
aid shows low values of internal noise, while it is comparable for other hearing aids. 0 1 2 3 4 5 6 7 8
Siemens Starkey Unitron Basic Unitron Premier Bernafon Phonak M ill isec o n d s
Processing Delay (milliseconds)
0 10 20 30 40 50 60 70
Siemens Starkey Unitron Basic Unitron Premier
Bernafon Phonak
d
BA
IN Floor (dBA)
Figure 3.20 : HASQI values (speech shaped noise)
Figure 3.21 : HASQI values (multi talker babble)
HASQI values for hearing aids are given in figures 3.20 and 3.21. The increase in the
input SNR causes an improve in the HASQI values and the noise reduction feature being
‘on’ also has a positive effect on the HASQI values. 0 0.1 0.2 0.3 0.4 0.5 0.6 0.7 0.8
Siemens Starkey Unitron Basic Unitron Premier Bernafon Phonak H ASQI Correl at ion Scores
HASQI Cepstral Correlation Values (SSN)
0dB_Off 5dB_Off 0dB_On 5dB_On
0 0.1 0.2 0.3 0.4 0.5 0.6 0.7 0.8
Siemens Starkey Unitron Basic Unitron Premier Bernafon Phonak H ASQI Correl at ion Scores
HASQI Cepstral Correlation Values (MTB)
Chapter Summary
In this chapter, the test sequence developed to test hearing aids and PSAPs is described.
Also, the test apparatus and the method to electroacoustically test the hearing aids is
described. Results for parameters are shown and these were the key findings:
• Hearing aids from different manufacturers show comparable performance across all the parameters.
• Hearing aids show good STOI, HASPI and HASQI scores.
• STOI, HASPI and HASQI scores improve when noise reduction feature is ON and when input SNR is high. Both conditions have a positive effect on the scores
of the perceptual indices.
• Hearing aids show significant amount of noise reduction when their noise
reduction program is ON.
• It was seen that for all the parameters, there was not much variation among the 5
replicated values, i.e. the standard deviation was very low among the 5 values for
Chapter 4
4
Testing of PSAPs
As discussed earlier, PSAPs are purchased as the other potential remedy for hearing loss,
even though they are designated as non-treatment solution for hearing loss by the FDA.
PSAPs are available over-the-counter or through online retailers and are less expensive
compared to hearing aids. Low-end PSAPs are typically sound amplifiers with no
dedicated signal processing or features such as wide dynamic range compression
(WDRC), directionality, and noise reduction. There are many companies that
manufacture PSAPs such as Banglijian (BLJ – 109, ZIV – 201), NewEar, and MedCa.
Low-end PSAPs are available for about $ 15 to $ 100 while the high-end are
approximately $100 to $ 500. Sample PSAP prices are shown in Table 4.1. Some of
these PSAPs are marketed as “FDA approved” and advertise noise reduction capabilities.
Due to their popularity and to increase consumer awareness on their performance, this
thesis undertook a comprehensive evaluation of PSAPs. The PSAP ‘Otofonix-elite’ given
in Table 2 is a high-end PSAP, while the others are low-end.
Table 4.1 : PSAPs Price Chart
Description of PSAPs
Five PSAPs were tested comprehensively in this thesis. Four of them were low-end
PSAPs (low-priced in Table 4.1), and the fifth one was a high-end PSAP (mid-priced in
Table 4.1). One of the PSAPs was in the behind-the-ear (BTE) form factor with ear hook
NewEar5 Hearing Amplifier, LYB-44), or utilized a tube with a dome to deliver the
sound (Otofonix-elite). The PSAP ‘ZIV – 201’ from ‘Banglijian’ is marketed as “FDA
approved” and advertises two programs. The first one is the ‘noise reduction’ mode
program and the second one is the normal mode program, according to the specifications
provided with the PSAP. Both the programs were tested. The Otofonix-elite had four
programs, out of which the first two were tested. The first one is the ‘quiet’ mode, while
the second one, is the ‘noise reduction’ program.
Methodology
There were a few methodological differences between hearing aid testing described in
Chapter 3 and the PSAP testing described in this Chapter. The hearing aids tested in
Chapter 3 were all BTEs with ear hooks that connected to the 2-cc coupler in the Brüel &
Kjær test box. However, due to the variability in the PSAP form factors discussed above,
PSAP recordings were collected in the clinically available Verifit-2 system from
Audioscan. Figure 4.1 displays the positioning of a PSAP in the Verifit-2 test box. The
stimulus was delivered from the front speaker and the PSAP response together with the
reference microphone response were collected as explained next.
![Figure 1.1 : Structure of the human ear. [1]](https://thumb-us.123doks.com/thumbv2/123dok_us/1941301.1255250/13.612.113.480.98.417/figure-structure-human-ear.webp)