ABSTRACT
MAUDLIN, LINDSAY CATHERINE. An Evaluation of a Climate Decision Support System: An Eye-Tracking Study. (Under the direction of Dr. Karen S. McNeal and Dr. Walter A. Robinson).
A web-based climate decision support system (DSS) designed for foresters in the
Southeast United States was evaluated to measure the overall DSS usability and to determine if
user characteristics (e.g., age, gender, education) impact usability. This was accomplished by
asking users to navigate through the web-based climate DSS to complete tasks and answer
multiple choice questions about the climate information they interact with. They were also asked
for basic demographic information and about their experiences using climate information. The
evaluation utilized eye tracking, a technology that determines where, when, and for how long a
user fixates or focuses attention on a particular element on a computer screen. Eye-tracking data
can provide insight into the paths users take to complete the tasks and answer the questions,
which website design elements are most salient, and which elements are never viewed. The data
were collected in two phases: the first was exploratory and prompted changes to be made to the
DSS, and the second aimed to determine how those changes influenced the usability of the DSS.
This work explores three main areas: the differences between males and females; the differences
between experts and novices; and how the usability of the web-based climate DSS changed
between the two data collection phases.
Males and females demonstrated different eye-tracking patterns throughout the study. In
general, males tended to focus their attention on the maps and climate data, while females tended
to focus more attention on other elements of the DSS such as buttons that could be toggled off
and on, color bars, and text boxes. Additionally, when females did look at the maps and climate
the related questions. This then impacted their success in answering the questions correctly.
Overall, males answered more questions correctly than did females, likely because males were
looking at the relevant data.
In this study, experts were defined as forestry professionals and novices were defined as
undergraduate students. The expected expert-novice differences (e.g., experts answered more
questions correctly) were convoluted by the influence of age on DSS usability. The expert
population had a higher average age than the novice population, and they also performed worse
than the novices. This unexpected results is likely due to the impact of age on website usability.
In addition, experience using climate data was not an accurate predictor of performance. The
lowest performers had experience using climate data, and not all of the highest performers did.
While there were some differences in the eye-tracking patterns between experts and novices in
this study, likely due to experience and content expertise, age was the most important factor in
the eye-tracking data.
The usability changed between the two phases of the study. In general, the efficiency
improved after changes were made to the DSS. The overall effectiveness decreased, with an
exception where users in the second phase out-performed those in the first phase during one part
of the study. This unexpected finding suggested users might have been cognitively overloaded,
© Copyright 2018 by Lindsay C. Maudlin
An Evaluation of a Climate Decision Support System: An Eye-Tracking Study
by
Lindsay Catherine Maudlin
A dissertation submitted to the Graduate Faculty of North Carolina State University
in partial fulfillment of the requirements for the degree of
Doctor of Philosophy
Marine, Earth, and Atmospheric Sciences
Raleigh, North Carolina
2018
APPROVED BY:
_______________________________ _______________________________ Dr. Karen S. McNeal Dr. Walter A. Robinson
Committee Co-Chair Committee Co-Chair
ii
DEDICATION
To my grandparents, Earl, Kathy, Pete, and Velma.
iii
BIOGRAPHY
Lindsay C. Maudlin was born and raised in Hutchinson, Kansas. She loved weather from
a young age, but she also loved animals and wanted to be a veterinarian when she grew up. Her
dreams changed as she learned more about meteorology and the possible career paths in that
field, and by the end of her freshman year of high school, Lindsay had decided to become a
meteorologist. After high school, Lindsay went to Hutchinson Community College where she
earned an Associate in Arts and then transferred to The University of Oklahoma where she
earned her Bachelor of Science in Meteorology. During her undergraduate years, Lindsay studied
abroad at Monash University in Australia, where she developed an interest in atmospheric
chemistry. This interest led her to The University of Arizona where she earned her Master of
Science in Atmospheric Science and completed one year of the PhD program while conducting
research on the physicochemical properties of atmospheric aerosols through fieldwork and
instrumentation. During the first year of her PhD, Lindsay was also a fellow in the NSF GK-12
program. She was paired with a gifted education teacher and developed and taught various
STEM lesson plans for 5th and 6th grade students. This experience was an opportunity for
Lindsay to develop her teaching skills, and it also introduced her to education research,
ultimately leading her to North Carolina State University to complete her PhD in Atmospheric
Science with a research focus on Geoscience Education Research and Geocognition.
In addition to her academic pursuits, Lindsay has continued to pursue ballet and
long-distance running. She also enjoys reading, music, traveling, hiking, and being a cat mother to a
iv
ACKNOWLEDGMENTS
I am the product of a public school education, kindergarten through PhD, and also the
recipient of state and federal funding for my graduate studies. I am a testament to the good that
adequate funding for public schools and science can do, and I know that I would not be here if
not for such funding. As such, I would like to thank the taxpayers who have made this possible.
Along my public school journey, I had many wonderful teachers and professors who
taught, encouraged, and mentored me. A few in particular were especially influential in my
journey:
John Brown, Hutchinson High School
Rusty Hilst, Hutchinson High School
Jake Miller, Hutchinson High School
Lynn Anderson, Hutchinson Community College
Dr. Mike Biggerstaff, The University of Oklahoma
Dr. Ave Arellano, The University of Arizona
Dr. Liz Ritchie, The University of Arizona
Dr. Randy Richardson, The University of Arizona
During my time at The University of Arizona, I spent a fair amount of time in K-12
classrooms through various science outreach activities, as a GK-12 Fellow, and as an instructor
for a weather and climate summer camp. Four teachers generously shared their classrooms and
students with me, and I am grateful for the lessons they taught me:
Michele Thelen
Beth DeWeerdt
v Shari Popen
My former students and my future students have been an endless source of motivation to
earn my PhD. Teaching has been the best part of my graduate school experience, and I cannot
wait to teach again.
My graduate studies at NCSU have been funded by the Southeast Climate Adaptation
Science Center’s Global Change Fellowship and the Provost’s Fellowship. These fellowships
have allowed me to focus on and complete my research on a shorter than usual timeline.
In addition to funding my graduate studies, the Southeast Climate Adaptation Science
Center and its staff have provided me with opportunities to meet and get to know graduate
students from other departments, attend and organize seminars, and participate in various
stakeholder meetings, all of which have grown my professional networks and helped me forge
new friendships.
The Marine, Earth, and Atmospheric Sciences staff have saved the day on many
occasions, but two women in particular have been instrumental in my success:
Jackie Sullivan
Meredith Henry
My graduate advisors and PhD committee members have been influential in my growth
as a scientist, and I am grateful for their guidance, encouragement, and wisdom:
Dr. Armin Sorooshian, The University of Arizona, MS Committee Chair
Dr. Karen S. McNeal, Auburn University, PhD Committee Co-chair
Dr. Walter A. Robinson, North Carolina State University, PhD Committee Co-chair
Dr. Ryan Boyles, Southeast Climate Adaptation Science Center, PhD Committee
vi Dr. Nicole Lee, North Carolina State University, PhD Committee Member
My peers and academic siblings have commiserated with, taught, and encouraged me
throughout my graduate school years. I am grateful for the late night study sessions, coffee runs,
distractions, laughs, and sometimes tears shared with them. I’ve enjoyed the friendships that
formed as a result of these experiences, particularly those with Taylor Shingler and Nick Soltis
who have been the best academic siblings and friends I could have asked for.
As I walked through the desert that has been my last three years, God has provided for all
my needs and parted the Red Seas in my life by placing particular people along my path. As I
have personally experienced Ecclesiastes 12:12, which states, “Of making many books there is
no end, and much study is a weariness of the flesh,” I have been encouraged by many people, but
there are a few I’d like to mention in particular:
My Medora, North Swan, and Providence families
My run club friends: Amber Rhyne, Allen Boone, and Brandon Andrews
My clothespins and fellow ALA SGS staff: Rachel Barnes, Jackie Paschang, Heather
Williams, Liz Woody, Amy Stotts, and Stacy Edwards
The Mikes: Mike Madden and Mike Pirhalla
Fellow OU Alumni: Stefan Rahimi and Stephen Castleberry
My dearest high school friends: Tara Jones, Cindy Mood, Lauren Edwards, and
Bianca James
My best friends and their families: The Silsbees, Warnkens, and Hemmans
My family
vii The six most important people responsible for getting me here through their
unconditional love, support, sacrifices, collective wisdom, and top-notch genetics are Craig,
Linda, Earl, Kathy, Pete, and Velma. I would not be where I am now if not for their positive
viii
TABLE OF CONTENTS
LIST OF TABLES... x
LIST OF FIGURES ... xi
Chapter 1: Introduction... 1
Literature Review ... 1
Motivation and Research Questions ... 4
Methods ... 5
PINEMAP DSS ... 5
Study Design and Populations ... 6
Eye-tracking Specifications and Analyses ... 7
Questionnaire, Tasks/Questions, and Object Slicing Test Analyses ... 9
Statistical Analyses... 9
Limitations ... 10
Validity ... 10
Chapter Descriptions ... 11
Gender Differences... 11
Expert-Novice Differences ... 11
Usability ... 11
References ... 12
Chapter 2: Website Usability Differences between Males and Females: An Eye-tracking Evaluation of a Climate Decision Support System ... 17
Capsule ... 17
Abstract ... 17
Main Text ... 18
Study design and populations ... 19
Differences between males and females ... 22
Implications for future climate decision support systems ... 25
Sidebar: Eye Tracking ... 25
Sidebar: Gender Differences ... 27
References ... 29
Chapter 3: The Role of Expertise on the Usability of a Climate Decision Support System 37 Abstract ... 37
Introduction ... 37
Methods ... 40
Study Design ... 40
Study Populations ... 41
PINEMAP DSS ... 42
Eye Tracking ... 42
Additional Data... 43
Limitations ... 44
Validity ... 45
Results and Discussion ... 45
ix
References ... 49
Supplemental: Tasks and Multiple Choice Questions ... 60
Task: Explore Historical Information ... 60
Task: Explore Projected Change Information ... 60
Task: Explore Projected Average Information ... 61
Task: Explore Time Series Plots ... 61
Task: Explore Projected Temperatures ... 62
Task: Explore a Temperature Range ... 63
Supplemental: Questionnaires ... 63
Phase 1 ... 63
Phase 2 ... 64
Chapter 4: Usability of a Web-based Climate Decision Support System ... 66
Abstract ... 66
Introduction ... 67
Methods ... 69
Study Design ... 69
Study Populations ... 69
Climate DSS ... 70
Tasks and Questions ... 71
Eye Tracking ... 71
Analyses ... 72
Limitations ... 72
Validity ... 72
Results and Discussion ... 73
Phase 1 and Phase 2 Differences ... 73
High and Low Performers ... 73
Finding DSS Features... 75
Conclusion and Future Work ... 76
References ... 78
Chapter 5: Conclusion ... 88
Summary of Key Findings ... 88
x
LIST OF TABLES
Table 1.1 Research questions, the population, eye-tracking metrics, other data, and
analyses used to answer the questions. ... 16
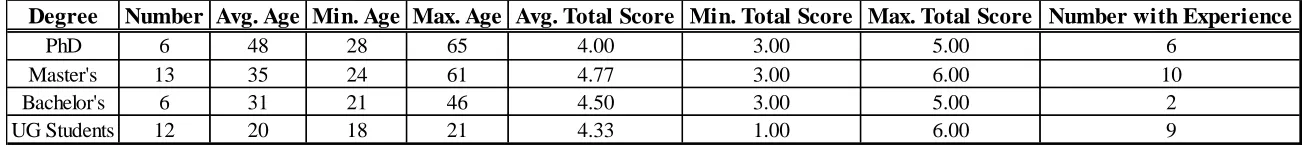
Table 3.1 Participant total number, average age, minimum age, maximum age, average total score, minimum total score, maximum total score, and number with previous experience using climate data, divided by degree type (PhD, Master’s, Bachelor’s, and undergraduate students). ... 52
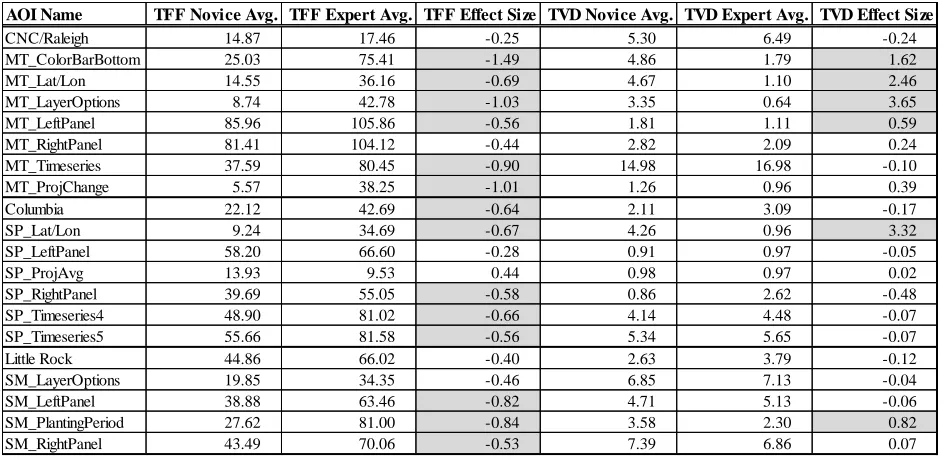
Table 3.2 The average TFF and TVD values for novices (undergraduate students) and experts (forestry professionals) for all AOIs related to the tasks and multiple choice questions within the three tools (Extreme MT, SP, and SM/CTMN). ... 53
Table 4.1 The tasks and multiple choice questions organized by PINEMAP DSS tool. ... 80
Table 4.2 The average time spent on each question. . ... 81
Table 4.3 The average score on each question. ... 82
xi
LIST OF FIGURES
Figure 2.1 Heat maps for a subset of the males (left) and females (right) for Phase 1
Seedling Markets Tool. ... 32
Figure 2.2 Heat maps for males (left) and females (right) for the Phase 2 Cold-Tolerant Markets for Nurseries... 33
Figure 2.3 A comparison of males and females and how and where they focus their attention during the five minutes of free exploration at the start of the study. ... 34
Figure 2.4 A comparison of males and females and how and where they focus their attention during tasks and while answering the related questions. ... 35
Figure 2.5 Total score out of six possible for males and females in Phase 1 and Phase 2. ... 36
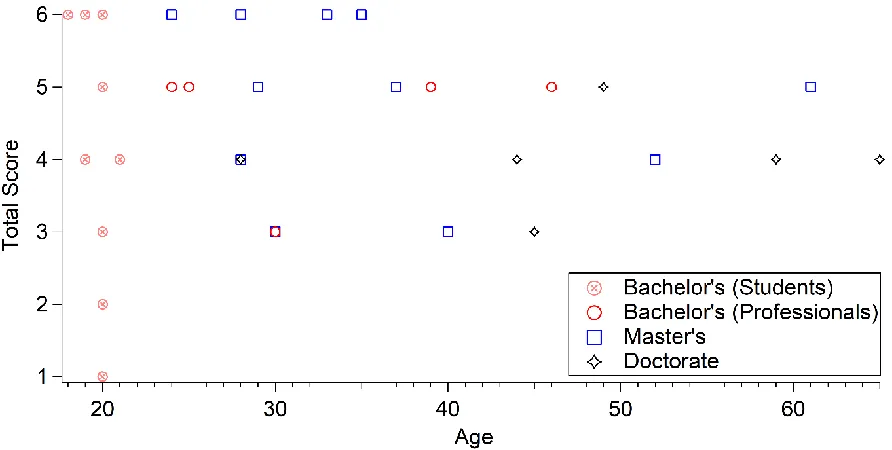
Figure 3.1 Participants’ ages plotted against their total number of correctly answered multiple choice questions. ... 54
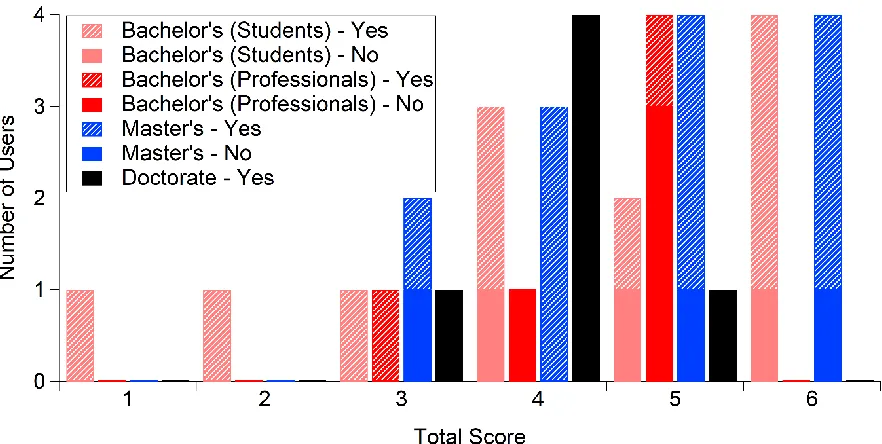
Figure 3.2 Bar graph of the total score (out of six possible) on the multiple choice questions associated with the three tasks. ... 55
Figure 3.3 AOIs as shown in the Phase 1 version of the PINEMAP DSS for the SP Tool. ... 56
Figure 3.4 Time to First Fixation (TFF) in seconds and Total Visit Duration (TVD) in seconds for the SP Tool. ... 57
Figure 3.5 AOIs as shown in the Phase 1 version of the PINEMAP DSS for the SM/CTMN Tool (Phase 1/Phase 2). ... 58
Figure 3.6 Time to First Fixation (TFF) in seconds and Total Visit Duration (TVD) in seconds for the SM/CTMN Tool. ... 59
Figure 4.1 The Cold-Tolerant Markets for Nurseries tool (Phase 2). ... 84
Figure 4.2 Phase 1 High Performers. ... 85
Figure 4.3 Phase 2 High Performers. ... 86
1
CHAPTER 1: Introduction
Loblolly pine trees are a critical component of the forestry industry in the Southeast
United States. They comprise nearly 20 million acres of forests in this region and provide
economic and ecological services (PINEMAP.org). These trees serve as a major carbon sink in
the United States, but they are also sensitive to variable and changing climates. Due to their
importance and susceptibility to climate risks, the Pine Integrated Network: Education,
Mitigation, and Adaptation Project (PINEMAP) was proposed and funded through the USDA
National Institute of Food and Agriculture in 2011. The project aims to combine research,
extension, and education to help foresters in this region manage loblolly forests in a way such
that they will increase carbon sequestration, resiliency, and sustainability.
PINEMAP ultimately led to the development of a climate decision support system (DSS),
the PINEMAP DSS, which provides foresters in the Southeast United States with historical
climate data as well as climate projections. The data are organized into different categories (e.g.,
Environment, Establishment, Management, and Production) and further divided into different
tools that focus on one variable. After the PINEMAP DSS was developed, it underwent beta
testing. The subsequent evaluation, which uses eye tracking, is presented here.
Literature Review
As the impacts from climate change begin to be observed, the need to disseminate
climate information to decision-makers for adaptation purposes grows and, in some cases, is
legally required (USDOI, 2009). When climate information is shared, special consideration must
be given to the process by which climate information is selected, used, and explained such that
the decision-makers fully understand the information they are using to make decisions for
2 for specific decision-makers and the layperson (Daron et al., 2015; Harold et al., 2016). Despite
the body of literature that acknowledges the need for readily understood and accessible climate
information for decision-makers, there is limited literature on how individuals and groups
interpret the climate information they are presented (McInerny et al., 2014; Daron et al., 2015).
Lessons learned from the field of communication can be applied to the practice of
disseminating climate information to decision-makers. Audiences bring many factors (e.g.,
political affiliation and ideology, education level, experience with major weather events,
proximity to climate change victims, etc.) to the table that can hinder their ability to accept the
science and take action (Borick and Rabe, 2008; Borick and Rabe, 2010; McCright and Dunlap,
2011; Hart and Nisbet, 2011; Kahan et al., 2012; Pearson and Schuldt, 2015). While addressing
all of these factors at once would be impossible, being aware of their impacts on an audience’s
cognitive, affective, and conative states is an important part of the communication process.
Potential ways to increase the likelihood of an audience accepting the science and taking action
include: tailoring the message for the intended audience (Severin and Tankard, 2001); allowing
for interaction between the information and the audience (Metzger, 2009); and creating space for
audience participation and feedback in the communication process (Nisbet and Scheufele, 2009).
Decision support systems (DSSs) are one way that climate information can be tailored to
decision-makers in a specific discipline, and there have been requests for such DSSs to be
developed (Mahoney et al., 2003). DSSs are, in general, collections of information (i.e.,
scientific research, analyses of information, and factors important to the decision-making
process) located in a common space that decision-makers can access and consult when making a
decision. They span across many disciplines and are becoming more common (Pyke et al., 2007).
3 information provided by a DSS and the needs of the decision makers using it (Pyke et al., 2007).
Furthermore, DSSs are often housed on websites, making them interactive (Metzger, 2009;
Mysiak et al., 2005) while also introducing the need to study the usability of web-based DSSs.
Website usability has been studied in great detail across many disciplines, and the lessons
learned through this body of research can perhaps shed some light on stumbling blocks or
usability concerns for DSSs that are often shared through websites. Website usability can be
influenced by certain user demographics. For instance, older adults tend to be less accurate and
take longer to complete tasks (Romano Bergstrom et al., 2013), and age has been found to
impact spatial ability, mental model accuracy, and usability through loss in cognitive skills
(Wagner et al., 2014; Grahame et al., 2004). When gender is considered, males and females have
different design preferences for websites, and the male dominated information technology
industry could potentially be a stumbling block for women using websites designed by males
(Moss et al., 2006). Additionally, men and women differ in what they consider to be noticeable
and appealing through self-reported surveys, but the coordinating eye-tracking data do not show
significant differences in the eye movements of males and females, leading to the need for
additional gender studies in website usability (Djamasbi et al., 2007).
Eye tracking is a quantitative research method that determines where, when, and for how
long a participant looks at a particular element on a computer screen or otherwise placed within
the line of sight. This method has existed for more than 100 years (Jacob and Karn, 2003) and
has been used in many different applications (Holmqvist et al., 2011; Drost et al., 2015; Wilson
et al., 2016). Eye tracking is often used in website usability studies in order to provide higher
resolution data than observable behaviors such as scrolling or mouse clicks (Bojko, 2006; Loyola
4 at instead of determining why the user looks at something or whether or not the user likes that
feature (Velasquez, 2013), and the analysis can be very time intensive (Jacob and Karn, 2003).
Through this technology, researchers have learned that not only do website usability problems
correlate well with specific eye-tracking patterns, but also to a series of patterns or behaviors that
users exhibit as they struggle to complete a given task (Ehmke and Wilson, 2007). It is important
to note that these studies tend to have small sample sizes (<40) (Jacob and Karn, 2003).
Motivation and research questions
There is a need to successfully disseminate accurate climate information to
decision-makers as the urgency for mitigation and adaptation planning grows, but presently, there is little
information on the efficacy of the existing dissemination methods. Specifically, the gaps
identified in the literature are: how individuals and groups of decision-makers interpret the
climate information they are provided; the efficacy of web-based DSS tools designed for a
specific audience; and how user demographics such as age, education, and gender might
influence a user’s ability to navigate a DSS. Without evaluation, there is no way to determine if
the existing methods of disseminating climate information to decision-makers are successful.
This evaluation aims to address the gaps identified in the literature by evaluating a
web-based DSS designed for a specific audience – foresters in the Southeast United States. The study
will utilize eye-tracking technology to identify aspects of the DSS that should be altered to
improve the overall usability and to quantify the differences between the various demographics
examined. Furthermore, this work will address the following broad research questions:
1. Are there gender differences in users’ ability to successfully navigate the web-based
5 2. Is experience, defined broadly by education level, age, and experience with climate
information, an accurate predictor of performance with a web-based DSS? Are there differences
between experts and novices, or are there other factors involved?
3. Which design elements distract or confuse users? Through the feedback process,
changes can be made to the overall design of the DSS. Do the changes help users better navigate
the tools and answer the questions more quickly and/or accurately? Are there other usability
concerns to examine?
By answering these questions, this evaluation will contribute to several fields by filling
the gap in the literature and serve as the first eye-tracking-focused evaluation of a web-based
climate information DSS. Additionally, it will add to the limited body of literature on gender
differences and expert-novice differences in website usability within an even more narrow area
of climate information websites. Eye tracking is very quantitative, thus adding a more robust
evaluation of website usability, particularly between groups, to the existing body of literature.
Methods PINEMAP DSS
As part of the Pine Integrated Network: Education, Mitigation, and Adaptation project
(PINEMAP), the PINEMAP DSS was created to provide climate and regional productivity
model data specifically for foresters in the Southeast United States. The tools that comprise the
DSS examine the influences that climate and loblolly pines have on each other. The following
three tools were chosen for evaluation purposes: Extreme Minimum Temperature (EMT);
Summer Precipitation (SP); and Seedling Markets (SM), later renamed the Cold-Tolerant
6 Study Designs and Populations
There were two phases in the evaluation of the PINEMAP DSS tools. The first phase
(Phase 1) was exploratory and was conducted with experts in the forestry field. Eye tracking was
used to help determine which aspects of the website impacted a user’s ability to successfully use
the website. Usability was measured by asking users to complete one task and answer two
multiple choice questions for each tool (three tasks and six questions in total). The tasks were
designed to utilize certain features of the PINEMAP DSS, one at a time, and to build on each
other from the first to the third task in order to measure the usability of individual features. For
example, the first task asked the users to input latitude and longitude coordinates, and the last
task asked the users to enter the latitude and longitude coordinates and find a drop-down menu to
turn-on a specific map layer. User demographics (age, gender, and education level) were also
collected to determine if certain characteristics influenced a user’s ability to complete the tasks
and answer the related questions correctly. Additionally, participants were asked open-ended
questions about their experiences using climate data and climate information websites. Based on
the initial findings from the first phase, the PINEMAP DSS was updated. The second phase
(Phase 2) aimed to determine if the updates made the PINEMAP DSS easier to use, if the
statistically significant differences in user performance based on user characteristics from Phase
1 could be replicated with a new group of participants (novices) in Phase 2, and if differences
between the participants in each phase exist based on education and experience levels.
The first participant group included 30 people (18 males and 12 females; 21 to 65 years
old), and their highest degrees, either completed or in progress, ranged from undergraduate to
doctoral degrees (6 undergraduate degrees, 17 master’s degrees, and 6 doctoral degrees). These
7 Durham, North Carolina, and were compensated with their choice of a pre-packaged candy bar
or a rain gauge. All participants: had five minutes to freely explore the PINEMAP DSS; had an
unlimited amount of time to complete the tasks and answer the related questions for the EMT,
SP, and SM tools; and completed a questionnaire (demographics and experience with climate
data).
The second participant group included 12 undergraduate students (4 males and 8 females;
18 to 21 years old), and their grade levels ranged from freshmen to juniors (2 freshmen, 8
sophomores, and 2 juniors). These participants were recruited from introductory physical science
classes at a large research institution in the southeastern US and compensated with a
pre-packaged candy bar. All participants: had five minutes to freely explore the PINEMAP DSS; had
an unlimited amount of time to complete the tasks and answer the related questions for the EMT,
SP, and CTMN tools; completed a questionnaire (demographics, experience with climate data,
and experience with activities linked to developing spatial ability such as scouts, video games,
navigation, etc.); and completed a block slicing test (Titus and Horsman, 2009; Ormand et al.,
2014) to measure one aspect of spatial ability.
Both phases of this study were carried out under approval through the Institutional
Review Board for the Protection of Human Subjects.
Eye-tracking Specifications and Analyses
The eye-tracking hardware used in the evaluations of the PINEMAP DSS consisted of
two Tobii X2-60 (60 gaze points per second) eye trackers during Phase 1 and one Tobii TX-300
(300 gaze points per second) eye tracker during Phase 2. The Tobii X2 -60 set-ups (portable
laptops) were used to collect data remotely (at a forestry conference in Phase 1), and the TX-300
8 Before eye movements were recorded, each participant underwent a calibration process and was
seated such that the eyes were ~65 cm from the eye tracker, all to ensure accurate and consistent
eye-tracking data. After the eye-tracking data has been collected, the Tobii software provided
both qualitative and quantitative outputs for analyses.
The qualitative outputs consist of heat maps, which indicate where and how many
fixations occur, and gaze plots, which indicate when and where users look. These products are
suitable for visual analysis and general descriptions of user eye movements and behaviors but not
for statistical analysis purposes.
The quantitative outputs are calculated based on areas of interest (AOIs), regions within
the PINEMAP DSS that are defined by the researcher. For example, one AOI is the region in
each of the tools where the user would enter in the latitude and longitude coordinates for a
specific location of interest. The AOIs were consistent as possible between Phase 1 and Phase 2
of the study, noting any changes between the two versions of the PINEMAP DSS tools when
necessary.
Once the AOIs are defined, three quantitative metrics are then calculated specific to each
AOI: the fixation count (FC), which is the total number of times that the user fixates anywhere
within the AOI; the time to first fixation (TFF), which is the total number of seconds between the
time at which the webpage loads and the time at which the user fixates for the first time within
the AOI; and the total visit duration (TVD), which is the total number of seconds over all visits
to the AOI that the user fixates within the AOI. These metrics are then exported from Tobii for
statistical analyses with the other datasets (questionnaire, tasks and multiple choice questions,
eye-9 tracking data (i.e., FC, TFF, and TVD) from participants with low calibration rates (<60%) will
not be included in the statistical analyses.
Questionnaire, Tasks/Questions, and Object Slicing Test Analyses
The questionnaire responses will be compiled into a single document. Age, gender, and
education level responses will be used for statistical analyses, and the open-ended responses will
be used to determine previous experience with climate data and spatial skill-building activities
(Phase 2 users only). Users’ responses to the multiple-choice questions asked during the task
portion of both phases of the study will be graded and given points based on correctness (1 point
for a correct response, and 0 points for an incorrect response). Individual scores will be
compared to the AOI metrics from the corresponding tools to look for eye movements or
behaviors that correspond to answering the question correctly. For users in Phase 2, the object
slicing test will be graded (one point for each correct answer, zero points for questions left blank,
and a quarter of a point taken off for each incorrect answer). Overall scores for the tasks and
multiple-choice questions (the total number of points out of 6) and for the object slicing test
(possible scores between -3.75 and 15) will be compared between the genders, age groups, and
education levels of the participants to determine if certain user characteristics influence the
users’ ability to correctly answer the questions.
Statistical Analyses
Simple means, medians, and standard deviations will be calculated for each of the
eye-tracking metrics for all participants, for males and females, for each level of education
(undergraduate, master’s, doctoral) or undergraduate grade level, and for the various age groups.
Statistical tests will be conducted to determine if the differences in means between these groups
10 outcome. Additionally, tests will be performed to determine if the differences in means between
the various groups (age, gender, education, experience, etc.) are significant. These analyses will
be completed using a combination of Excel and SPSS:
• Means (Student’s t-test) – All metrics
• Medians (Independent-Samples, k-samples) – All metrics
• Correlations (Spearman 2-tailed test) – All metrics
• Distributions (Mann-Whitney U-test) – All metrics
• Factor Analysis – Fixation Count; with Levene’s Test (variances)
• Effect Size – All metrics
Limitations
Due to the inherent differences between the forestry students and professionals from
Phase 1 and the undergraduate students in introductory physical science courses from Phase 2,
the populations are not identical. Additionally, changes were made to the PINEMAP DSS
website between Phase 1 and Phase 2 (based on the preliminary findings from Phase 1). These
could potentially influence the results that compare metrics between participants in Phase 1 and
those in Phase 2.
Spatial ability is a broad skill-set that is best measured through multiple instruments
(Titus and Horsman, 2009; Ormand et al., 2014). Due to limited time with each participant, only
one instrument was used for the participants in Phase 2, thus limiting the measurement of spatial
ability to one aspect of the broader skill-set.
Validity
The tasks and questions specific to the PINEMAP DSS website were written with help
11 researcher. Once the tasks and questions were added to the eye-tracking study design, the entire
study was reviewed with the help of four graduate students in the geosciences for content
validity.
Chapter descriptions
A brief summary of the questions to be answered by each chapter is provided. The
population to be studied, the eye-tracking metrics, any additional data, and the analyses to be
used are also designated (Table 1).
Gender differences
Statistically significant differences were found between male and female participants
from Phase 1 for the SM tool. Do similar differences exist in Phase 2 for the CTMN tool? Can
these differences be explained by spatial abilities (measured only in Phase 2 with an object
slicing test)? Are there similarities between the males and females in both populations?
Expert-Novice differences
Phase 1 consisted of students and professionals in the forestry business (Experts), and
Phase 2 consisted of students in introductory physical science classes (Novices). Controlling for
modifications made to the PINEMAP DSS between the two phases, are there any statistically
significant differences between Experts and Novices in how they engaged with the DSS
PINEMAP website?
Usability
What are the major design obstacles for users? Which features are distracting or
confusing? Once changes have been made, are users better able to navigate and use the
12
References
Bojko, A., 2006: Using Eye Tracking to Compare Web Page Designs: A Case Study.
Borick, C.P., Rabe, B.G., 2008: A reason to believe: Examining the factors that determine
Americans’ views on global warming. Issues in Governance Studies, 18, 1-14.
Borick, C.P., Rabe, B.G., 2010: A reason to believe: Examining the factors that determine
individual views on global warming. Social Science Quarterly, 91, 777–800.
Daron, J.D., Lorenz, S. Wolski, P., Blamey, R.C., Jack, C., 2015: Interpreting climate data
visualizations to inform adaptation decisions. Climate Risk Management, 10, 17-26.
Djamasbi, S., Tullis, T., Hsu, J., Mazuera, E., Osberg, K., 2007: Gender Preferences in Web
Design: Usability Testing through Eye Tracking. Americas Conference on Information
Systems, AMCIS 2007 Proceedings.
Drost, R., Trobec, J., Steffke, C., Libarkin, J., 2015: Eye tracking: Evaluating the impact of
gesturing during televised weather forecasts. Bull. Amer. Meteor. Soc., 96, 387–392,
Ehmke, C., Wilson, S., 2007: Identifying Web Usability Problems from Eye-Tracking Data.
British Computer Society, Proceedings of HCI 2007.
Grahame, M., Laberge, J., Scialfa, C.T., 2004: Age Differences in Search of Web Pages: The
Effects of Link Size, Link Number, and Clutter. Human Factors, 46, 385-398.
Harold, J., Lorenzoni, I., Shipley, T.F., Coventry, K.R., 2016: Cognitive and psychological
science insights to improve climate change data visualization. Nature Climate Change, 6,
1080-1089.
Hart, P.S., Nisbet, E.C., 2011: Boomerang effects in science communication: How motivated
reasoning and identity cues amplify opinion polarization about climate mitigation policies.
13 Holmqvist, K., Nyström, M., Andersson, R., Dewhurst, R., Jarodzka, H., van de Weijer, J., 2011:
Eye Tracking: A comprehensive guide to methods and measures. Oxford, 560 pp.
Jacob, R.J.K., Karn, K.S., 2003: Eye Tracking in Human–Computer Interaction and Usability
Research: Ready to Deliver the Promises. The Mind’s Eye: Cognitive and Applied Aspects
of Eye Movement Research. Hyona, Radach & Deubel (eds.) Oxford, England.
Kahan, D.M., Peters, E., Wittlin, M., Slovic, P., Ouellette, L.L., Braman, D. & Mandel, G., 2012:
The polarizing impact of science literacy and numeracy on perceived climate change risks.
Nature Climate Change, 2, 732-735.
Loyola, P., Martinez, G., Munoz, K., Velasquez, J.D., Maldonado, J., Couve, A., 2015:
Combining eye tracking and pupillary dilation analysis to identify Website Key Objects.
Neurocomputing, 168, 179-189.
Mahoney, J.R., Asrar, G., Leinen, M.S., Andrews, J., Glackin, M., Groat, C., Hobenstein, W.,
Lawson, L., Moore, M., Neale, P., Patrinos, A., Schafer, J., Slimak, M., Watson, H., 2003:
Strategic Plan for the U.S. Climate Change Science Program, Ch. 11 Decision Support
Resources Development.
McCright, A.M., Dunlap, R.E., 2011: The politicization of climate change and polarization in the
American public’s views of global warming, 2001-2010. The Sociological Quarterly, 52,
155-194.
McInerny, G.J., Chen, M., Freeman, R., Gavaghan, D., Meyer, M., Rowland, F., Spiegelhalter,
D.J., Stefaner, M., Tessarolo, G., Hortal, J., 2014: Information visualisation for science and
policy: engaging users and avoiding bias. Trends in Ecology & Evolution, 29, 148-157.
Metzger, M.J., 2009: The study of media effects in the era of Internet communication. In R. Nabi
14 Moss, G.A., Gunn, R., Heller, J., 2006: Some Men Like It Black, Some Women Like It Pink:
Consumer Implications of Differences in Male and Female Website Design. Journal of
Consumer Behaviour, 5, 328-341.
Mysiak, J., Giupponi, C., Rosata, P, 2005: Towards the development of a decision support
system for water resource management. Environmental Modelling & Software, 20, 203-214.
Nisbet, M.C., Scheufele, D.A., 2009: What’s next for science communication? Promising
directions and lingering distractions. American Journal of Botany, 96, 1767–1778.
Ormand, C.J., Manduca, C., Shipley, T.F., Tikoff, B., Harwood, C.L., Atit, K., Boone, A.P.,
2014: Evaluating Geoscience Students’ Spatial Thinking Skills in a Multi-Institutional
Classroom Study. Journal of Geoscience Education, 62, 146-154.
Pearson, A.R., Schuldt, J.P., 2015: Bridging climate communication divides: Beyond the partisan
gap. Science Communication, 37, 805-812.
PINEMAP (http://climate.ncsu.edu/pinemap_dss/index.php?tool=)
Pyke, C.R., Bierwagen, B.G., Furlow, J., Gamble, J., Johnson, T., Julius, S., West, J., 2007: A
decision inventory approach for improving decision support for climate change impact
assessment and adaptation. Environmental Science & Policy, 10, 610-621.
Romano Bergstrom, J.C., Olmsted-Hawala, E.L., Jans, M.E., 2013: Age-Related Differences in
Eye Tracking and Usability Performance: Website Usability for Older Adults. International
Journal of Human-Computer Interaction, 29, 541-548.
Severin, W.J., Tankard, Jr., J.W., 2001: Communication theories: Origins, methods, and uses in
15 Snover, A.K., Mantua, N.J., Littell, J.S., Alexander, M.A., McClure, M.M., Nye, J., 2013:
Choosing and using climate-change scenarios for ecological-impact assessments and
conservation decisions. Conservation Biology, 27, 1147-1157.
Titus, S., Horsman, E., 2009: Characterizing and Improving Spatial Visualization Skills. Journal
of Geoscience Education Research, 57, 242-254.
USDOI (U.S. Department of Interior), 2009: Climate change and the Department of Interior,
Secretarial order 3226, amendment no. 1. USDOI, Washington, D.C.
Velasquez, J.D., 2013: Combining eye-tracking technologies with web usage mining for
identifying Website Keyobjects. Engineering Applications of Artificial Intelligence, 26,
1469-1478.
Wagner, N., Hassanein, K., Head, M., 2014: The impact of age on website usability. Computers
in Human Behavior, 37, 270-282.
Wilson, K.A., Heinselman, P.L., Kang, Z., 2016: Exploring Applications of Eye Tracking in
Operational Meteorology Research. Bulletin of the American Meteorological Society, 97,
16 Table 1: Research questions, the population, eye-tracking metrics, other data, and analyses used
to answer the questions.
Questions Pop. ET Metrics Other Data Analyses
Gender: Are there statistically significant differences between males and females in the second phase?
Phase 2 FC, TFF, TVD Tasks/Questions Statistics
Gender: If so, does spatial
ability play a role? Phase 2 NA
Questionnaire, Object
Slicing Test Statistics
Gender: Are there similarities between males and females from both populations?
Phase 1,
Phase 2 FC, TFF, TVD
Questionnaire, Tasks/Questions
Statistics; 1:1 plots
Expert v. Novice: How do the Phase 1 forestry professionals compare to the Phase 2 students?
All Heat maps and gaze plots;
FC, TFF, TVD Tasks/Questions
Visual analysis; Statistics; 1:1 plots
Expert v. Novice: Are there any statistically significant differences between Phase 1 Experts and Phase 2 Novices?
Phase 1, Phase 2
Heat maps and gaze plots;
FC, TFF, TVD Tasks/Questions
Visual analysis; Statistics
Usability: Which design elements distract or confuse users?
All Heat maps and gaze plots;
FC, TFF, TVD NA
Visual analysis; Statistics
Usability: Do the changes help users better navigate the tools and answer the questions more quickly and/or accurately?
Phase 1,
17
CHAPTER 2: Website Usability Differences between Males and Females: An Eye-tracking Evaluation of a Climate Decision Support System
Lindsay C. Maudlin, Karen S. McNeal, Heather Dinon-Aldridge, Corey Davis, Ryan Boyles,
Rachel M. Atkins
[TO BE SUBMITTED FOR PUBLICATION TO THE BULLETIN OF THE AMERICAN
METEOROLOGICAL SOCIETY]
Capsule
Evaluations of climate decision support systems help to identify potential barriers to
successfully disseminating climate information to diverse groups of end-users.
Abstract
Decision support systems, which are collections of related information located in a
central place, can be used as platforms from which climate information can be shared with
decision-makers. In this study, a web-based climate decision support system (DSS) for foresters
in the Southeast United States was evaluated using eye-tracking technology. The initial study
design was exploratory and focused on assessing usability concerns within the website. Results
showed differences between male and female forestry experts in their eye-tracking behavior and
in their success with completing tasks and answering questions related to the climate information
presented in the DSS. A follow-up study, using undergraduate students from a large university in
the Southeast United States, aimed to determine if similar gender differences would be detected,
and if so, if the cause(s) could be determined. The second evaluation, similar to the first, showed
18 more on the maps depicting climate information, while females focused more on other aspects of
the website (e.g., text, search bars, color bars). DSS developers should consider these gender
differences when designing a web-based DSS in order to effectively support various populations
of users.
Main Text
In the face of global climate change, the need to disseminate accurate climate information
to decision-makers for adaptation purposes has grown; however, this is no easy feat.
Consideration must be given to the climate information provided to decision-makers such that it
is understandable and used appropriately (Snover et al., 2013). Further consideration should be
given to the presentation of the climate information from the visualization and design of the
content to the tailoring of information for the intended audience (Daron et al., 2015; Harold et
al., 2016).
One way to disseminate tailored climate information to decision-makers is through a
decision support system (DSS), which is defined as a collection of information located in a
central place that decision-makers can access and consult before making a decision. DSSs are
becoming increasingly common across many disciplines, but they are rarely, if ever, evaluated
and do not always meet the needs of the decision-makers using them (Pyke et al., 2007). To
ensure that this strategy is effective and that decision-makers understand the information they
will ultimately use to make potentially high-impact decisions, the efficacy of these DSSs needs
to be investigated through evaluations (Perry et al., 2016).
One such DSS has been developed and evaluated. As part of the Pine Integrated
Network: Education, Mitigation, and Adaptation Project (PINEMAP), a USDA National Institute
19 United States, the PINEMAP DSS was developed. The web-based PINEMAP DSS provides
historical and future climate and regional productivity model data specifically for foresters in this
region through a suite of tools that explore parameters such as temperature and precipitation.
After initial PINEMAP DSS development, a beta testing period indicated a need for further
evaluation that could address how users interacted with the PINEMAP DSS. The evaluation
included two phases: Phase 1, the exploratory, initial evaluation and Phase 2, the follow-up
evaluation. The initial evaluation (Phase 1) involved experts from the forestry field as these
respondents most closely represented the target audience of the PINEMAP DSS. The main goal
of the initial evaluation was to identify which aspects of the website impacted a user’s ability to
successfully navigate and use the website. Initial findings highlighted aspects of the PINEMAP
DSS that served as stumbling blocks in user navigation, and they also identified key differences
between males and females in their eye movements and in their success in completing tasks.
Based on the initial findings from Phase 1, the PINEMAP DSS was modified to address the
identified stumbling blocks. The follow-up evaluation (Phase 2) involved undergraduate students
and aimed to determine if the modifications made the PINEMAP DSS easier to use and if the
differences between males and females found in Phase 1 persisted after implementing these
changes.
Study design and populations
All study participants were given five minutes to freely explore the PINEMAP DSS
website. The free exploration period allowed participants to become familiar with the website
and gave them an opportunity to read about the PINEMAP DSS or to begin using the tools. At
20 study which measured the usability of the PINEMAP DSS and involved completing one task and
answering two multiple choice questions for each tool in the evaluation.
Three tools were evaluated: Extreme Minimum Temperature; Summer Precipitation; and
Seedling Market (later renamed to Cold-Tolerant Markets for Nurseries in Phase 2). Altogether,
there were three tasks and six multiple choice questions. The tasks were designed to utilize
certain features of the PINEMAP DSS, one at a time, in order to measure the usability of
individual website features. Additionally, each task built on the knowledge gained from the
previous tasks. For example, the first task asked the users to input latitude and longitude
coordinates, and the last task asked the users to enter the latitude and longitude coordinates,
select a time period, and find a drop-down menu to turn-on a specific map layer.
Participants’ eye movements were recorded throughout their interactions with the
PINEMAP DSS through eye tracking, a non-invasive technology that determines the location
and duration of users’ visual fixations. User demographics (age, gender, and education level)
were also collected to determine if certain characteristics influenced a user’s success in
completing the tasks and answering the related questions correctly. Additionally, participants
were asked open-ended questions about their experiences using climate data and climate
information websites.
The participant group from Phase 1 included 30 forestry students and professionals (18
males and 12 females; 21 to 65 years old), and their highest degrees, either completed or in
progress, ranged from undergraduate to doctoral degrees (6 undergraduate degrees, 17 master’s
degrees, and 6 doctoral degrees). They were recruited at a forestry conference in Durham, North
Carolina, and were compensated afterward with their choice of a pre-packaged candy bar or a
21 8 females; 18 to 21 years old) in STEM and non-STEM majors, and their grade levels ranged
from freshmen to juniors (2 freshmen, 8 sophomores, and 2 juniors). They were recruited from
introductory physical science classes at a large research institution in the Southeast United States
and were compensated afterward with a pre-packaged candy bar.
In addition to the study protocol already described, participants in Phase 2 were asked
about their experiences with activities linked to developing spatial skills and/or those which
develop map reading skills such as scouts, building blocks, playing video games, and using maps
for navigation (Casey et al., 2008; Jirout and Newcombe, 2015; Gold et al., 2018). They also
completed a block slicing test (Titus and Horsman, 2009; Ormand et al., 2014) to measure one
aspect of spatial ability, visual penetrative ability. These activities were added to the study design
to help determine if differences in spatial ability and spatial skills could explain any potential
differences between the eye movements and successful completion of tasks of males and
females.
Both phases of this study were carried out under approval through the Institutional
Review Board for the Protection of Human Subjects. To ensure validity, the tasks and questions
were written with the help of experts in the content area, and the complete study was reviewed
by multiple graduate students. Additionally, the authors are aware of the following limitations:
the two study populations were not identical; changes were made to the PINEMAP DSS website
between the two evaluation phases, so the website was not identical between Phase 1 and Phase
2; and, due to limited time with participants, only one instrument was used to measure spatial
ability. Further, the study sample size of males and females was limited due to the emphasis on
22 research) and may or may not be generalizable to the targeted study population or broader public
audiences. Future work is suggested in order address the limitations in this current study.
Differences between males and females
Guided by the existing literature on gender differences in website usability studies
(Simon, 2001; Cyr and Bonanni, 2005; Moss et al., 2006; Djamasbi et al., 2007), a major focus
of the initial PINEMAP DSS eye-tracking evaluation and subsequent follow-up study was on
identifying any differences between males and females. Eye tracking revealed qualitative
differences in the visual fixation patterns of Phase 1 males and females throughout many of the
PINEMAP DSS features, but the most obvious differences were identified in the Seedling
Markets tool (Figure 1), the third of three tools used in the evaluation. For this particular tool,
participants were tasked with entering a specific latitude and longitude and toggling on a feature
by clicking a button located above the center map. One of the questions associated with this task
required that the participants look at the city located at the specified latitude and longitude and
compare the information for the city between the three maps (the center map and the two side
maps). The male visual fixation pattern showed a major hotspot (50+ visual fixations) over the
city location in the center map and two smaller hotspots over the boxes where latitude and
longitude coordinates were entered, indicating that the majority of male visual fixations were
focused on the center map (Figure 1). The female visual fixation pattern showed a broader range
of hotspot locations throughout the Seedling Markets tool (Figure 1). Female visual fixations
focused more heavily on the non-map aspects of the website such as various features that could
be toggled off and on, the latitude and longitude boxes, drop-down menus, and the map layer
23 In Phase 2, a few modifications were made to the Seedling Markets tool, but the task and
related questions were unchanged. The tool was renamed to Cold-Tolerant Markets for
Nurseries, and the map layer options menu box was left open by default (it was minimized by
default in Phase 1). The visual fixation patterns of males and females were more similar to each
other than those from Phase 1, but there were some key differences (Figure 2). The Phase 2
males and females had similar visual fixation patterns for the content located above the maps;
however, females gave more attention to the center map and failed to give much attention to the
side maps as compared to the males, meaning that females were not looking at all of the required
data before answering the related question. Additionally, the most attention was given to the map
layer options menu box.
In general, males in both phases fixate more often on the map aspects that will help to
answer the related questions at the end of the task (e.g., 14 times v. 6 times, on average, for the
city location) while females fixate more often on other aspects of the DSS (e.g., 28 times v. 19
times, on average, for the map layer options menu box). A notable difference between males and
females in both phases is how they used their free exploration time at the start of the study. The
free exploration period was an opportunity for participants to become familiar with the
PINEMAP DSS website and tools. With their free exploration time, males fixated more on the
data (the maps themselves) than did females, and in some cases, the females did not fixate
anywhere within a given AOI (Figure 3). Additionally, females fixated more on the text on the
home page as they read through the material than did males (e.g., 169 times v. 148 times, on
average).
During the tasks and related questions portion of the study, males fixated more than
24 females fixated more on the latitude and longitude boxes and other DSS features outside the
maps than did males (Figures 1 and 4). By giving more attention to the city location within the
maps, males are likely taking in more information that will ultimately help them answer the
related questions. By giving more attention to the website aspects above the maps, females are
likely becoming more familiar with the various features of the website but not gaining insight
into the data that will help answer the related questions. When combining these two major
differences between males and females, how they use their free exploration time and where they
focus their attention most during the tasks and while answering the related questions, differences
in their success of answering the questions correctly can be expected.
Out of the six questions asked in the tasks and related questions portion of the study,
males answered more questions correctly (Figure 5), on average (4.74 v. 4.21). Out of all
subgroups, Phase 2 males answered the most questions correctly, on average (5.25), and Phase 2
females answered the least questions correctly, on average (3.88), resulting in a large effect size
difference between male and female performance (Cohen’s d = 0.81). The three lowest
performers from Phase 2 (those with total scores less than or equal to 3 out of 6) in this study
were all females (Figure 5). Additionally, they also had the least experience with any activities
related to developing spatial skills. Out of the twelve spatial-related activities inquired about in
this study, males had experience with an average of 8.75, females had experience with an
average of 6.38, and the three lowest performers had experience with an average of 3.33. The
lowest performers also had the lowest scores on the spatial ability test (3.33) compared to males
(6.25) and females (4.66). While experience with these types of activities and the spatial ability
25 portion of the study, the similarities between the three lowest performers suggest these are
factors that can influence performance.
Implications for future climate decision support systems
The findings from this study highlight the influence of end-user demographics and
experience level on the development of DSS products. For example, if we want to ensure
females focus on the data found within the maps, extra effort should be given to ensure that these
users are visually directed to that information (e.g., use an arrow or a pulsing banner to draw
attention to the map). Similarly, if we want to ensure that males read about a tool before using it,
extra effort should be given to drawing their attention to the relevant text (e.g., include the
necessary information on the same page as the tool itself and highlight it with a pulsing banner).
Additional research and effort are needed to further address how gender might impact a
user’s success in navigating and interpreting information from a climate DSS, and other user
demographics and experiences should also be considered. To ensure the development of a usable
and easily understood climate DSS for decision-makers, the target audience should be clearly
identified. In addition, evaluation should be included from the beginning of the design process
(Perry et al., 2016) and should draw on the design-based research and evaluation frameworks
(McNeal et al., 2014) used in this study.
Sidebar: Eye tracking
Eye tracking is a non-invasive, harmless technology that allows researchers to determine
where, when, and for how long a user is looking at specific elements on a computer screen. It has
been used for more than 100 years (Jacob and Karn, 2003) in various applications, including
website usability studies (Holmqvist et al., 2011; Drost et al., 2015; Wilson et al., 2016; Bojko,
26 The eye-tracking hardware used to evaluate the PINEMAP DSS utilized two different
types of instruments. The Phase 1 set-up consisted of two Tobii X2-60 (60 gaze points per
second) eye trackers used with portable laptop computers (at a forestry conference with forestry
experts). The Phase 2 set-up consisted of one Tobii TX-300 (300 gaze points per second) eye
tracker used with a stationary desktop computer (on campus with undergraduate students).
Before eye movements were recorded, each participant underwent a calibration process and was
seated such that the eyes were ~65 cm from the eye tracker, all to ensure accurate and consistent
eye-tracking data. After the eye-tracking data were collected, the Tobii software provided both
qualitative and quantitative outputs for further analysis.
The qualitative outputs include heat maps, which indicate where and how many visual
fixations occur. These products are suitable for visual analysis and general descriptions of user
eye movements and behaviors but not for statistical analysis purposes.
The quantitative outputs are calculated based on areas of interest (AOIs), regions within
the PINEMAP DSS that are defined by the researcher. For example, one AOI is the region in
each of the PINEMAP DSS tools where the user would enter in the latitude and longitude
coordinates for a specific location. Three quantitative metrics are calculated specific to each
AOI: the fixation count (FC), the total number of times that a user fixates anywhere within the
AOI; the time to first fixation (TFF), the total number of seconds between the time at which the
webpage loads and the time at which the user fixates for the first time within the AOI; and the
total visit duration (TVD), the total number of seconds over all visits to the AOI that the user
fixates within the AOI. These metrics are exported from Tobii for additional analyses. For
quality control purposes, the eye-tracking data (i.e., FC, TFF, and TVD) from participants with
27
Sidebar: Gender differences
The literature on gender differences within website design and usability studies is limited.
Moreover, existing studies are heavily focused on e-commerce and online shopping applications
and the aesthetics of these types of websites; however, these differences can shed some light on
design preferences between the genders that can still be relevant to the PINEMAP DSS
evaluation in this study. Cyr and Bonanni (2005) show that women are consistently less pleased
with a website than men using a Likert scale rating system. In addition, this study indicates that
more men than women approve of the website’s organization and layout and are able to easily
navigate the website. Other studies have reported gender differences in design preferences
including shapes and colors and in opinions of what is eye-catching and attractive (Moss et al.,
2006; Djamasbi et al., 2007). One possible explanation for these gender differences is the
manner in which males and females process information. Males tend to be selective with the
information that they attempt to comprehend while females tend to attempt to comprehend all of
the available information, so females are more likely to be less satisfied with a website if it does
not include adequate information or quickly draw their attention to it (Simon, 2001).
If users are expected to find information and be able to recall and apply that information,
then a second factor, search behavior, must be considered as this can impact learning gains (Roy
et al., 2003; Roy and Chi, 2003). For example, important design criteria for males include
minimal action, meaning that less clicking or typing to navigate the website, and flexibility,
meaning tasks can be completed in different ways. In contrast, females prefer learnability, which
entails having a similar layout and navigation process throughout the website, and user guidance,
28 The male-dominated IT industry could potentially be a stumbling block for women using
websites mainly designed by males (Moss et al., 2006), in part because previous research has
shown that gender preferences of websites and their elements tend to align best when the same
gender designed the site (Moss and Gunn, 2007). Boys have been shown to have higher aesthetic
preferences for existing children’s websites than girls, in part due to visual complexity since
boys preferred higher design complexity than girls (Wang, 2014). Less studied is the affective
aspect of website design and how it might influence website usability. A user’s affective
response to a new website has been shown to influence his or her perceived usefulness and ease
of use (Zhang and Li, 2005). Statistically significant gender differences justify customizing a
website for its audience (Simon, 2001), and if a website is not customized for female viewers or
designed with them in mind, females may experience frustration and anxiety and consequently
be less satisfied with the website (Lin and Hsieh, 2016). Additional research on gender
differences in website design and usability is needed to better inform website developers to be
29
References
Casey, B. M., N. Andrews, H. Schindler, J. E. Kersh, A. Samper, and J. Copley, 2008: The
Development of Spatial Skills Through Interventions Involving Block Building Activities,
Cognition and Instruction, 26, 269-309, https://doi.org/10.1080/07370000802177177.
Cyr, D., and C. Bonanni, 2005: Gender and website design in e-business. International J. of
Electronic Business, 3, 565-582.
Daron, J. D., S. Lorenz, P. Wolski, R. C. Blamey, and C. Jack, 2015: Interpreting climate data
visualizations to inform adaptation decisions. Climate Risk Management, 10, 17-26.
Djamasbi, S., T. Tullis, J. Hsu, E. Mazuera, and K. Osberg, 2007: Gender Preferences in Web
Design: Usability Testing through Eye Tracking. Proc. of the Thirteenth Americas
Conference on Information Systems, Keystone, Colorado, 1-8.
Gold, A. U., P. M. Pendergast, C. J. Orman, D. A. Budd, J. A. Stempien, K. J. Mueller, K. A.
Kravitz, 2018: Spatial skills in undergraduate students—Influence of gender, motivation,
academic training, and childhood play. Geosphere, 14, 668-683.
Harold, J., I. Lorenzoni, T. F. Shipley, and K. R. Coventry, 2016: Cognitive and psychological
science insights to improve climate change data visualization. Nature Climate Change, 6,
1080-1089.
Jirout, J. J., and N. S. Newcombe, 2015: Building Blocks for Developing Spatial Skills:
Evidence From a Large, Representative U.S. Sample. Psychological Science, 26, 302-310,
https://doi.org/10.1177/0956797614563338.
Lin, C. J., and T. –L. Hsieh, 2016: Exploring the design criteria of website interfaces for gender.
30 McNeal, K. S., J. C. Libarkin, T. S. Ledley, E. Bardar, N. Haddad, K. Ellins, and S. Dutta, 2014:
The Role of Research in Online Curriculum Development: The Case of EarthLabs Climate
Change and Earth System Modules. J. of Geoscience Education, 62, 560-577.
Moss, G. A., R. Gunn, and J. Heller, 2006: Some Men Like It Black, Some Women Like It Pink:
Consumer Implications of Differences in Male and Female Website Design. J. of Consumer
Behaviour, 5, 328-341.
Moss, G. A., and R. Gunn, 2007: Gender Differences in Website Design: Implications for
Education. Systemics. Cybernetics and Informatics, 5, 38-43.
Ormand, C. J., C. Manduca, T. F. Shipley, B. Tikoff, C. L. Harwood, K. Atit, A. P. Boone, 2014:
Evaluating Geoscience Students’ Spatial Thinking Skills in a Multi-Institutional Classroom
Study. J. of Geoscience Education, 62, 146-154.
Perry, S. C., and Coauthors, 2016: Get your science used—Six guidelines to improve your
products: U.S. Geological Survey Circular, 1419, https://doi.org/10.3133/cir1419.
Pyke, C. R., B. G. Bierwagen, J. Furlow, J. Gamble, T. Johnson, S. Julius, and J. West, 2007: A
decision inventory approach for improving decision support for climate change impact
assessment and adaptation. Environmental Science & Policy, 10, 610-621.
Roy, M., and M. T. H. Chi, 2003: Gender Differences in Patterns of Searching the Web. J. of
Educational Computing Research, 29, 335-348.
Roy, M., R.Taylor, and M. T. H. Chi, 2003: Searching for Information On-line and Off-line:
Gender Differences Among Middle School Students. J. of Education Computing Research,
29, 229-252.
Simon, S. J., 2001: The Impact of Culture and Gender on Web Sites: An Empirical Study. The
31 Snover, A. K., N. J. Mantua, J. S. Littell, M. A. Alexander, M. M. McClure, and J. Nye, 2013:
Choosing and using climate-change scenarios for ecological-impact assessments and
conservation decisions. Conservation Biology, 27, 1147-1157.
Titus, S., and Horsman, E., 2009: Characterizing and Improving Spatial Visualization Skills. J.
of Geoscience Education, 57, 242-254.
Wang, H.-F., 2014: Picture Perfect: Girls’ and boys’ preferences towards visual complexity in
children’s websites. Computers in Human Behavior, 31, 551-557.
Zhang, P., and N. Li, 2005: The Importance of Affectiv