ACCIDENTAL LOAD DROP ANALYSES IN THE HOT CELL
FACILITY OF ITER
Francisco Beltrán1, Didier Combescure2, Javier Ezeberry3, and Mahaboob Basha Syed4
1
Principal Engineer, Nuclear Services, IDOM, Madrid, Spain ([email protected])
2
Technical Officer, Engineering Support, Fusion for Energy (F4E), Barcelona, Spain (Currently at EdF)
3
Engineer, Nuclear Services, IDOM, Madrid, Spain
4.
ITER Organization, Route de Vinon sur Verdon, 13115 Saint Paul Lez Durance, France
ABSTRACT
The Hot Cell building is one of the nuclear safety-important buildings of the ITER facility. The main function of the building is to store activated or contaminated material for cooling down and decay before final disposal. Additionally, it will provide a safe environment for repair or testing of radioactively hot components. The building has been designed in a way that most of the rooms will not be accessible to humans during operation. Remote handling will be used extensively to move and store different types of casks and packages within the building, some of them very heavy. Consequently, accidental drops have been taken into account for the design of the building. The requirement is to maintain the structural integrity and the leak-tightness, in order to prevent loss of confinement. This paper deals with the methodology for assessment of the structural effects of a series of postulated drop-load scenarios in the Hot Cell building, both from a local (damage to structural components and liners) and a global (induced vibration) standpoint.
INTRODUCTION
Although no radioactive products are produced by the fusion reaction itself, neutrons interacting with the walls of the vacuum vessel of the Tokamak reactor in ITER will activate materials over time. Also, materials can become contaminated by beryllium and tungsten dust, or tritium. Hence, within the ITER facility, a Hot Cell building (HCF) will provide a safe environment for repair, testing or disposal of activated components. Current design of the HCF is based on a shear wall reinforced concrete structure, with substantial thickness of walls and slabs for shielding purposes. A steel liner is used to fulfill the leak tightness requirements in the red zone of the HCF against tritium and tritiated dust.
Operations within the HCF include movements of components between the docking, the maintenance and the storage areas. These movements may result in accidental drops, in which a heavy item is dropped from a certain height, impacting the floor and potentially damaging the structure. Several potential accidental drop scenarios have been identified. Drop load impacts could take place onto the lower basemat or onto different floor slabs at various levels of the building. Weights can be as large as 60 tons, falling from heights up to 14 m.
In accordance with the common practice for nuclear facilities, either the annual frequency of those accidental drops can be shown to be under a threshold level (e.g. 10-7 per year) or the building structures have to sustain the resulting drop loads, keeping their confinement function. The Safety Important Components (SIC) have also to be operative after such accidental drops.
Consequently, if any of the possible drop load scenarios could lead to punctures in the steel liner with an annual frequency larger than the threshold level, an assessment of the effects of the potential drop loads on the integrity and leak tightness of the impacted structures would need to be carried out.
THE HOT CELL BUILDING OF ITER
Description of the structure
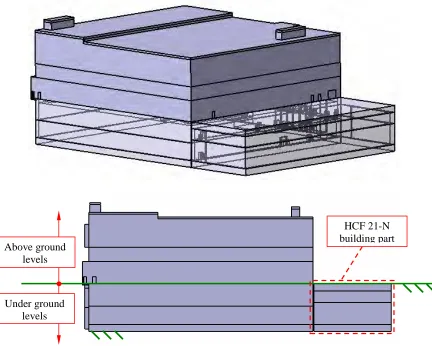
From a structural point of view, the HCF is a reinforced concrete shear wall structure, directly founded on sound limestone rock (figure 1). The dimensions of the footprint are approximately 70 x 64 m. The total height of the building is 34 m. From this height, 11 m are embedded in the ground (figure 1). The building has a structurally independent extension at the North (HCF 21-N / Radwaste Storage Extension), which is 22 m wide and totally embedded in the ground (figure 1). This extension is separated from the main body of the building by a structural joint.
Current design of the HCF considers grade C40/50 concrete and grade B 500 steel rebars, with a thickness of 1.25 m for the slabs and the basemat. The ITER Structural Design Code for Buildings specifies a minimum amount of steel reinforcement for slabs which have to sustain impact loads. For a 1.25 m thick slab, this amount is equivalent to 32 mm diameter bars at 250 mm centres at each face in each direction. Minimum shear reinforcement is 12 mm bars (links) at 250 x 250 mm centres.
In some rooms, the ceiling, walls and floor is lined by a 5 mm stainless steel liner. In the current design, the liner on the floor slabs is mounted using 1000 x 1000 mm plates whose perimeter is welded to steel profiles anchored to the concrete slab. The plates are set on the leveling grout without any other connection to the slab.
Figure 1: General perspective of the Hot Cell facility of ITER. Above ground
levels
Under ground levels
Impact scenarios
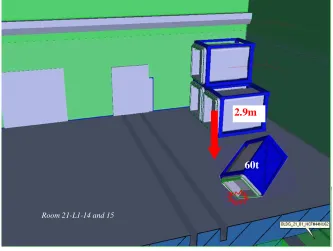
A list of drop load scenarios is provided by the design specification of the HCF. In this paper, one of these scenarios is used to illustrate the methodology. It corresponds to a drop of an equatorial or upper port plug during stacking operations at the North side of the refurbishment area, in level L1 (figure 2). The heaviest load would be an equatorial port plug with frame and spreader (60 metric tons), falling from a height of 2.9 m. The impact would be on the floor slab (1.25 m thick), which has a stainless steel liner.
ASSESSMENT OF LOCAL EFFECTS
Methodology
The assessment of local effects caused by the load drops is based on finite element simulation of the impact using ABAQUS/Explicit (Simulia, 2010). A local finite element model around the impact zone is prepared for each scenario. These local models are representative of the zone of the structure that is affected by the impact. They include the impactor, the reinforced concrete elements and the steel liner.
Figure 2: Load drop scenario 2 - Level L1 (60 ton, 2.9 m).
The methodology for simulation of impacts on concrete slabs has been tuned using the experimental results from the IRIS benchmark, promoted by the IRSN (Beltran et al, 2012). Particularly, the constitutive model for the concrete has been assessed against experimental results and its main parameters have been adapted to match the experiments as closely as possible.
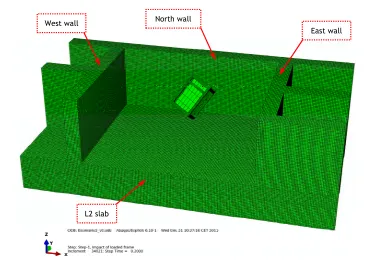
Figure 3 shows a general perspective of the finite element model used for the simulation the selected scenario (scenario 2). In general, models used in this phase are detailed local models. They are intended to obtain the effects in the zone of the impact. Boundaries are set so that structural performance, or computed level of damage, is not affected by the boundary conditions. Additionally, the structural elements with some contribution to the stiffness at the impact zone are included in the model.
2.9m
60t
North wall
East wall West wall
L2 slab
Figure 3: General view of finite element model for scenario 2 (top view).
Reinforced concrete components, slabs and walls, are represented using a segregated model for concrete and rebars. Beam type finite elements are used to represent the rebars and solid 8-node elements are used to represent the concrete walls and slabs. Typical finite element size in concrete elements is 12.5 cm (1/10 of thickness). The liner is modeled using 4-node shell type finite elements, in contact with the upper face of the concrete slab and connected to it along the lines defined by the steel profiles. The welded joint between the steel profiles and liner panels is modeled by joining the nodes of the solid elements (concrete) with the nodes of the shell elements (liner) thorough multi point constraints (MPC) connectors.
Impactors are modeled using solid elements. Contact interfaces are declared between the concrete slabs, the liner and the impactors. A friction coefficient of 0.4 is introduced at the concrete-metal interfaces (liner with supporting concrete and impactor with concrete). The friction coefficient is 0.3 at the metal-metal interfaces (liner with the impactor).
In scenarios of impact onto the foundation basemat, ground stiffness is introduced by means of elastic vertical springs. The stiffness of the springs is computed from the modulus of subgrade reaction (for an estimated 10 x 10 m interaction zone) and the tributary area around each node. The springs allow separation from ground, in case the slab rebounds after the main part of the impact.
Material constitutive models
Conventional elastic-plastic models, with a von Mises yield criterion, have been used to represent material behavior of steel at the reinforcing steel, the stainless steel liner and the impactors. Conservatively, no rate effects have been considered.
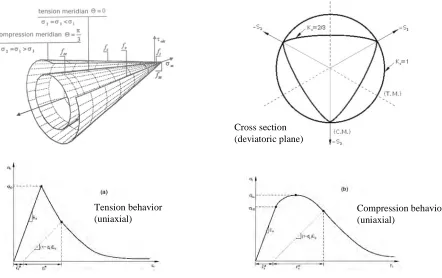
Lee and Fenves, 1998). It is a continuum, plasticity-based damage model for concrete. It assumes that the main two failure mechanisms are tensile cracking and compressive crushing. The evolution of the yield surface is controlled by two hardening variables, linked to failure mechanisms under tension and compression, respectively. Additionally, two damage variables, one in tension and one in compression, are introduced to account for degradation of elastic stiffness during loading and unloading cycles. The constitutive relations for elastic-plastic responses are decoupled from the degradation damage responses. Consequently, by setting the damage evolution to cero, the model can be used to simulate a purely elastic-plastic response.
Figure 4: Yield surface used for concrete.
Figure 4 shows a schematic view of the yield surface of the CDP. Note that the model allows for dependence on the third stress invariant, since the shape of the deviatoric cross section of the surface can be varied from circular (Kc = 1) to triangular (Kc = 0.5). Note also that two softening curves are needed to
define post-yield behavior, one in tension and one in compression. One of the model parameters is the dilation angle (ψ), which allows for non-associated plastic flow.
When using this model, it has been found that the following are sensible modeling choices, covering a large range of confining pressures (Beltran et al, 2012):
E0 = initial Young’s modulus = Secant modulus at 0.4 σcu
ν = Poisson’s ratio = 0.20 to 0.24
σcu = compressive strength = Hardening curve using Sargin model with A=2, D=1
σt0 = tensile strength = Softening based on Hillerborg regularization (fracture energy)
ψ = dilation angle = 40º
ε = flow potential eccentricity = 0.30 (smoothing of flow potential surface near vertex) σcc/σc = biaxial/uniaxial strength ratio = 1.16
Kc = shape factor for deviatoric plane cross section = 0.72
Damage in compression = 0 at σcu ; (σcu-σ)/σcu during softening
Cross section (deviatoric plane)
Tension behavior (uniaxial)
Damage in tension = 0 at σt0 ; linear increase during softening
ωc = compression recovery = 0 (no recovery of stiffness when loading changes from
tension to compression) ωc = tension recovery = 0 (no recovery of stiffness when loading changes from
compression to tension)
This concrete constitutive model still has some limitations. The most significant is that softening-hardening behavior under compression cannot be varied as a function of the hydrostatic pressure (first stress invariant). However, it represents a very significant improvement with respect to a Drucker-Prager model.
Simulation results
Figure 5 shows the time histories of resultant normal contact force and vertical velocity at the control node during simulation of scenario 2 with a preliminary definition of the impactor. Note that the impact lasts for about 73 ms. Initial part of the curves corresponds to the time allowed for stabilization of the initial stresses in the concrete. Peak resultant contact force is in the order of 14 MN.
Control node Control
node
ti=73 ms Control
node Control
node Control
node Control
node
ti=73 ms
Figure 5: Scenario 2 – Time histories of normal contact force and vertical velocity at top node.
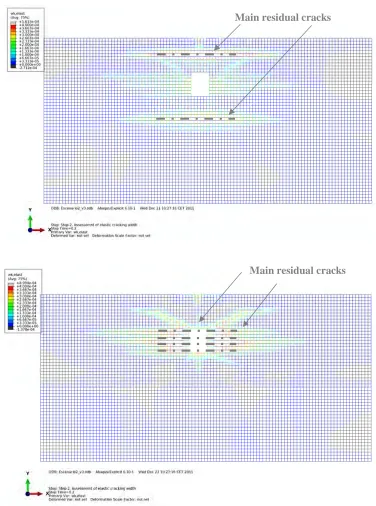
Even though impact is considered to be an accidental condition, in order to assess serviceability, residual crack widths can be computed from the residual stresses in the rebars at the end of the simulation. For this purpose, design code formulae are used (CEB, 1993). Figure 6 gives a sample of this kind of result. The figure gives top and bottom views of a computed crack width map.
ASSESSMENT OF GLOBAL EFFECTS
size is 1.0 x 1.0 m. A linear elastic model has been used to represent the behavior of the reinforced concrete in walls, slabs and columns. Velocities taken from the local impact analyses are used as input motion for a set of nodes of the global model located around the impact zones in each scenario. To model damping, the Rayleigh approach is used, with α and β parameters such that damping ratio remains below 2% in the band of 1 to 30 Hz.
Figure 6: Sample of top and bottom view of crack widths around an impact zone
Main residual cracks
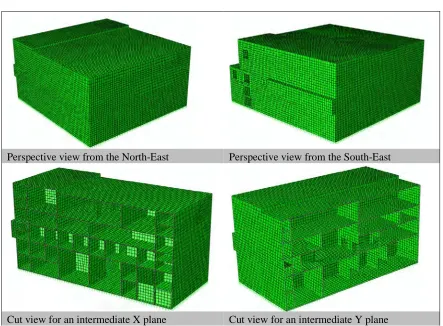
Perspective view from the North-East Perspective view from the South-East
Cut view for an intermediate X plane Cut view for an intermediate Y plane
Figure 7: Finite element model of HCF building to compute global response.
During the post-processing of the local analyses, a perimeter was defined around the impact zones which enclosed the material with plastic deformation. Outside this perimeter the material remained basically elastic and the structural behavior was mainly linear. In each case, the perimeter has a correspondence with a set of nodes in the global finite element model. For computing the global response of the building, the velocities X, Y, Z, obtained at the perimeter from the local impact simulation are set as input motion to the corresponding nodes in the global finite element model (figure 8).
Response spectra at the monitoring points within the building are computed from the acceleration time histories obtained for each scenario. Response spectra make sense up to the maximum frequency that can be represented by the global finite element model with some accuracy. It is generally accepted that the element size Le should be not larger than about 1/4 of the minimum wavelength of interest. The wavelength is a function of wave speed c and wave frequency f. The wave speed depends on the type of stress wave. In order to estimate the maximum frequency that can be represented by the global model, two kinds of waves have been considered: dilatational and flexural. For the typical element size in the global model (1 m), wave lengths up to 4 m can be represented with some accuracy. This wave length corresponds to frequencies under either 500 or 200 Hz, depending on the depth of the slabs.
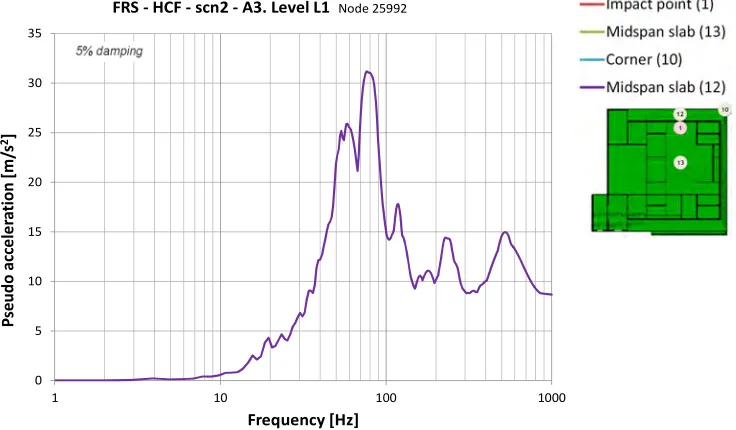
As a sample of the results, figure 9 shows the shock response spectrum computed at a location of the floor slab near the impact point of scenario 2.
0 5 10 15 20 25 30 35
1 10 100 1000
P se u d o a cc e le ra ti o n [ m /s 2] Frequency [Hz]
FRS - HCF - scn2 - A3. Level L1 Node 25992
Figure 9: Scenario 2 - FRS of pseudo accelerations at level L1 in vertical direction.
CONCLUSIONS
A methodology for assessment of effects of drop load impact scenarios in the HCF has been presented. The methodology is based on finite element simulation with detailed local models and it has been tuned using the experimental results from the IRIS benchmark, promoted by the IRSN.
On the other hand, shock response spectra at selected points of the HCF can be computed for the impact scenarios, using linear analysis with a structural model of the whole building. These spectra can be used for assessing damage to equipment located at those points.
REFERENCES
mode test and IRSN-CNSC-VTT punching mode test”, Improving Robustness of Assessment Methods for Structures Impacted by Missiles, OECD-NEA Workshop. Ottawa, October 17-19. CEB (1993). “CEB-FIP Model Code for Concrete Structures (MC90)”. CEB Bulletin 213/214. Comité
Euro-International du Béton
Kmiecik, P. and Kaminski, M. (2011). “Modeling of reinforced concrete structures and composite structures with concrete strength degradation taken into consideration”. Archives of Civil and Mechanical Engineering, XI(3).
Lee, J. and Fenves, G.L. (1998). “Plastic-damage model for cyclic loading of concrete structures”. ASCE Journal of Eng. Mechanics, 124(8). August.
Lubliner, J., Oliver, J., Oller, S. and Oñate, E. (1989). “A plastic-damage model for concrete”. Int. J. Solids and Structures, 25(3), pp 299-326.
Simulia (2010). “ABAQUS Analysis User’s Manual”, version 6.10.
Disclaimers: The views and opinions expressed herein do not necessarily reflect those of the ITER