3Com
®
eXchange Call Center
Visor User Guide
3Com Corporation, 350 Campus Drive, Marlborough, MA 01752-3064
Copyright © 2004, 3Com Corporation. All Rights Reserved. No part of this documentation may be reproduced in any form or by any means or used to make any derivative work (such as translation, transformation, or adaptation) without written permission from 3Com Corporation.
3Com Corporation reserves the right to revise this documentation and to make changes in content from time to time without obligation on the part of 3Com Corporation to provide notification of such revision or change.
3Com Corporation provides this documentation without warranty, term, or condition of any kind, either implied or expressed, including, but not limited to, the implied warranties, terms, or conditions of merchantability, satisfactory quality, and fitness for a particular purpose. 3Com may make improvements or changes in the product(s) and/or the program(s) described in this documentation at any time.
If there is any software on removable media described in this documentation, it is furnished under a license agreement included with the product as a separate document, in the hardcopy documentation, or on the removable media in a directory file named LICENSE.TXT or !LICENSE.TXT. If you are unable to locate a copy, please contact 3Com and a copy will be provided to you.
UNITED STATES GOVERNMENT LEGEND
If you are a United States government agency, then this documentation and the software described herein are provided to you subject to the following:
All technical data and computer software are commercial in nature and developed solely at private expense. Software is delivered as “Commercial Computer Software” as defined in DFARS 252.227-7014 (June 1995) or as a “commercial item” as defined in FAR 2.101(a) and as such is provided with only such rights as are provided in 3Com’s standard commercial license for the Software. Technical data is provided with limited rights only as provided in DFAR 252.227-7015 (Nov 1995) or FAR 52.227-14 (June 1987), whichever is applicable. You agree not to remove or deface any portion of any legend provided on any licensed program or documentation contained in, or delivered to you in conjunction with, this guide.
Unless otherwise indicated, 3Com registered trademarks are registered in the United States and may or may not be registered in other countries.
3Com, NBX, the 3Com logo, and SuperStack are registered trademarks of 3Com Corporation. NBX NetSet and pcXset are trademarks of 3Com Corporation.
Adobe is a trademark and Adobe Acrobat is a registered trademark of Adobe Systems Incorporated. Microsoft, Windows, Windows 2000, and Windows NT are registered trademarks of Microsoft Corporation.
C
ONTENTS
A
BOUT
T
HIS
G
UIDE
5
Conventions 5
Related Documentation 5
Documentation Comments 6
Registration, Warranty, and Support Information 6
Disclaimers 6
C
HAPTER
1: I
NTRODUCTION TO THE
3C
OM
E
X
CHANGE
C
ALL
C
ENTER
7
Call Center Overview 7
C
HAPTER
2: O
VERVIEW OF THE
3C
OM
E
X
CHANGE
V
ISOR
A
PPLICATIONS
9
3Com eXchange Call Center Administration 9
3Com eXchange Call Center Real-Time Monitoring 9
3Com eXchange Call Center Historical Reports 10
3Com eXchange Call Center Wall Board Administration 10
C
HAPTER
3:
E
X
CHANGE
C
ALL
C
ENTER
R
EAL
-T
IME
M
ONITORING
11
Using Real-Time Monitoring Reports 12
Accessing the 3Com eXchange Call Center Real-Time Monitoring Application 12
Creating New Real-Time Reports 14
Changing the Group in the Current Window 15
Call Distribution Graph 20
Group Agent Status 21
Detailed Group Status 21
Detailed Super-Group Status 22
Graphical Agent Status 22
Group Queue Calls 22
Groups Service Time Intervals Graph 23
Trunks Status 24
Groups Status 24
Group Hourly Report 24
Daily Brief Group State 25
Daily Summary Brief Group Status Window 25
Daily Summary Detailed Group Status Window 26
Hourly Group Status Window 30
Daily Detailed Group Status 31
Daily Detailed Super-Group Status 32
C
HAPTER
4:
E
X
CHANGE
C
ALL
C
ENTER
H
ISTORICAL
R
EPORTS
33
Factory Reports 34
User Definable Reports 35
Using Historical Reports 37
Creating a New Report 37
Scheduling Automatic Reports 39
Viewing and Modifying the Schedule List 42
Data Columns 42
C
HAPTER
5:
E
X
CHANGE
C
ALL
C
ENTER
W
ALL
B
OARD
A
PPLICATION
73
Messages Editor 73
Wall Board Configuration 74
Real-Time Interval 76
A
BOUT
T
HIS
G
UIDE
This guide describes how to use the 3Com eXchange Visor Applications. It describes the
Real-Time Monitoring, Historical Report, and Wall Board applications and explains how to
use them. The guide is intended for Call Center managers and supervisors.
For more information on the 3Com eXchange Call Center solution, see the Help.
For a description of many of the 3Com eXchange Call Center concepts and terms
used in this document, see
Chapter 2: Overview of the 3Com eXchange Visor
Applications.
Conventions
Table 1 lists conventions that are used throughout this guide.
Table 1 Notice Icons
Icon Notice Type Description
Information note Information that describes important features or instructions
Caution Information that alerts you to potential loss of data or potential damage to an application, device, system, or network
Warning Information that alerts you to potential personal injury or death
Related Documentation
The following documents are available on the 3Com Partner Access website for the 3Com
eXchange Call Center system:
Documentation Comments
Your suggestions are important to us because we want to make our documentation more
useful to you.
Please send e-mail comments about this guide or any of the eXchange Call Center
documentation and Help topics to:
[email protected]
Please include the following information with your comments:
§
Document
title
§
Document part number (usually found on the front page)
§
Page
number
§
Your name and organization (optional)
Example:
3Com eXchange Call Center Visor User Guide
Part Number 900-0151-01 Rev AA
Page 25
Registration, Warranty, and Support Information
For details on how to register your product and get support from 3Com, see Appendix E:
“Obtaining Support for Your 3Com Products” in the
3Com eXchange Call Center Installation
and Getting Started Guide
.
Disclaimers
The illustrations and other views, telephone displays, and screen captures appearing in this
manual are examples used to explain how the application’s features and controls are used.
What appears in the illustrations may differ from what appears on your actual equipment and
may not represent something that is possible in actual operation. The functions that you can
use and the information that you can display may differ depending on the telephony state
and external equipment connected in your network and eXchange system. Therefore, use
the illustrations only as guidelines.
C
HAPTER
1: I
NTRODUCTION TO THE
3C
OM
E
X
CHANGE
C
ALL
C
ENTER
The figures in this guide may not represent exactly what you see on your monitor
in all details. Use them only as guidelines.
The 3Com eXchange Call Center is a comprehensive routing and management system
designed to control and monitor the activities of the Call Center.
Call Center Overview
The 3Com eXchange Call Center includes the Engine, Admin, Visor and Agent modules.
§
The
Engine module
, together with the Interactive Voice Response package (IVR),
provides the Call Center administrator with a number of sophisticated mechanisms for
routing incoming calls to agents, including routing incoming calls by DNIS (the number
dialed)
In addition, the 3Com eXchange Call Center provides the administrator with a
sophisticated, yet easy to use scripting mechanism. Incoming calls are routed to agents
according to the service required by the DNIS (number dialed).
§
The
Admin module
enables authorized supervisors to define the parameters of different
system entities (for example, Agents, Agent Groups, and Trunk Groups) and easily
modify their profiles. There are several administration levels with different access rights.
§
The
Visor module
is a Management Information System. This application monitors Call
Center activities and provides real-time information as well as generating reports that
summarize the system's performance over a given time period. The Visor module also
provides statistical analysis of the Call Center system behavior within a specified period.
C
HAPTER
2: O
VERVIEW OF THE
3C
OM
E
X
CHANGE
V
ISOR
A
PPLICATIONS
The eXchange Visor suite of applications is designed to monitor ACD activities, generate
reports that summarize the past performance of the system over a given time period, and
provide statistical analysis of the Call Center system behavior within a specified period.
The figures in this guide may not represent exactly what you see on your monitor
in all details. Use them only as guidelines. See the Help files for feature details.
The eXchange Visor consists of four applications: The Administration, The Real Time
Monitoring, The Historical Reports, and the Wall Board Administration. Each application is a
separate entity that acts independently of the others.
This Management Information System enables authorized supervisors to define the
parameters of system entities (for example, Agents, Agent Groups, and Trunk Groups) and
modify their attributes. Multiple eXchange Visor workstations may be activated, allowing a
number of supervisors and managers to work simultaneously. Each one of the Visor stations
requires an appropriate license.
3Com eXchange Call Center Administration
The 3Com eXchange Call Center Administration enables authorized
managers and supervisors to define the parameters of the system entities:
Agents, Agent Groups, Trunk Groups, Super-Groups, Supervisors, and
System Definitions. Configuring these parameters is generally performed
once, when the system is set up. However, certain parameters may also need
to be updated during the course of work using the Administration application.
3Com eXchange Call Center Historical Reports
The Historical Reports application enables managers and supervisors to
generate historical statistical reports for evaluating past activities and planning
future actions. The application contains a variety of predefined report templates
that can be filled out and generated. In addition, it enables free creation of
reports based on an opened report generator using simple drag-and-drop
operations.
3Com eXchange Call Center Wall Board Administration
C
HAPTER
3:
E
X
CHANGE
C
ALL
C
ENTER
R
EAL
-T
IME
M
ONITORING
The figures in this guide may not represent exactly what you see on your monitor
in all details. Use them only as guidelines.
In Real-Time Monitoring, the supervisor observes statistical data on the screen that reflects
the actual Call Center activity as it occurs.
Real-Time data is presented in report windows. Real-Time monitoring is implemented using
dynamic reports that reflect actual Call Center activity between two configurable threshold
levels. The system continually updates the graphical data , so that the latest information for
the current time interval is always on the screen.
Examples:
If the Real-Time Interval defined is one hour, and the time is currently 10:42, the data
presented is for the time period 09:42 - 10:42. At 09:35, the data presented is for the time
period 08:35 - 09:35. By default, the real-time monitors are updated once a second. To
eliminate network impact and allow remote supervising over the WAN or Internet, the
Real-Time Monitoring application uses a sophisticated refresh-rate algorithm that is designed to
monitor the transfer abilities of the network and update the refresh rate accordingly.
Supervisor can personalize their own workspaces to use any of the various reports on
required entities (agents, groups, supergroups, trunks, and so on), according to defined
privileges. The default workspace is displayed when the supervisor logs on.
Three basic types of report templates are defined automatically:
§
Tabular Reports, with flexible column widths and scrolling bars, display current,
Using Real-Time Monitoring Reports
This section contains step-by-step instructions on how to use the Real-Time Reports. These
sub-sections include how to:
§
Access the 3Com eXchange Call Center Real-Time application
§
Create a new report
§
Change the group in the current window
§
Add a group in the current window
§
Remove a group from the current window
§
Open a report
§
Reorder the entries in a report
§
Save a report
§
View a report
§
Filter the report's results
§
Sort the report's columns
§
Set the refresh rate
Accessing the 3Com eXchange Call Center Real-Time Monitoring Application
1
Double-click the
Real-Time monitoring
icon in the 3Com eXchange Call Center folder
group. The Login window appears.
3
Click the
OK
button. The Real-Time Monitoring window appears.
Creating New Real-Time Reports
1
In the Real-Time Monitoring window, select the
New
option in the File menu. The New
dialog box appears.
2
Select the report type from the Report Type drop-down list.
3
Select the template from the Template Name list and click
OK.
The New Group, New Trunk Group or New Agent dialog box appears, depending on the
selected template.
Changing the Group in the Current Window
This action applies only to reports related to one entity such as:
§
Calls Distribution Graph
§
Group Agent Status
§
Detailed
Group
Status
§
Detailed Super Group Status
§
Agent Distribution Graph
§
Trunk Group Trunk Status
1
Select the
Change
option from the Contents menu, or use the toolbar icon.
The Change Group dialog box appears, showing the list of groups not yet included in the
report.
Adding and Removing Entities from Report Windows
Groups, Trunk Groups and stations can be added to or removed from report windows. This
action applies only to reports that allow you to see more than one entity at a time.
To add or remove Groups to or from the Brief Group Status, Group Queue calls and STI
Graph reports, or Trunk Groups to or from the Trunk Group Status Report, use the following
procedure:
1
Select
Add
or
Remove
from the Contents menu, or use the toolbar icons.
Add icon
Remove icon
The Add Group dialog box appears with the list of groups that are not already in the report.
OR
The Remove Group dialog box appears, listing groups currently presented in the report.
2
Select the group to be added to or removed from the current real-time report. Click
OK.
To add or remove stations to or from the Graphical Agent Status report
3
Select the
Add
or
Remove
option, or use the icons. The Add or Remove Station dialog
box appears.
4
Enter the number of the station to be added or removed and then click
OK.
Opening Pre-Defined Real-Time Reports
1
Select
Open
from the File menu. The Open dialog box appears.
Sorting Entries in the Current Window
Report tables can be customized by changing the order of the entries. Entries may be sorted
by agent name, by agent number or by extension number.
1
Select
Reorder
from the Contents menu, or use the toolbar icon.
The Reorder dialog box appears.
The By Extension check box does not appear for trunk and group reports.
2
Select the desired option.
3
Click
OK.
The report entries are reordered according to your selection.
After a sort is completed, all entries that are not logged in will be placed at the
bottom of the list.
Saving Real-Time Reports
A report can be saved in two lists: the public reports list, and the private report list. All
authorized supervisors can view public reports and only the supervisor who created them
can view private reports.
2
Type in a name for the report.
3
Click
OK.
An asterisk (*) in the report title bar indicates that the report structure has
changed since the last save. The report must be saved again for the changes to
be written to the database.
Setting Refresh Rate
The refresh rate is the update time interval. For example, if the refresh rate is set to 5
seconds, information is updated every five seconds.
1
Select
Refresh Rate
from the Tools menu.
2
Choose a mode:
§
Automode
- allows the system to automatically set the refresh rate depending on the
load of the network.
§
Manual Mode
- allows the user to set the refresh rate at a constant rate. The dialog
box shown in Figure 5-10 appears when Manual Mode is selected.
If the manually set refresh rate is inappropriate for the current network load, the
system increases the rate to a more efficient rate (that is, 5 seconds to 7
seconds).
3
Click
OK.
Available Report Types in the Real-Time Monitoring Application
Agent Distribution Graph
The pie chart displayed in the Agent Distribution Graph window shows the distribution of
current agent activity as it occurs. You can quickly see the percentage of agents of a group
in various states. For detailed information related to a specific slice, simply double-click it and
the details balloon appears. Graph types, colors, legends location and 2 or 3D are all user
definable.
Brief Agents Status
Brief DNIS Status
The Brief DNIS Status tabular report is designed to show performance information related to
calls received at a DNIS. The report displays counters related to the current status of calls
received at a DNIS number, plus cumulative and statistical information over the current
Real-Time Interval.
Brief Group Status
The Brief Group Status tabular report is designed to show brief information on the
performance of one or more agent groups. Current status of the group is displayed along
with cumulative and statistical information. The fields: ACD Calls, TSF, Calls Abnd, Calls
Ovfl. and Transferred out are counters or calculations related to the Real-Time Interval
defined for the group. Note that the colors in some fields indicate that the thresholds for
those fields have been exceeded. Threshold values are specified in the
Thresholds
tab of the
Groups in the Administration application. Threshold colors are specified in the Colors option
of the Administration application.
Call Distribution Graph
Group Agent Status
The Group Agent Status tabular report is designed to show the status of a group of agents.
For all logged-on agents, of that particular group, we can see what type of activity the agent
is engaged in and how long for (for example, IDLE state, ACD, WRAP, and so forth).
Different colors are used to differentiate between various states. (State colors are defined in
the Colors option of the Administration application). This report also shows additional
information related to the current call: DNIS and Caller ID (ANI) numbers if available.
Detailed Group Status
Detailed Super-Group Status
The Detailed Super-Group Status window is designed to show information that pertains to
one particular Super-Group. The information is displayed in a form similar to that of the
Detailed Group Status.
Graphical Agent Status
The Graphical Agent Status window is actually a Map and was designed to show the status
of supervised agent's activity from the supervisor's physical point of view. Dynamic icons that
indicate the actual state of the agent's activity, describe the status. Next to the state icon a
pie chart shows a breakdown of the agent activity over the working period (that is starting at
log-on time to the group). A legend of the pie chart colors is presented at the bottom of the
screen. The supervisor can double-click a pie chart for more detailed information on the
actual amount of time taken by an agent to perform a specific action.
Group Queue Calls
chart attributes (that are colors, legend, type of graph, 2 or 3D, and so forth) and can double
click a specific graph bar for more detailed information.
Groups Service Time Intervals Graph
The Group STI Graph window is designed to show the distribution of calls waiting in queues,
to be served, over the six (ST1-ST6) Service Time Intervals defined for each group.
Each STI shows the number of calls waiting and their queuing time. The longer calls wait, the
further they move to the right of the graph. The STI is determined by the time intervals
specified in the Administration application. The supervisor is free to define chart attributes
(colors, legends, type of graph, 2 or 3D, and so forth) and may double click to get more
detailed information on a graph portion.
Trunks Status
The Trunks Status tabular report is designed to show the current activity status of all the
trunks in the specified trunk group. The state of each trunk is depicted by defined colors and
next to it a timer shows the amount of time for that state.
Groups Status
The Trunk Group Status tabular report is designed to show the current activity status of one
or more trunk groups. For each trunk group, the amount of defined trunks and utilization is
displayed.
Group Hourly Report
Daily Brief Group State
The Daily Brief Group State tabular report is designed to show brief information on one or
more agent groups summarizing the activities held and performance achieved starting from
midnight. Current status of the group is displayed along with cumulative and statistical
information. The fields: ACD Calls, TSF, Calls Abnd and Calls Ovfl are counters or
calculations related to the time periods starting from midnight.
Daily Summary Brief Group Status Window
The Daily Summary Brief Group Status window is designed to display a report showing brief
information about one or more agent groups. This report presents the daily data accumulated
since midnight.
To create a Daily Summary Brief Group Status window:
1
Select the
New
option from the File menu.
2
In the New dialog box that opens, select the required report type (such as the Daily
Summary) from the drop-down list.
3
Double-click the
Brief Group Status
template, or select that template and click
OK
.
4
In the New Group dialog box that opens, either double-click the group for which you want
to obtain agent group status information, or select the group and click
OK.
5
After the window is created with the information you requested, you can add groups to
the report by selecting the
Add
option from the Contents menu.
6
You can save the report using the
Save As
option from the File menu.
Max in Q The longest time of a call currently waiting in the queue for the group.
No. Agns The number of agents which are currently logged in.
No. Unavail The number of agents in the group that are in the Unavail state.
No. Idle The number of agents in the group that are available.
No. ACD The number of agents currently speaking on ACD calls.
Calls ACD The number of ACD calls handled so far, since last midnight.
TSF The Target Service Factor. The TSF indicates how well the group is providing the level of service defined for it, via the Target ASA (Average Speed of Answer). The TSF is calculated according to the method selected in the Administration application.
Calls Abnd The number of calls that were abandoned by the caller in the group before being serviced.
Calls Intrfl The number of calls that were re-routed to another destination, due to call interflow.
To reorder columns in the window, drag and drop them to the required
positions.
To enlarge or reduce the width of a column, drag the right-hand line that
separates it from the adjoining column to the left or right.
Save the newly defined fields order or column width so that the new
configuration is displayed the next time you open the saved report.
Daily Summary Detailed Group Status Window
The Daily Summary Detailed Group Status window is designed to show detailed information
for a particular group, presenting the daily data that was accumulated since midnight. The
Daily Summary information is displayed in a form window.
To create the Daily Summary Detailed Group Status window:
2
In the New dialog box, select
Daily Summary
from the Report Type drop-down list.
3
Double-click the
Detailed Group Status
template, or select that template and click
OK
.
4
In the New Group dialog box that opens, either double-click the group for which you want
to obtain detailed status information, or select the group and click
OK.
5
After the window is created with the information you requested, you can change the
group presented in the report by selecting the
Change
option from the Contents menu.
6
You can save the report using the Save As option from the File menu.
The colors presented in some fields indicate that the thresholds for those fields
have been exceeded. Thresholds are specified in the Administration application.
The
icon denotes that this particular function is NOT available in the
eXchange Call Center.
The Daily Summary Detailed Group Status window contains the following fields:
Field Description
Calls in Queue
Inbound
Calls The number of calls currently waiting in the queue for the group.
Avg. delay The average time calls are currently waiting in the queue.
Above T. ASA The number of calls that are currently exceeding the target average speed of answer.
Max time The longest time that a call is currently waiting in the queue for the group.
Outbound Outbound ACD calls
Active
Avg. time The average time that the pending calls are currently waiting in the queue.
Max. time The longest time that a pending call is currently waiting in the queue
Agents
Logged in The current number of agents logged in.
Unavail The current number of agent stations in the Unavail state.
Wrap-up The current number of agent stations handling wrap-up.
Busy The current number of agents' stations in the Busy state.
O-Rsrvd The current number of agent stations in the Outbound Reserved state.
Email The current number of agent stations in the Email state.
Idle The current number of agent stations that are idle.
ACD The current number of agent stations handling ACD calls.
Non-ACD The current number of agent stations handling non-ACD calls.
Split The current number of agent stations handling ACD calls in other groups.
O - ACD The current number of agent stations handling Outbound ACD calls.
Current Calls Talk Time
# Too long The current number of calls that are exceeding the ACD call talk time threshold (specified in the group parameters of the Administration application)
Max The longest current call talk time.
On Current Day
Inbound
ACD Calls
Accptd The total number of accepted ACD calls since last midnight.
Abnd. The total number of abandoned ACD calls since last midnight.
Intrfl.out The total number of ACD calls that were routed to another destination due to call interflow, since last midnight.
Avg.time (sec)
In Q The average time that calls were (are) waiting in the queue since last midnight.
Talk The average time of the calls talk time since last midnight.
Abnd. The average time that abandoned calls waited before hanging up, since last midnight.
Intrfl. The average wait time in queue of ACD calls, which were re-routed to another destination due to call interflow, since midnight.
Max.time (sec)
In Q The maximum time a call waited in the queue since last midnight.
Talk The maximum talk time that a call was active since last midnight.
Abnd. The maximum amount of time after which a call was abandoned since last midnight.
Intrfl. The maximum wait time in queue of ACD calls were re-routed to another destination due to call interflow, since last midnight.
Statistics
TSF The TARGET SERVICE FACTOR indicates how well the group is providing the level of service defined for it via the Target ASA (Average Speed of Answer).
ACD calls
Acptd. The total number of accepted Outbound ACD calls since last midnight.
Answd. The total number of answered Outbound ACD calls since last midnight.
Failed The total number of Outbound ACD calls that have failed since last midnight.
Avg.time (sec)
In Q The average time a call waited in the queue since last midnight.
Talk The average talk time that a call was active since last midnight.
Failed The average time that a call failed since last midnight.
Max.time (sec)
In Q The maximum time a call waited in the queue since last midnight.
Talk The maximum talk time that a call was active since last midnight.
Failed The maximum time that a call failed since last midnight.
Hourly Group Status Window
The Hourly Group Status window is designed to display a report showing information about
one agent group that is based on an Hourly Report interval.
To create an Hourly Group Status window:
2
In the New dialog box that opens, select the
Hourly Summary
from the drop-down list.
3
Double-click the
Group Hourly Report
template, or select that template and click
OK
.
4
In the New Group dialog box that opens, either double-click the group for which you want
to obtain agent group status information, or select the group and click
OK
.
5
To change a group from the report, select the
Change
option from the Contents menu.
6
You can save the report using the Save As option from the File menu.
The following fields are displayed in the Hourly Group Status window:
Field Description
Interval Start At The Historical Report interval start time.
Total In The total number of accepted calls during the specified interval.
Calls Ansd The number of answered calls during the specified interval.
Calls Abnd The number of abandoned calls during the specified interval.
Avg. Talk The average talk time of an ACD call.
Avg. Abnd The average time an abandoned call waited in the queue.
Avg. Wrap The average time the agent spent on wrap-up after a call.
The Group Hourly Report template is fixed. You cannot change the column
sequence nor the column width.
Daily Detailed Group Status
Daily Detailed Super-Group Status
The Daily Detailed Super-Group Status is a form report designed to show detailed
information concerning one particular Super-Group. The form is divided into two areas each
of them containing information related to the performance of the Super-Group. The left area
displays on-line information about current events and activities: Calls in queue, Agents
servicing the Super-Group and current calls (similar to Detailed Super-Group Status). The
right area includes cumulative and statistical information evaluating Super-Group
C
HAPTER
4:
E
X
CHANGE
C
ALL
C
ENTER
H
ISTORICAL
R
EPORTS
The figures in this guide may not represent exactly what you see on your monitor
in all details. Use them only as guidelines.
Historical reports are used to obtain information about past Call Center activity. The
powerful, yet easy-to-use, Historical Reports application provides activity summaries and
statistical data that can help Call Center management analyze system behavior and aid in
the assessment of resources required to meet target service levels.
Historical data is presented in report windows. The windows are generated from templates
that can be configured to include specific columns and entities as required.
Historical Reports are essential for proper call system management. Analyzing system
performance based on past activity ensures that problems can be detected, solved, and
system efficiency improved.
Each report can be generated in tabular or graphical format. The user has full control over
texts, fonts, colors, column widths and even column locations with minimal mouse and
keyboard actions.
Additional powerful tools (like sorting by columns, filtering data by user defined criteria,
defining non-continuous period reports, and so forth) were included to allow a
comprehensive and flexible environment for generating sophisticated reports with no
prerequisite knowledge of database tables, SQL queries or programming languages.
§
Statistical Analysis - statistical information regarding the system's behavior over a
specific period of time, such as average talk times, average wait times, percentage
calculations, and so forth.
§
Advanced Analysis - statistical information, which estimates the amount of resources that
should have been allocated to meet the desired service level. For example, the number
of agents required meeting the target ASA during a specific period.
In addition, the supervisor can select the report summary type, as follows:
§
Vertical summary (daily interval summary or period interval average) - each line
represents the summation of specific time periods within the entire report period.
§
Horizontal summary (interval summary per day) - each line represents the summary of a
day within the entire report period.
§
Based on the types of reports described above, and the flexibility of Historical Report
design, a large variety of data can be obtained to provide the management with an
accurate operational view of the call system.
The supervisor can use two types of reports, as described in the next sections.
Factory Reports
Factory Reports are pre-defined reports supplied with the application. The user can obtain
quick results by picking the required report from the list, simply specify range parameters and
click the
GENERATE
button.
The following is a list of the pre-defined factory reports:
§
RA1.1 Agent Performance Report by Interval
§
RA1.2 Agent Performance Report by Date
§
RA2.1 Group Agents Performance Report
§
RA2.2 Super Group Agent Performance Report
§
RA3.1 Agent Activity Log Report
§
RG4.2 Abandoned Calls Analysis by Date
§
RG5.1 Detailed Wrap-Up Report By Interval
§
RG5.2 Detailed Wrap-Up Report By Date
§
RG6.1 Group Wrap-Up Code Report
§
RG7.1 Abandoned Calls Log
§
RS1.1 Super-Group Performance by Interval
§
RS1.2 Super Group Performance by Date
§
RS2.1 ACD Super Group Calls Distribution by Interval
§
RS2.2 ACD Super Group Calls Distribution by Date
§
RS3.1 Abandoned Calls Analysis by Interval
§
RS3.2 Abandoned Calls Analysis by Date
§
RT 1.1 Trunks Usage Report by Interval
§
RT 1.2 Trunks Usage Report by Date
§
RT 2.1 Trunk Report by Interval
§
RT 2.2 Trunk Report by Date
User Definable Reports
User Definable Reports are a large set of generic report structures including the basic
guideline of the report. By invoking a new template, and performing several simple actions
(like adding columns, setting sort and filtering criteria, defining required period) each
admitted supervisor can define a very sophisticated report, save it as PRIVATE (for personal
use) or PUBLIC (available to all permitted supervisors) and generate it upon request.
The following list of User Definable Templates is included:
§
1.1 Group by Interval
§
1.2 Group by Date
§
2.1 Super Group by Interval
§
2.2 Super Group by Date
§
3.1 Agent by Interval
§
3.2 Agent by Date
§
3.3 Group Agent by Interval
§
3.4 Group Agent by Date
§
3.5 Super Group Agent by Interval
§
3.6 Super Group Agent by Date
§
3.7 Agent Groups by Interval
§
3.8 Agent Groups by Date
§
3.9 Agent Calls Distribution by Agent
§
4.2 Group Agents
§
4.3 Super Group Agents
§
5.1 Trunk Group by Interval
§
5.2 Trunk Group by Date
§
6.1 Detailed Wrap-Up Code Report by Interval
§
6.2 Detailed Wrap-Up Code Report by Date
§
7.1
Wrap
Up
§
10.2 Super Group Groups
§
11.1 Trunk Exception Log
§
12.1 DNIS by Interval
§
12.2 DNIS by Date
§
13.1 Group DNIS by Interval
§
13.2 Group DNIS by Date
§
14.1 Agent DNIS by Interval
§
14.2 Agent DNIS by Date
Using Historical Reports
Creating a New Report
To create a new report from a user-definable template:
1
Create a new template by clicking
File/New.
Select a report template (for example, 1.1
Group by Interval), and click
OK.
The report template appears, as shown.
2
To set parameters for the report, choose ONE of these methods:
§
Right-click
the
Parameters
area to open the Parameters form.
5
Optionally, define the sort rules.
7
Save the created report.
It is possible to set the date and time so that, whenever the report is generated, it uses
the pre-set date and time. However, if the date and time are not pre-defined, whenever
the report is generated, you are prompted to insert these parameters.
8
To generate the report, click the
Generate
icon. The results are displayed on the screen.
At this stage you may print it or, if needed, Export it to another destination such as an
HTML format, using the Save as Type drop-down list.
Scheduling Automatic Reports
Schedule historical reports for automatic printing at specific dates in the Automatic Reports
dialog box.
To open the Automatic Reports dialog box:
The
Schedule
tab contains parameter fields that must be specified in order to schedule the
report:
Date Click the appropriate radio button to enter the required information for the Date on which you want the report to be printed, as follows:
Every Day Print the report every day at the time specified in the Time field.
Every Week Print the report once a week at the time specified in the Time field. Select the required day from the drop-down list.
Every Month Print the report on a specific day of the month. Select the required month from the drop-down list, and the day of the month (1-31), by clicking the speed buttons.
Specific Print the report on a specific date. Select the date using the spin buttons.
Time Click the appropriate radio button to enter the required information for the Time at which you want to print the report, as follows:
Every Hour Print the report every hour or interval of an hour. To select the interval, click the spin buttons.
Specific Print the report at a specific time. To select the time, click the spin buttons and radio buttons in the fields of this option.
Schedule Name
To save the schedule definition, it must be assigned a name. Type a name for the schedule in this field (up to 32 characters).
The
Destination
tab comprises the following parameter fields:
Format From the drop-down list, choose the format in which you want the report to be generated. The following options are available:
Comma-Separated Values
Data Interchange Format
Dbase Format
Lotus 1-2-3 Format
Microsoft Excel Format
Microsoft Multiplan Format
Powersoft Report (PSR) Format
SQL Syntax
Tab-Separated Columns
Text with HTML Formatting
Destination Click the appropriate radio button to print the report or to save it to a file to be used later.
The Visor Workstation and the eXchangeServer must be in the same network domain; otherwise, the Visor will be unable to select the destination of the scheduled report.
Printer When Printer is selected, the browse button is activated and can be clicked to open the Server's printers list. All the printers available to the server are listed. Select the required printer, and click OK.
The printer you select must be available at the time of printing.
File When file is selected, the following options are activated:
File Path Enter the exact file pathname or use the Browse button to select a destination path.
File Name Enter the file name.
Browse Choose a destination folder from the Server's folders list, or create a new Destination folder.
The Visor Workstation and the eXchange Server must be in the same network domain; otherwise, when the Visor clicks Browse, the directory window for the eXchangeServer will not appear.
Advanced Select a new set of options for the generated files, as follows:
Fixed Click this radio button to use the file name specified in the File Name field.
Schedule Name Use the name given to the schedule as the file name.
Generation Date Use the generation date as the file name, and choose the appropriate format from the drop-down list in the format field.
Append Time/Date
Check to append the time and/or date to the file name.
Prefix Check this box to enable specification of a prefix for the file name.
Suffix Check this box to enable specification of a suffix for the file name.
Viewing and Modifying the Schedule List
To view and modify the list of scheduled reports:
1
Select
Schedule List
option from the File menu.
2
Follow the Scheduling Automatic Reports section for modifying the scheduled reports.
The scheduled reports will be run on the 3Com eXchange Call Center Server
computer regardless of the computer on which they have they have been defined.
If you want to print the generated reports, define a default printer for the 3Com
eXchange Call Center Server computer and verify that it is operational.
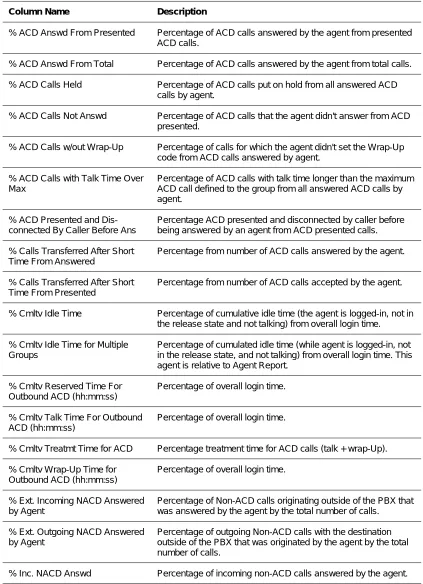
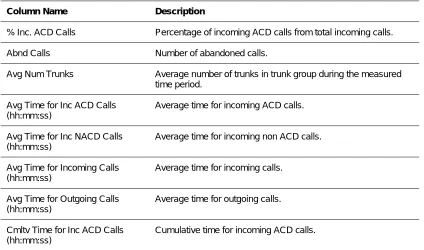
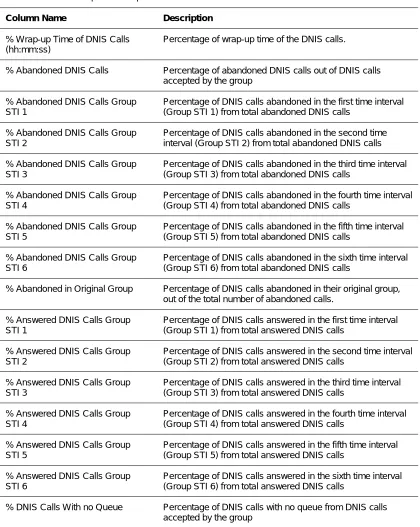
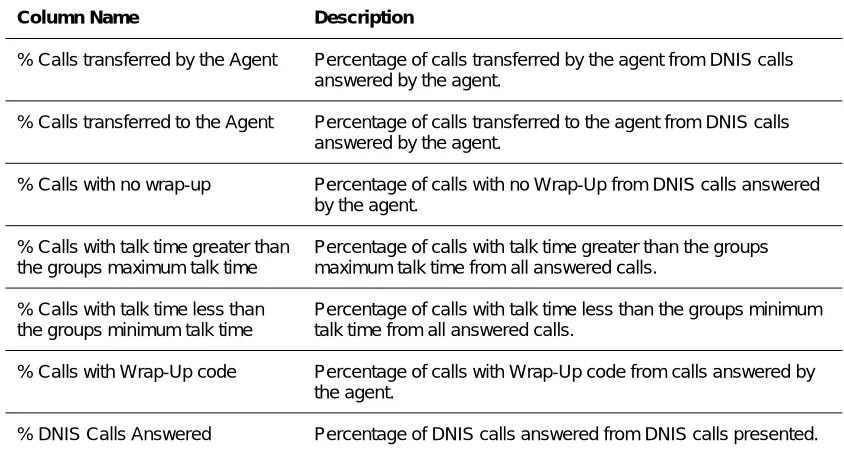
Data Columns
The data columns available for insertion into report templates are grouped in the following
categories. To select a column for sorting, click and drag the column that you want to sort.
Each category is further explained in its own table following this table.
A - Group Reports
§ Abandoned Calls Analysis by Interval
§ Group Performance by Interval
§ Group Performance by Date
§ Group Outbound
§ Agents Group by Interval
§ Agents Group by Date
§ Group Staffing Report by Interval
§ Group Staffing Report by Date
§ ACD Calls Distribution by Interval
§ ACD Calls Distribution by Date
§ Abandoned Calls Analysis by Interval
§ Abandoned Calls Analysis by Date
B – Super-Group Reports
§ Super Group by Interval
§ Super Group by Date
§ Super Group Agents
§ Super Group Groups
§ ACD Calls Distribution by Interval
§ ACD Calls Distribution by Date
§ Abandoned Calls Analysis by Interval
§ Abandoned Calls Analysis by Date
C - Agent Reports
§ Agent by Interval
§ Agent by Date
§ Agent Outbound
§ Group Agent by Interval
§ Group Agent by Date
§ Group Agents
§ Super Group Agents by Interval
§ Super Group Agents by Date
§ Agent Activity Log Report
D – Trunk Group Reports
§ Trunk Group By Interval
§ Trunk Group By Date
§ Trunking Report by Interval
§ Trunking Report by Date
E - Wrap-Up Reports
§ Detailed Wrap-Up Code Report By Interval
§ Detailed Wrap-Up Code Report By Date
§ Group Wrap-Up Code Report
F – DNIS Reports
§ DNIS By Interval
§ DNIS By Date
G - Group DNIS Reports
§ Group DNIS By Interval
§ Group DNIS By Date
§ DNIS Call Distribution By ACD Group
§ DNIS Call Distribution By DNIS
H – Agent DNIS Reports
§ Agent calls Distribution by Agent
§ Agent DNIS By Interval
§ Agent DNIS By Date
Table 2 A - Group Reports Data Columns
Column Name Description
% ACD Accepted Of ACD Percentage of ACD calls accepted by the group from ACD calls offered.
% ACD Accepted Of All Percentage of ACD calls accepted by the group from all calls.
% ACD Calls Abnd in Mand. Ann. Percentage of ACD calls abandoned in the mandatory announcer.
% ACD Calls Answd Percentage of ACD calls answered from all accepted ACD calls.
% ACD Calls Answd STI 1 Percentage of ACD calls answered in the first time interval (STI 1) from all answered ACD calls.
% ACD Calls Answd STI 2 Percentage of ACD calls answered in the second time interval (STI 2) from all answered ACD calls.
% ACD Calls Answd STI 3 Percentage of ACD calls answered in the third time interval (STI 3) from all answered ACD calls.
% ACD Calls Answd STI 4 Percentage of ACD calls answered in the fourth time interval (STI 4) from all answered ACD calls.
% ACD Calls Recvd Anncr Percentage of ACD calls which received the recorded announcement from all accepted ACD calls.
% Calls Abnd Percentage of total number of ACD calls abandoned from all accepted calls.
% Calls Abnd STI 1 Percentage of ACD calls abandoned in the first time interval (STI 1) from total abandoned calls.
% Calls Abnd STI 2 Percentage of ACD calls abandoned in the second time interval (STI 2) from total abandoned calls.
% Calls Abnd STI 3 Percentage of ACD calls abandoned in the third time interval (STI 3) from total abandoned calls.
% Calls Abnd STI 4 Percentage of ACD calls abandoned in the fourth time interval (STI 4) from total abandoned calls.
% Calls Abnd STI 5 Percentage of ACD calls abandoned in the fifth time interval (STI 5) from total abandoned calls.
% Calls Abnd STI 6 Percentage of ACD calls abandoned in the sixth time interval (STI 6) from total abandoned calls.
% Calls Ovrflw. In Percentage of ACD calls overflowed in from other groups from all accepted calls.
% Calls \Transferred After Short Time From Accepted
Percentage from number of ACD calls accepted by the group.
% Calls \Transferred After Short Time From Answered
Percentage from number of ACD calls answered by the group.
%Cmltv ACD Talk From Treatment Time
Percentage of ACD talk time from ACD calls treatment.
% Cmltv ACD Talk Time Percentage of ACD calls talk time from cumulative login time.
% Cmltv ACD Treat Time Percentage of ACD calls treatment time (talk+Wrap-Up) from cumulative login time.
% Cmltv 0-Rsrvd Time for Outbound ACD (hh:mm:ss)
Percentage of 0-Rsrvd time from accumulated login time
% Cmltv Talk Time for Inc. NACD Calls
Percentage of incoming non-ACD calls talk time from cumulative login time.
% Cmltv Talk Time for Out. NACD Percentage of outgoing non-ACD calls talk time from cumulative login time.
% Cmltv Talk Time for Outbound ACD (hh:mm:ss)
Percentage from accumulated login time.
% Cmltv Time When All Agents Busy
Percentage of time when all the agents were busy (group busy) from the report period.
% Cmltv Time When At least 1 Agent Free
Percentage of time when at least one agent was ready to receive calls from the report period.
% Cmltv Wrap-Up From Treatmt Time
% Cmltv Wrap-Up Time Percentage of Wrap-Up time from cumulative login time.
% Cmltv Wrap-Up Time for Outbound ACD (hh:mm:ss)
Percentage from accumulated login time.
% Ext Incoming NACD Percentage number of non-ACD incoming calls when originating outside of the PBX from the Total Number of Calls.
% Ext Outgoing NACD Percentage number of non-ACD outgoing calls when originating outside of the PBX from the Total Number of Calls.
% Inc. NACD Calls Percentage of incoming calls that were non-ACD from total number of calls.
% Int Incoming NACD Percentage of the number of Non-ACD incoming calls when originating from within the PBX from the Total Number of Calls.
% Int Outgoing NACD Percentage of the number of Non-ACD outgoing calls when originating from within the PBX from the Total Number of Calls.
% Number of Too Long ACD Calls Percentage from number of ACD calls accepted by the group.
% Number of Too Short ACD Calls
Percentage from number of ACD calls accepted by the group.
% Out. NACD Calls Percentage of outgoing calls which were non-ACD from total number of calls.
% Outbound ACD Accepted of All Percentage of outbound ACD calls accepted by the group from all calls.
% Outbound ACD Calls as a Consequence of the Abndn Calls
Percentage of number of outbound ACD calls as a consequence of the abandoned calls feature from all outbound ACD calls accepted.
% Outbound ACD Calls as a Consequence of the Call-Back Feature
Percentage from all outbound ACD calls accepted.
% Outbound ACD Calls Failed Percentage of the ACD calls accepted by the group from the ACD calls offered.
% Outbound ACD Calls Failed STI 1
Percentage of the failed outbound ACD calls in the first time interval (STI 1) from the number of failed outbound ACD calls.
% Outbound ACD Calls Handled by Agent
Percentage of the number of outbound ACD calls handled by agents.
% Outbound ACD Calls Handled by Agents STI 1
Percentage of outbound ACD calls handled by agents in the first time interval (STI 1).
% Outbound ACD Calls Handled by Agents STI 2
Percentage of outbound ACD calls handled by agents in the second time interval (STI 2).
% Outbound ACD Calls Handled by Agents STI 3
Percentage of outbound ACD calls handled by agents in the third time interval (STI 3).
% Outbound ACD Calls Handled by Agents STI 4
Percentage of outbound ACD calls handled by agents in the fourth time interval (STI 4).
% Outbound ACD Calls Handled by Agents STI 5
Percentage of outbound ACD calls handled by agents in the fifth time interval (STI 5).
% Outbound ACD Calls Handled by Agents STI 6
Percentage of outbound ACD calls handled by agents in the sixth time interval (STI 6).
% Outbound ACD Calls Too Long Percentage of too long outbound ACD calls from all outbound ACD calls accepted.
% Outbound ACD Calls Too Short from accepted
Percentage from all outbound ACD calls accepted.
% Outbound ACD Calls Too Short from Handled
Percentage from all outbound ACD calls handled.
% Outbound ACD Calls Transferred from Accepted
Percentage from all outbound ACD calls accepted.
% Outbound ACD Calls Transferred from Handled
Percentage from all outbound ACD calls handled.
% Outbound ACD Calls W/Out Queue
Percentage from all outbound ACD calls that were handled without entering the queue from all outbound calls accepted.
% Release Time Percentage of release time from accumulated login time.
% Short Calls from Answered Percentage of ACD calls accepted by the group from ACD calls offered.
ACD Accepted Number of ACD calls accepted by the group.
ACD Calls Abnd in Mand. Ann.
ACD Calls Answd Number of ACD calls answered.
ACD Calls Answd STI 1 Number of ACD calls answered in the 1st time interval (STI 1).
ACD Calls Answd STI 2 Number of ACD calls answered in the 2nd time interval (STI 2).
ACD Calls Answd STI 3 Number of ACD calls answered in the 3rd time interval (STI 3).
ACD Calls Answd STI 4 Number of ACD calls answered in the 4th time interval (STI 4).
ACD Calls Answd STI 5 Number of ACD calls answered in the 5th time interval (STI 5).
ACD Calls Answd w/out Que Number of ACD calls answered without waiting in the queue.
ACD Calls Call-Back Feature Activated
Counts ACD calls that were terminated before handled by an agent but the caller left his details for call-back purpose.
ACD Calls Held Number of times ACD calls were put on hold.
ACD Calls Offered Number of ACD calls which were offered to the group.
ACD Calls Ovflw Out.
ACD Calls Queued Number of ACD calls which were queued for the group.
ACD Calls Recvd Anncr Number of ACD calls which received the recorded announcement.
ACD Calls Txfrd Numbers of times that ACD calls were transferred to another destination within or out of the group.
ACD Pending Out.
Agent RPH Rate Per Hour (RPH) for answering ACD calls for the average agent of the group.
Answered by another group ACD Calls answered by another group
Avg ACD Ring Time (hh:mm:ss) Average ring time for an ACD call (time agent's phone rings).
Avg ACD Talk Time (hh:mm:ss) Average talk time of ACD calls.
Avg ACD Treatmt Time (hh:mm:ss)
Average time for ACD calls treatment (talk+Wrap-Up).
Avg Calls In Que Concurrently Average number of ACD calls which were waiting in the queue concurrently.
Avg Num Logged Agents Average number of logged-in agents.
Avg Outbound Calls in Queue Concurrently
In queue concurrently.
Avg Release Time (hh:mm:ss) Average release time for an agent.
Avg Talk Time for Inc. NACD (hh:mm:ss)
Average incoming non-ACD talk time.
Avg Time for Int Incoming NACD (hh:mm:ss)
Average time of Non-ACD incoming calls from within the PBX.
Avg Time for Int Outgoing NACD (hh:mm:ss)
Average time of Non-ACD outgoing calls from within the PBX.
Avg Wait Time Till ACD Answered (hh:mm:ss)
Average time since an ACD call accepted by group until it is answered.
Avg Wait Time Abnd ACD Calls (hh:mm:ss)
Average wait time of abandoned ACD calls.
Avg Wait Time of Failed Outbound ACD (hh:mm:ss)
Average time (accumulated wait time of failed of outbound ACD calls divided by number of failed outbound ACD calls).
Avg Wait Time of Outbound ACD Handled by Agents
Average time (accumulated wait time of outbound ACD calls handled by agents).
Avg Wait Time On Que (hh:mm:ss)
Average waiting time on queue.
Avg Wait Time Pending Out (hh:mm:ss)
Average wait time of pending outgoing ACD calls waiting to be dialed.
Avg Waiting Time on Queue of Outbound ACD (hh:mm:ss)
Average time (accumulated waiting time on queue of outbound ACD calls divided by the number of outbound ACD calls accepted).
Avg Wrap-Up Time (hh:mm:ss) Average Wrap-Up time of ACD calls.
Avg Wrap-Up Time for Outbound ACD (hh:mm:ss)
Average time (accumulated wrap-up time for outbound ACD calls divided by the number of outbound ACD calls handled).
Calls Abnd STI 1 Number of ACD calls abandoned in the first time interval (STI 1).
Calls Abnd STI 2 Number of ACD calls abandoned in the 2nd time interval (STI 2).
Calls Abnd STI 3 Number of ACD calls abandoned in the third time interval (STI 3).
Calls Abnd STI 4 Number of ACD calls abandoned in the 4th time interval (STI 4).
Calls Abnd STI 5 Number of ACD calls abandoned in the fifth time interval (STI 5).
Calls Abnd STI 6 Number of ACD calls abandoned in the sixth time interval (STI 6).
Cmltv ACD Talk Time (hh:mm:ss) Cumulative talk time of ACD calls.
Cmltv ACD Treatmt Time (hh:mm:ss)
Cumulative time for ACD calls treatment (talk+Wrap-Up).
Cmltv Login Time (hh:mm:ss) Cumulative login time.
Cmltv 0-Rsrvd Time for Outbound ACD (hh:mm:ss)
Accumulated reserved time (0-Rsrvd) of outbound ACD calls.
Cmltv Release Time (hh:mm:ss) Cumulative release time.
Cmltv Talk Time for Inc. NACD Calls (hh:mm:ss)
Cmltv Talk Time for Out. NACD (hh:mm:ss)
Cumulative talk time for outgoing non-ACD calls.
Cmltv Talk Time for Outbound ACD (hh:mm:ss)
Cumulative talk time of outbound ACD calls.
Cmltv Time Calls Conn. Ann. (hh:mm:ss)
Cumulative time when calls are connected to announcer(s).
Cmltv for Ext Incoming NACD (hh:mm:ss)
Cumulative time of Non-ACD calls when originating outside of the PBX.
Cmltv for Ext Outgoing NACD (hh:mm:ss)
Cumulative time of Non-ACD calls when destination outside of the PBX.
Cmltv for Int Incoming NACD (hh:mm:ss)
Cumulative time of Non-ACD incoming calls when originating from within the PBX.
Cmltv for Int Outgoing NACD (hh:mm:ss)
Cumulative time of Non-ACD outgoing calls with destination within the PBX.
Cmltv Time Held ACD Calls (hh:mm:ss)
Cumulative hold time of ACD calls.
Cmltv Time When All Agents Busy (hh:mm:ss)
Cumulative time when all the agents were busy (the whole group was busy).
Cmltv Time When At Least One Agent Free
Cumulative time when at least one agent was ready to receive calls.
Cmltv Time With No Active Agent Accumulated time when no agent was active (logged in and not released) in the group.
Cmltv Wait Time of Failed Outbound ACD (hh:mm:ss).
Accumulated wait time of failed outbound ACD calls.
Cmltv Wait Time Of Outbound ACD Handled By Agents (hh:mm:ss)
Cumulative waiting time of Outbound ACD calls handled by agents.
Cmltv Wait Time On Queue (hh:mm:ss)
Cumulative waiting time on queue.
Cmltv Wait Time Till ACD Answered (hh:mm:ss)
DC Answered by another group Direct (Direct in, Transferred to, and interflowed into the group) ACD Calls answered by another group
DC Answered by group Answered Direct (Direct in, Transferred to, and Interflowed into the group) ACD Calls
Direct Calls (DC) Accepted Direct (Direct in, Transferred to, and Interflowed into the group) ACD Calls
Ext Incoming NACD Number of incoming Non-ACD calls originating outside the PBX.
Ext Outgoing NACD Number of outgoing Non-ACD calls with the destination outside of the PBX.
Inc. NACD Calls Total number of incoming non-ACD calls.
Int Incoming NACD The number of Non-ACD incoming calls originating in the PBX.
Int Outgoing NACD The number of Non-ACD outgoing calls originating n the PBX.
Interflowed In ACD Calls Interflowed into the group
Longest 0-Rsrvd Time for Outbound ACD (hh:mm:ss)
Longest 0-Rsrvd time for outbound ACD calls.
Longest Talk Time For Outbound ACD (hh:mm:ss)
Longest wrap-up time for outbound ACD calls.
Longest Wait Time Of Failed Outbound ACD (hh:mm:ss)
Longest wait time of failed outbound ACD calls.
Longest Wait Time Of Outbound ACD Handled By Agents (hh:mm:ss)
Longest wait time of outbound ACD calls handled by agents.
Longest Wait Time Pending Out (hh:mm:ss)
Longest wait time of pending outbound ACD waiting to be dialed.
Longest Waiting Time On Queue Of Outbound ACD (hh:mm:ss)
Longest waiting time on queue of outbound ACD calls.
Longest Wrap-Up Time For Outbound ACD (hh:mm:ss)
Longest wrap-up time for outbound ACD calls.
Max ACD Talk Time (hh:mm:ss) Longest talk time of ACD calls.
Max Calls In Que Concurrently Maximum number of ACD calls which were waiting in the queue concurrently.
Max Num Avail Agents Maximum number of agents that were able to receive ACD calls.
Max Outbound Calls In Queue Concurrently
Maximum number of outbound ACD calls, which were waiting in the queue concurrently.
Max Ring Time for ACD (hh:mm:ss)
Longest ring time for an ACD call (time agent's phone rings).
Max Time Calls Conn. Ann. (hh:mm:ss)
Max Wait Time Till ACD Answered (hh:mm:ss)
Longest time since an ACD call accepted by group until it is answered.
Max Wait Time Abnd Calls (hh:mm:ss)
Longest wait time of abandoned ACD calls.
Max Wait Time On Que (hh:mm:ss)
Longest waiting time on queue.
Max Wrap-Up Time (hh:mm:ss) Longest Wrap-Up time of ACD calls.
Min Num Avail Agents Minimum number of agents that were able to receive ACD calls.
Min Wait Time Abnd Calls (hh:mm:ss)
Shortest wait time of abandoned ACD calls.
Number Of Calls Transferred Before Predefined Threshold
Number of calls before predefined threshold.
Number of Too Long ACD Calls The number of ACD calls which were longer than a predefined number of seconds.
Number of Too Short ACD Calls The number of ACD calls which were shorter than a predefined number of seconds.
Out. NACD Calls Total number of outgoing non-ACD calls.
Outbound ACD Accepted Percentage of ACD calls accepted by the group from ACD calls offered.
Outbound ACD Calls as a Consequence of The Abnd Calls
Percentage of ACD calls accepted by the group from ACD calls offered.
Outbound ACD Calls as a Consequence of the Call-Back Feature
Any outbound ACD call that is generated by the exchange as a consequence of a call-back (as opposed to outbound as consequence of abandoned or any other reason).
Outbound ACD Calls Failed The number of outbound calls that failed.
Outbound ACD Calls Failed STI 1 The number of outbound calls that failed in the first time interval (STI 1).
Outbound ACD Calls Failed STI 2 The number of outbound calls that failed in the second time interval (STI 2).
Outbound ACD Calls Handled by Agents STI 1
The number of outbound ACD calls handled by agents in the first time interval (STI 1).
Outbound ACD Calls Handled by Agents STI 2
The number of outbound ACD calls handled by agents in the second time interval (STI 2).
Outbound ACD Calls Handled by Agents STI 3
The number of outbound ACD calls handled by agents in the third time interval (STI 3).
Outbound ACD Calls Handled by Agents STI 4
The number of outbound ACD calls handled by agents in the fourth time interval (STI 4).
Outbound ACD Calls Handled by Agents STI 5
The number of outbound ACD calls handled by agents in the fifth time interval (STI 5).
Outbound ACD Calls Handled by Agents STI 6
The number of outbound ACD calls handled by agents in the sixth time interval (STI 6).
Outbound ACD Calls Too Long The number of outbound ACD calls too long.
Outbound ACD Calls Too Short The number of outbound ACD calls which were answered, then hung up, and their talk time was shorter than the predefined number of seconds.
Outbound ACD Calls Transferred Before Predefined Threshold
The number of outbound ACD calls that were answered then transferred with a shorter talk-time than the time frame allocated in the system.
Outbound ACD Calls Without Queue
The number of outbound ACD calls that were handled and didn't enter the queue.
OvflowlN-> interflowed Overflowed - In ACD calls interflowed out of the group.
OvflowlN Abandoned Overflowed - In ACD calls abandoned.
OvflowlN ACD Calls Overflowed - In ACD calls.
OvflowlN Answered Calls by Another Group
Overflowed - In ACD calls.
OvflowlN Answered Calls by a Group
Overflowed - In ACD calls answered by another group.
RPH Outbound ACD Calls The Rate Per Hour (RPH) number is calculated by dividing the total number of outbound ACD calls by the total login time
Shortest Wait Time of Failed Outbound ACD (hh:mm:ss)
Shortest wait time of failed ACD calls.
Shortest Wait Time of Outbound ACD Handled by Agents
Shortest wait time of outbound ACD calls.
Target-ASA (hh:mm:ss) The Target - ASA.
Total Calls Total number of calls (ACD + incoming + outgoing non-ACD).
Total Calls Abnd Total number of abandoned ACD calls.
Table 3 B - Super Group Reports Data Columns
Column Name Description
% ACD Accepted From Offered Percentage of ACD calls accepted by the super group from ACD calls offered.
% ACD Accepted From Total Calls
Percentage of ACD calls accepted by the super group from all calls.
% ACD Calls Answd Percentage of ACD calls answered from all accepted ACD calls.
% ACD Calls Answd STI 1 Percentage of ACD calls answered in the first time interval (STI 1) from all answered ACD calls.
% ACD Calls Answd STI 2 Percentage of ACD calls answered in the second time interval (STI 2) from all answered ACD calls.
% ACD Calls Answd STI 3 Percentage of ACD calls answered in the third time interval (STI 3) from all answered ACD calls.
% ACD Calls Answd STI 4 Percentage of ACD calls answered in the fourth time interval (STI 4) from all answered ACD calls.
% ACD Calls Answd STI 5 Percentage of ACD calls answered in the fifth time interval (STI 5) from all answered ACD calls.
% ACD Calls Answd STI 6 Percentage of ACD calls answered in the sixth time interval (STI 6) from all answered ACD calls.
% Calls Abnd STI 1 Percentage of ACD calls abandoned in the first time interval (STI 1) from total abandoned calls.
% Calls Abnd STI 2 Percentage of ACD calls abandoned in the second time interval (STI 2) from total abandoned calls.
% Calls Abnd STI 3 Percentage of ACD calls abandoned in the third time interval (STI 3) from total abandoned calls.
% Calls Abnd STI 4 Percentage of ACD calls abandoned in the fourth time interval (STI 4) from total abandoned calls.
% Calls Abnd STI 5 Percentage of ACD calls abandoned in the fifth time interval (STI 5) from total abandoned calls.
% Cmltv ACD Treatment Time Percentage of ACD calls treatment time (talk + wrap-up) from cumulative talk time.
% Cmltv Talk Time for Inc. Non-ACD Calls
Percentage of incoming non-ACD calls talk time from cumulative login time.
% Cmltv Talk Time for Out. Non-ACD Calls
Percentage of outgoing non-ACD calls talk time from cumulative login time.
% Cmltv Wrap-Up From Treatmt Time
Percentage of Wrap-Uptime from ACD treatment.
% Cmltv Wrap-Up Time Percentage of Wrap-Uptime from cumulative login time.
% Inc. Non-ACD Calls Percentage of incoming calls that were non-ACD from total number of calls.
% Out. NACD Calls Percentage of outgoing calls which were non-ACD from total number of calls.
% Release Time Percentage of release time from accumulated login time.
% Short Calls From Accepted Percentage from number of ACD calls accepted by the Super Group.
% Short Calls From Answered Percentage from number of ACD calls answered by the Super Group.
% Total Abnd ACD Calls Percentage of total number of abandoned ACD calls from all ACD calls accepted.
ACD Accepted Number of ACD calls accepted by the super group.
ACD Calls Answd Number of ACD calls answered.
ACD Calls Answd STI 1 Number of ACD calls answered in the 1st time interval (STI 1).
ACD Calls Answd STI 2 Number of ACD calls answered in the 2nd time interval (STI 2).
ACD Calls Answd STI 3 Number of ACD calls answered in the 3rd time interval (STI 3).
ACD Calls Answd STI 4 Number of ACD calls answered in the 4th time interval (STI 4).
ACD Calls Answd STI 5 Number of ACD calls answered in the 5th time interval (STI 5).
ACD Calls Answd STI 6