1
The Relationship between Economic Value Added, Return on
Assets, and Return on Equity with Market Value Added in
Tehran Stock Exchange (TSE)
Habibollah Nakhaei
*and Nik Intan Norhan Bnti Hamid
This study aim is to examine the relationship between economic value added (EVA), return on assets (ROA), and return on equity (ROE) with market value added (MVA) in Tehran Stock Exchange (TSE). The sample involves 87 non-financial companies listed in Tehran Stock Exchange (TSE) over the period 2004–2008. Pearson correlation coefficient and regression method was employed to analysis the scondary data. The results indicated there are meaningful correlation between EVA, and ROE with MVA, but there is not meaningful association between ROA and MVA.
Key words: economic value added, return on assets, return on equity, market value added, cost of capital
1. Introduction
Nowadays, according to company’s development and separation of ownership from management, the discovery of appropriate criterion has become increasingly important for evaluating managers and company's performance(Nakhaei, Nik Intan, Melati, & Nakhaei, 2013). According to Jahankhani & Sohrabi (2010), in order to ensure optimal allocation of limited resources, evaluating of the companies’ performance is vital. Suitable criteria for evaluating performance of the enterprise or shareholder value must be used, if the value of the company does not propel toward real value, the funds are not allocated properly.
Basically, the criteria related to determine companies value and managers performance can be divided into two categories: (i) Traditional financial performance measures (Accounting measures), and (ii) Value based financial performance measures (Economic measures). In the accounting model, firm value is a function of various criteria such as profit, earning per share (EPS), rate of profit growth, return on equity (ROE), return on assets (ROA), divided per share (DPS), book value (BV), operational cash flow (OCF), return on sales (ROS), and shares of supply and demand. In the value based model, firm value is a function of power of assets profitability, potential investors, and different between rate of return and weighted average cost of capital (WACC) (Jahankhani & Zariffard, 1995).
*
Corresponding author: Habibollah Nakhaei is a lecturer at Department of accounting, Birjand Branch, Islamic Azad University, Birjand, Iran and PhD. Student of Universiti Teknologi Malaysia (UTM).
Tel: 0060177866541, Email: habibollahnakhaei@yahoo.com
**
2
Most of the value based measures involve; economic value added (EVA),refined economic value added (REVA), market value added (MVA), cash value added (CVA), and free cash flow (FCF) (Pouyanfar, Rezaee, & Safabakhsh, 2010).
In assessing the company performance based on accounting measures, only the profit or net income are considered. These measures are not adequate, because they do not consider the cost of capital. One of the newest value based criteria is economic value added (EVA). Based on this criterion, the value of company depends on the yield and cost of capital employed. Hence,the difference between economic value added and accountingperformance measures lays on the fact that in its determination efforts are made to consider the expenses of all financial resources(Lovata & Costigan, 2002).
The experiential studies emphasize that there is no single accounting criteria which illustrate the changeability in the stockholders wealth (Chen & Dodd, 1997). Each financial criterion that use for evaluation of company performance must be very connected with stockholders wealth. Accounting performance measures such as net profit (NP), net operational profit after tax(NOPAT), earning per shares(EPS), retern on investment(ROI), return on equity(ROE), and so on, have been criticized because their incapability to shape into a corporation full cost of capital, thus accounting income is not a consistent predictor of firm value and cannot be used for measuring corporate performance. Value based management system has gained popularity in academic literature in last two decades(Sharma & Kumar 2012).
The purpose of this study is to examine the relative explanatory power of the economic value added (EVA) model with respect to market value added (MVA) compared to recognized accounting measures (ROA and ROE) in the context of Tehran Stock Exchange (TSE). In other words, the purpose of this study is to investigate, whether EVA has better relationship with MVA compare to accounting measures (ROA and ROE). The results indicated there are meaningful correlation between EVA, and ROE with MVA, but there is not meaningful association between ROA and MVA.
The remainder of the study is organized as follows: The second section provides a summary review of prior literature. Research variables are reported in the third section. The fourth section presents the research Hypotheses. Methodology and testing the hypotheses are reported in section five and six respectively. The seventh section presents the research conclusion.
2. Litrature Review
EVA is a specific formulation of residual income, which has been used in the past, andthe idea that managers should return a higher rate than the cost of capital is also notnew (Bromwich & Walker, 1998). Stewart’s major contribution is the measurementof residual earnings, capital, and cost of capital(Lovata & Costigan, 2002).
3
various performance measures and share market returns. The consequence point out that there are most highly associated between EVA and share market returns and this correlation was slightly better than with traditional performance measures such as ROA, ROE and ROS.
De Wet (2005) investigated the relationship between EVA and traditional accounting measures with MVA. The study rooted on the data of firms listed on the JSE South Africa from 1994-2004. The results demonstrated strongest association between MVA and operational cash flow. The standardized relationship between MVA and OCF, ROA, and EVA is 38%, 15%, and 8% respectively. The study also found very little relationship between EPS and DPS with MVA.Yaghoob-nejad and Akkaf(2007) stadied the relationship between EVA, residul income (RI), ROS, and return on investment (ROI) with MVA. Their finding exhibited there are meaningful relationship between EVA, RI, ROS, and ROI with MVA.
Paula & Elena (2009) examined the association between EVA, EPS,OCF, and DPS whit Market value added (MVA) during the period of 1994 to 2004. The results showed there are stronger relationship between MVA and operational cash flows (OCF) but EVA did not show the strongest association with MVA. The results also revealed very little relationship between MVA and EPS, or between MVA and DPS.
Sharma and Kumar (2012) examined whether EVA can be employed as a tool of performance measures while investing in Indian market and give confirmation about its dominance as a financial performance measure as compared to traditional performance measures (EPS, ROE, ROA, OCF, NOPAT, NI, and RI) in Indian companies. To test the hypotheses and to know the efficacy of various performance measures Panel data regression was used. The results exhibited that EVA is significant connection with MVA and there is positive relationship between EVA and MVA of Indian firms. Furthermore, the results indicated that EPS and RI dominate than EVA in explanation the MVA. They suggest that investor should employ EVA together with traditional measures in evaluation of company and making investment strategy.
3. Research Variables
In this study, economic value added (EVA), return on assets (ROA), and return on equity (ROE) are independent variables, and market value added (MVA) is dependent variable.
3.1 Economic Value Added (EVA)
EVA, MVA and their predictable benefits are introdused by the book of Bennet Stewart, The Quest for Value (1991). EVA is advanced as being preferred to other comparatively economical measures such as earning per shares (EPS), return on assets (ROA), return on equity (ROE)in aligning stockholder and manager goals.
4
Every company’s most important goal must be to increase its EVA. Let that be your quest.Forget about earnings, earnings per share, earnings growth, dividends,rate of return,and even cash flow. All of them are fundamentally flawed measures of performance and value.EVA is all that really matters (pp. 175–177).
EVA is a method of measuring the economic value of a business after considering capital cost including debt cost and equity cost (Stewart 1991). On the basis of accounting standards in calculation of typical accounting indexes only cost of debt is considered, while in calculation of EVA, in addition to cost of debt also the cost of equity is deducted (Noravesh, Salehy, & Karamy, 2004). The key point of the EVA, is that value is created when the rate of investment return is more than the rate of total capital cost, which means the cost of capital, encompasses the risk of investment (Biddle, Bowen, & wal -lace, 1998). In order to calculate the EVA, the total employed cost of capital is deducted from operating profit after the tax (Noravesh & Mashayekhi, 2004).
EVAt = NOPATt – (WACCt × Capitalt-1) (1)
Where: EAV is economic value added, NOPAT is net operational profit after tax, and WACC is weighted average cost of capital.
Also we can attain EVA from the difference between return on invested capital (ROIC) and cost of capital and its product on the economic cash value of capital which the company has employed.
EVAt = (ROICt – WACCt) × Capitalt-1 (2)
Where: ROIC is return on invested capital. Return on invested capital, measures the productivity of employed capital without regard to method of financing and accounting deviations Which is originated from accrual records, conservative concept, and no consideration of unsuccessful attempts to capital and this rate may be compared directly to the rate of capital cost so that the creation or vanishing of value in the company is specified. For the calculation of rate of invested capital, net operational profit after tax is divided to the total employed capital.
Where: WACC is waighted average cost of capital, CD is cost of debts, TD is total debts, TE is total equity, CE is cost of equity, and T is tax rate.
The capital assets pricing model (CAPM) is used for the calculation of economic value added:
RI = RF +[(RM – RF) × β] (5)
Where: RI is rate of expected shares return, RF is rate of return without risk, β (Beta) is
systematic risk or share market or level of return surplus sensitivity of company in relation to market return surplus which is calculated as follows:
(3)
(4)
[
5 )
( ) , (
m m i R VAR
R R COV B
RM is expected return of the market which will be calculated as follows;
RM
1 1
t t t
I I I
Where: It is common index of market in the end of the term–t, It-1 is common index of
market in the beginning of the term-t.
3.2 Return on Assets (ROA)
ROA is one of the profitability ratios. It shows the efficient management at using assets to generateearnings. The ratio of net income to total assets measures the return on total assets (ROA) after interest and taxes(Brigham & Ehrhardt, 2005):
ROA = Net profit / Total assets
Where: NP is net profit, TA is total assets, and TS is total sale.
3.3 Return on Equity (ROE)
According to Chandra Shil (2009) “Among all traditional measures, return on capital is very common and relatively good performance measure. Different companies calculate this return with different formulas and call it also with different names like return on investment (ROI), return on invested capital (ROIC), return on capital employed (ROCE), return on net assets (RONA), return on equity (ROE) etc.” “Stockholders invests to get a return on their money, and this ratio tells how well they are doing in an accounting sense” (Brigham & Ehrhardt, 2005). The calculation of ROE can be broken up into three separate ratios, as follows:
Where: TS is total sales, TE is total equity, TA is total assets, NP is net profit or net income (NI).
3.4 Market Value Added (MVA)
While EVA measures shareholder value addition of firm in terms of its real economic performance, MVA measures market’s assessment of firm’s value. MVA thus measures value by the management over and above the capital invested in the company by investors.
(6)
(6)
(7) NP NP TS
TA TS TA ROA = = ×
(8)
6
MVA = Market value of company - Capital employed
For a public limited company, its market value is calculated as market value of its equity (number of shares outstanding times their share price) plus book value of debt (since market value of debt is generally not available). Capital employed is effectively the book value of investments in the business made-up of debt and equity. Effectively, the formula becomes:
MVA = Market value of equity - Book value of equity
These items have been obtained from balance sheet statement of companies. (Vijayakumar, 2012).
4. Research Hypotheses
According to the above mentioned literature as well the objective of the study the following hypothesis is postulated in the study:
H1: There is a significant relationship between EVA and MVA.
H2: There is a significant relationship between ROA and MVA.
H3:There is a significant relationship between ROE and MVA.
5. Methodology and Testing the Hypotheses
This study is a deductive research. This study is also a correlative study since it seeks to investigate the relationship between dependent and independent variables. It is a periodic study because it studies a specific period of time and it can be an applied research. In order to gather theoretical information, library research was selected and the books in the libraries together with articles found in internet were used. The sample data of this study was restricted to non-financial companies, which were listed in TSE and with available annual trading data during the period of 2004 through 2008. The financial companies such as holdings and investments are excluding from the sample data, in order to have consistent interpretation on certain company characteristics such as earnings and size. The sampling method is the systematic elimination and the sample firms must have following conditions:
1. Information must be available for the past 5 years.
2. Fiscal year must be ended at the end of year (20th of March). 3. Transaction intervals must not be more than 6 month.
4. Data must be available for testing hypotheses
The regression model used in this study are as follows:
MVAit = β0 + β1EVAit + β2ROEit + β3ROAit + eit
7
Where: MVA is market value added, EVA is economic value added, ROE is return on equity, ROA is return on assets, and E is a random disturbance term.
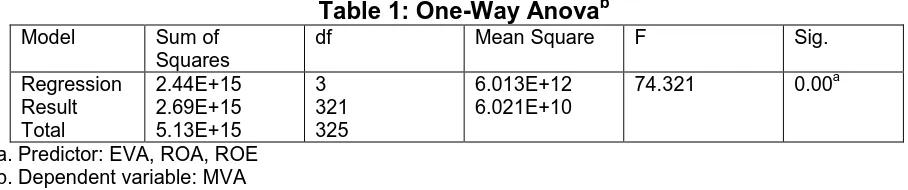
To determine the relationship between variables, linear regression ANOVA is used.
Table 1: One-Way Anovab
Model Sum of
Squares
df Mean Square F Sig.
Regression Result Total
2.44E+15 2.69E+15 5.13E+15
3 321 325
6.013E+12 6.021E+10
74.321 0.00a
a. Predictor: EVA, ROA, ROE b. Dependent variable: MVA
The results of ANOVA test in table 1 reveal that the significatnce level test is less than 5%. Therefor, there are a linear relationship between EVA, ROA, and ROE
(independent variables) with MVA (dependent variable).
For data analysis and hypotheses testing, coefficient of determination, single and multivariate regression, Durbin-Watson testis applied using the E-Viewssoftware.The results are summarizedin Table 2.
Table 2: Raw Regression Coefficients, Coefficient of Determination, and Durbin Watson Test
Independent Variables
Dependent Variable = MVA
B t Sig. Result Adjusted Sig. Durbin-
Watson
β0 627121.12 2.89291 0.0075 ---
0.72731 0.0000 0.73132 0.74231
EVA 6.928562 11.35572 0.0000 Accept
ROE 359.6172 4.95283 0.0000 Accept
ROA 3260.186 0.71238 0.4956 Reject
The results of regression in table 2 show there are relationship between EVA, ROA, and ROE with MVA. In other words, independent variables can exhibit 73% changes in MVA, and other variables can reveal 37% of changes in MVA.Moreover, the findings illustrate there are meaningful assosiation between EVA and ROE with MVA, becaue the significance of F is less than 5%. Besides, the results reveal there is not meaningful correlation between ROA and MVA, because the significant of F (significanc F = 0.4956) is more than 5%.
6. Coclusion
8
stock market value. The companies can use EVA with other measures to evaluating of company performance. These measures can help managers to consider all the cost of capital (debt and equity) and capital returns for improving the company performanceand increasing the wealth of shareholders.
Acknowledgment
The authors would like to thank of Islamic Azad University-Birjand Branch, Iran and Universiti Teknologi Malaysia (UTM) for their supports.
References
Biddle, G. C., Bowen, R. M., & wal -lace, J. S. (1998). Economic Value Added: Some Empirical EVAdence. Managerial Finance, 24 (11), 60 - 71.
Brigham, E. F., & Ehrhardt, M. C. (2005). Financial Management Theory and Practice. South - Western , United States of America: Infotrac College Edition.
Bromwich, M., & Walker, M. (1998). Residual income past and future. Management Accounting Research, 9, 391-419.
Chandra Shil, N. (2009). Performance Measures: An Application of Economic Value Added. International Journal of Business and Management, 4(3), 169- 177. Chen, S., & Dodd, J. L. (1997). Economic Value Added (EVA(TM)): An Empirical
Examination of a New Corporate Performance Measure. Journal of Managerial Issues, 9(3), 318 - 336.
De Wet, J. (2005). EVA versus Traditional Accounting Measures of Performance as Drivers of Shareholder Value – A Comparative Analysis. Meditari Accountancy Research, 13 ( 2), 1 - 16.
Jahankhani, A., & Sohrabi, J. (2010). An Analytical survey Of Inflation Distortions to Economic Value Added and the Firm’s Financial Characteristics. Financial Research, 12(29), 1-20.
Jahankhani, a., & Zariffard, a. (1995). Do Managers and Stockholders Use the Appropreate Criterion to Measure the Performance of the Company and It's Value Financial Research, 2(1(7,8)), 41-66.
Lehn, K., & Makhija, A. K. (1997). EVA, Accounting Profits and CEO Turnover: An Empirical Examination. Journal of Applied Corporate Finance, 10(2), 90-97. Lovata, L. M., & Costigan, M. L. (2002). Empirical Analysis of Adopters of Economic
Value Added. Management Accounting Research, 13, 215-228.
Nakhaei, H., Nik Intan, H., Melati, A., & Nakhaei, K. (2013). Evaluation Of Company Performance with Accounting and Economic Criteria In Bursa Malaysia. Journal of Global Business and Economics 6(1), 49-63.
Noravesh, I., & Mashayekhi, B. (2004). Incremental Information Content of Economic Value Added (EVA) and Cash Value Added (CVA) Beyond Accounting Profit (AP) and Oprerational Cash Flow (OCF). Financial Research, 6(17), 131 - 150. Noravesh, I., Salehy, F., & Karamy, G. (2004). Investigating the Relation between
9
Created Shareholder Value. The Iranian Accounting and Auditing Review, 11(37), 121-146.
Paula, D. A., & Elena, D. C. (2009). EVA Versus Traditional Accounting Measures of Performance as Drivers of Shareholder Value – a Comparative Analysis from
http://www.upm.ro/proiecte/EEE/Conferences/papers/S309.pdf
Pouyanfar, A., Rezaee, F., & Safabakhsh, s. (2010). An investigation of Relationship between Accounting and Economical Performance Measures with Market Value of Companies in Cement and Petrochimical Industries in Tehran Stock
Exchange. The Iranian Accounting and Auditing Review 17(3), 71-84. Sharma , A. K., & Kumar , S. (2012). EVA Versus Convenational Performance
Measures – Empirical Evidence from India Paper presented at the ASBBS Annual Conference: Las Vegas.
Stewart , G. B. (1991). The Quest for Value: A Guide for Senior Managers. New York: NY: Harper Business.
Vijayakumar, A. (2012). Economic Value Added (EVA) and other Accounting Performance Indicator: An Emperical Analysis of Indian Automobile Industry
International Journal of Marketing and Technology, 2(3), 131-153. Yaghoob-nejad, A., & Akaf, A. (2007). The Relationship between Evaluation