W.K. Ng, M. Kitsuregawa, and J. Li (Eds.): PAKDD 2006, LNAI 3918, pp. 841–846, 2006. © Springer-Verlag Berlin Heidelberg 2006
for Crop Yield Prediction
A. Majid Awan and Mohd. Noor Md. Sap
Faculty of Computer Sci. & Information Systems, University Technology Malaysia, Skudai 81310, Johor, Malaysia
[email protected], [email protected]
Abstract. This paper presents work on developing a software system for
pre-dicting crop yield from climate and plantation data. At the core of this system is a method for unsupervised partitioning of data for finding spatio-temporal pat-terns in climate data using kernel methods which offer strength to deal with complex data. For this purpose, a robust weighted kernel k-means algorithm in-corporating spatial constraints is presented. The algorithm can effectively han-dle noise, outliers and auto-correlation in the spatial data, for effective and effi-cient data analysis, and thus can be used for predicting oil-palm yield by ana-lyzing various factors affecting the yield.
1 Introduction
Clustering is a useful machine learning technique that can capture meaningful pat-terns in the agro-hydrological data. Finding good quality clusters in spatial data (eg, temperature, precipitation, pressure, etc) is more challenging because of its peculiar characteristics such as auto-correlation, non-linear separability, outliers, noise, high-dimensionality, and when the data has clusters of differing shapes and sizes [10, 15, 18]. The popular clustering algorithms, like k-means, have some limitations for this type of data [16, 18]. Therefore, we present a weighted kernel k-means clustering algorithm incorporating spatial constraints bearing spatial neighborhood information in order to handle spatial auto-correlation, outliers and noise in the spatial data.
A number of kernel-based learning methods have been proposed in recent years [3, 4, 7-9, 11, 13]. Generally speaking, a kernel function implicitly defines a non-linear transformation that maps the data from their original space to a high dimensional space where the data are expected to be more separable.
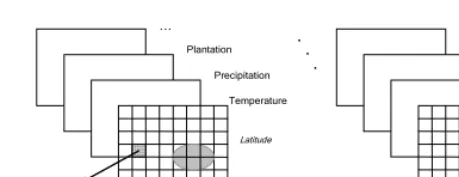
2 Application Area and Methods
Temperature Precipitation
…
Plantation
Temperature Precipitation
…
Plantation
Longitude
Latitude
Time
grid cell zone
. .
.
Fig. 1. A simplified view of the problem domain
This work uses clustering to divide areas of the land into disjoint regions in an automatic but meaningful way that enables us to identify regions of the land whose constituent points have similar short-term and long-term characteristics. The spatial and temporal nature of the target data poses a number of challenges. For instance, such type of data is noisy. In addition, such data displays autocorrelation (i.e., meas-ured values that are close in time and space tend to be highly correlated, or similar), high dimensionality, clusters of non-convex shapes, outliers.
If we apply a clustering algorithm to cluster time series associated with points on the land, we obtain clusters that represent land regions with relatively homogeneous behavior. We can then identify how various parameters influence the climate and oil-palm produce of different areas using correlation. A simplified architecture of the agro-hydrological system is shown in Figure 2:
Fig. 2. A simplified architecture for the system
3 Kernel-Based Methods
The kernel methods are among the most researched subjects within machine-learning community in recent years and have been widely applied to pattern recognition and function approximation [2,5,6,12,14,17]. There are instances where a linear hyper-plane cannot separate classes without misclassification, an instance relevant to our problem domain. However, those classes can be separated by a nonlinear separating hyperplane. This concept is based on Cover’s theorem on the separability of patterns.
Let a nonlinear transformation function φ maps the data into a higher dimensional space. Suppose there exists a function K, called a kernel function, such that,
) ( ) ( ) ,
(xi xj xi xj
K =φ ⋅φ
Correlation Analysis Pattern
discovery by Clustering Handle missing
data by Interpolation
user/ controller Hydrological
Climatological
Meteorological
Agricultural
…
feedback Raw Time Series Data
with location information
A kernel function is substituted for the dot product of the transformed vectors. So, kernels allow large non-linear feature spaces to be explored while avoiding curse of dimensionality. Further, the use of the kernel function is less computationally inten-sive. The formulation of the kernel function from the dot product is a special case of Mercer’s theorem [13].
4 Weighted Kernel K-Means with Spatial Constraints
(SWK-Means)
Let X = { xi }i=1, . . .,n be a data set with xi ∈ R
N
. We call codebook the set W = {wj}j=1, ., ., .,k with wj ∈ R
N
and k << n. The k-means clustering algorithm can be en-hanced by the use of a kernel function. The kernel k-means algorithm can be general-ized by introducing a weight for each point x, denoted by u(x), as:
2 1 ) ( ) ( ) (
∑ ∑
= ∈ − = kj xV
j i i j i w x x u W
E φ (1)
where,
∑
∑
∈ ∈ = j j j j V x j V x j j j x u x x u w ) ( ) ( ) ( φ (2)The Euclidean distance from φ(x) to center wjis given by the following eq.
2 , 2 ) ) ( ( ) , ( ) ( ) ( ) ( ) , ( ) ( 2 ) , ( ) ( ) ( ) ( ) ( ∑ ∑ ∑ ∑ ∑ ∑ ∈ ∈ ∈ ∈ ∈ ∈ + − = − j j j l j j j j j j j j j V x j V x x l j l j V x j V x j i j i i V x j V x j j i x u x x K x u x u x u x x K x u x x K x u x x u x φ φ (3)
If we adopt Guassian radial basis function (RBF), viz., ( , ) exp( 2) 2 2σ j i x x j i x x
K = − − , then K(x,x)=1. And, writing the last term in eq. (3) as Ck. we can get:
k V x j V x j i j V x j V x j j i C x u x x K x u x u x x u x j j j j j j j j + − = −
∑
∑
∑
∑
∈ ∈ ∈ ∈ ) ( ) , ( ) ( 2 1 ) ( ) ( ) ( ) ( 2 φ φ (4)For increasing the robustness of fuzzy c-means to noise, an approach is proposed in [1]. Here we propose a modification to the weighted kernel k-means to increase the robustness to noise and to account for spatial autocorrelation in the spatial data. It can be achieved by a modification to eq. (1) by introducing a penalty term containing spatial neighborhood information, as:
∑ ∑
∑
∑ ∑
= ∈ ∈ = ∈ − + − = kj x V rN
j r i
R k
j x V
j i i j i k j i w x x u N w x x u W E 1 2 1 2 ) ( ) ( ) ( ) ( )
( φ γ φ (5)
where Nkstands for the set of neighbors that exist in a window around xiand NRis the cardinality of Nk. The parameter γ controls the effect of the penalty term. The dis-tance in the last term of eq. (5), can be calculated as
k r k V x j V x j r j V x j V x j j
r C C
The expression for effective minimum distance from each point to every cluster rep-resentative can be obtained from eq. (5) using eq. (4) and (6):
) ( )
( ) , ( ) (
2 k
N r
r R k
V x
j V x
j i j
C N
C x
u x x K x u
k j
j j j
+ +
+
−
∑
∑
∑
∈ ∈
∈
β γ
(7)
As K(xi,xj) measures similarity between xi and xj, and when xi is an outlier, then
K(xi,xj) will be very small. So, the second term in the above expression will get very low value. The total expression will get higher value and hence results in robustness by not assigning the point to the cluster. For detail about the algorithm, pls. see [11].
5 Experimental Results
The system is implemented in C++. We get results regarding analyzing various fac-tors impacting oil-palm yield. However, because of space constraints, here we briefly describe the clustering results of the SWK-means algorithm.
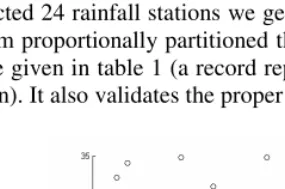
For experimentation we selected 24 rainfall stations. A 12-month moving average is used for removing seasonality from the data. For monthly rainfall values for 5 years, we get a data matrix of 24×60. SWK-means partitioned it into 2 clusters. For visualization of results, we also applied the algorithm to the monthly average rainfall values of this period. Its results are shown in Figure 3. For the next five year periods of time for the selected 24 rainfall stations we get data matrices as 48×60, 72×60 and so on. The algorithm proportionally partitioned the data into two clusters. The corre-sponding results are given in table 1 (a record represents 5-year monthly rainfall val-ues taken at a station). It also validates the proper working of the algorithm.
Fig. 3. Clustering results of SWK-means algorithm showing two clusters of monthly rainfall
(average) of 24 stations
Table 1. Results of SWK-means on rainfall data at 24 stations for 5, 10, 15, 20, 25, 30 years
No. of Records No. of records in cluster 1 No. of records in cluster 2 24
48 72 96 120 144
10 20 30 40 50 60
For the overall system, the information about the landcover areas of oil palm plan-tation is gathered. The analysis of these and other time series (e.g., precipiplan-tation, tem-perature, pressure, etc) is conducted using clustering. We can then identify how vari-ous parameters, such as precipitation, temperature etc, influence the climate and oil-palm produce of different areas using correlation. Our initial study shows that the rainfall patterns alone affect oil-palm yield after 6-7 months. This way we are able to predict oil-palm yield for the next 1-3 quarters on the basis of analysis of present plantation and environmental data.
6 Conclusions
Computational machine learning techniques like clustering can be effectively used in analyzing the impacts of various hydrological and meteorological factors on vegeta-tion. Kernel methods are helpful for clustering complex and high dimensional data that is non-linearly separable in input space. Consequently for developing a system for oil-palm yield prediction, an algorithm, weighted kernel k-means incorporating spatial constraints, is presented which is a central part of the system. We get promis-ing results on our test data sets. It is hoped that the algorithm would prove to be ro-bust and effective for spatial (climate) data analysis, and it would be very useful for oil-palm yield prediction.
References
1. M.N. Ahmed, S.M. Yamany, et al. A modified fuzzy C-means algorithm for bias field es-timation and segmentation of MRI data. IEEE Trans. on Medical Imaging, 21 (2002). 2. A. Ben-Hur, D. Horn, H. Siegelman, V. Vapnik. Support Vector Clustering. JMLR,
2(2001).
3. F. Camastra. Kernel Methods for Unsupervised Learning. PhD thesis, Uni of Genova (2004).
4. F. Camastra, A. Verri. A Novel Kernel Method for Clustering. IEEE Trans. PAMI, 27(2005)
5. J. H. Chen, C. S. Chen. Fuzzy kernel perceptron. IEEE Trans. NN, 13 (2002) 1364–1373. 6. N. Cristianini, J.S.Taylor. An Intr. to Support Vector Machines. Cambridge Ac Press
(2000).
7. I.S. Dhillon, Y. Guan, B. Kulis. Kernel kmeans, Spectral Clustering and Normalized Cuts. KDD 2004.
8. C. Ding, X. He. K-means Clustering via Principal Component Analysis. Proc. ICML 2004. 9. M. Girolami. Mercer Kernel Based Clustering in Feature Space. IEEE Trans. NN, 13
(2002).
10. J. Han, M. Kamber, K.H. Tung. Spatial Clustering Methods in Data Mining: A Survey. In: H.J. Miller, J. Han (eds.): Geographic Data Mining & Knowledge Discovery, T & F (2001).
11. M.N. Md. Sap, A. Majid Awan. Finding Spatio-Temporal Patterns in Climate Data using Clustering. Proc. Int. Conf. on Cyberworlds (CW'05), Singapore (2005).
13. B. Scholkopf, A. Smola. Learning with Kernels: Support Vector Machines, Regulariza-tion, OptimizaRegulariza-tion, and Beyond. MIT Press (2002).
14. B. Scholkopf, A. Smola, K. R. Müller. Nonlinear component analysis as a kernel eigen-value problem. Neural Computation, 10 (1998), 1299–1319.
15. S. Shekhar, et al. Trends in Spatial Data Mining. In Data Mining: Next Generation Chal-lenges and Future Directions, H. Kargupta, et al. (eds.), MIT Press, 2003.
16. M. Steinbach, P-N. Tan, V. Kumar, S. Klooster, C. Potter. Data Mining for the Discovery of Ocean Climate Indices. Proc. 5th Workshop on Scientific Data Mining at ICDM, 2002. 17. V.N. Vapnik. Statistical Learning Theory. John Wiley & Sons, 1998.