FROM LASER POINT CLOUD TO SURFACE: DATA
REDUCTION PROCEDURE TEST
Khairulazhar Zainuddin, Halim Setan and Zulkepli Majid UTM-Photogrammetry and Laser Scanning Research Group
Universiti Teknologi Malaysia
[email protected]& [email protected],
ABSTRACT
Data of object surface for reverse engineering can be captured either from contact or non-contact method. Laser scanning (non-non-contact method) usually gives high accuracy of captured data, however it also produces high point density. The difficulty of processing million of points captured by laser scanning device is the main problem to generate useful surface model. Data reduction process should be performed to reduce the number of points while maintaining the accuracy. This paper evaluated data reduction procedures on point cloud from laser scanner device. The procedures comprise of noise filtering, filter redundancy and point sampling method. Each procedure was tested using two types of sample models (freeform and primitive). The results show that the combination of filtering methods help to reduce the amount of original point cloud while maintaining the detail of surface.
Keywords: Laser Scanning, Point Cloud, Data Reduction, Data Filtering, Data Sampling.
1.0
INTRODUCTION
Reverse engineering is a reverse process of forward engineering to generate a computerized representation of an existing parts or objects. The reasons of using reverse engineering are: (1) when the original product or the manufacturer of the product are no longer exists, but a customer need the product; (2) the documentation of product design has been lost; (3) when the product encounter frequent design changes in the development cycle; and (4) for inspection and/or quality control (Varady et al. 1997; Tai and Huang, 2000; Raja and Fernandes, 2008). The aims of using reverse engineering are usually to create 3D model and CAD model.
surface model. In practical situations, it takes too long time to generate models surface using large number of point clouds. In addition, data storage and data manipulating issue may also arised from large number of point clouds.
By performing data reduction process on point cloud provides a solution to this problem, while maintained the accuracy and shape of point data. This paper presents the data reduction procedure test on point cloud from laser scanner device. The test applied to two types of sample model and the results are discussed.
2.0
LITERATURE REVIEW
Since laser scanners gives high density points of object surface, the large number of point clouds need to be reduced first before further process can be performed. Fujimoto and Kariya (1993) indicates the amount of data need to be reduced as a large amount of point data cause problem for downstream reverse engineering operations (e.g. creating CAD models). However, the question is whether to reduce the point before, after or during of the model building stages (Varady et al., 1997).
Hamann (1994) and Chen et al. (1999) suggested the reduction process is applied after creating models surface by reducing the number of triangles on mesh polygon surface. However, this approach sometimes retains the large number of point on the generated surface model. Even though the accuracy of the generated model is maintained, the performance of the processing might be slow due to large amount of point cloud.
Remondino (2003) introduced a reduction method which can be applied during the pre-processing stage including noise reduction, data sampling and hole filling before triangulated into mesh polygon surface. This helps the user to manipulate point data before surface model are generated especially when deals with multiview data. Noise reduction is possible by applying statistical method in order to remove unwanted point while trying to preserve the measured features. Hole filling process closed the gaps in the point clouds by adding new points (manually or automatically) and using the curvature and density of the surrounding points. Zhang et al. (2003) also presented an approach of data reduction procedure during pre-processing stages using sampling method. This step is mandatory for laser scanner data in order to reduce the input redundancy and to remove a certain amount of errors introduced because of the scanning device limitations (Schreiber 1993; Floater and Iske1998). Major research effort in current data reduction procedures suggested manipulating the point during pre-processing stages. However, none of these research papers evaluated the combination of the filtering method for point cloud reduction.
3.0
REVERSE ENGINEERING BY LASER SCANNING
Time-of-flight laser scanner allows unambiguous measurement of distances up to several hundred of meters. The advantage of long ranges implies reasonable accuracy. Phase measurement laser scanner represents the other common technique for medium range and limited to one hundred meters. Accuracy of the measured distances within a few millimetres is possible. Triangulations based laser scanner, also known as close range laser scanner mostly use in industrial applications and reverse engineering. Typically, this system is suitable to measure small objects, where measurement distances range up to 2m. Accuracies of a few micrometers can be achieved with triangulation laser scanner (Fröhlich and Mettenleiter 2004).
Once the data have been captured, the raw point which containing noisy point must be eliminated before can be used to generate surface model. The quality of point data can be further improved by performing pre-process operations such as noise filtering. Noise filtering function removes unwanted points by determining where the points should lie and moves them to correct locations based on statistical information about the point data (Pham and Hieu, 2008). After the noisy points are removed, redundant data should be eliminated by performing data reduction method. The most usual methods on data reduction are filter redundancy and point sampling.
3.1
Filter Redundancy
Filter redundancy uniformly reduces the number of point cloud on data when points are too close or overlapped on each other (Inus, 2004). Sun et al. (2001) presented a filter redundancy approach by fitting a parabolic quadric surface patch to a set of points. The algorithm keeps removing one of the nearest two points in the data set and the filtering iteration will not stop until the points remain in the data set reach the pre-determined number.
3.2
Point Sampling
The point sampling method minimized the number of point data and to make the data well structured so that it is easier to handle (Pham and Hieu, 2008). There are three types of sampling methods: curvature, random and uniform. Curvature point sampling (Hamann and Chen, 1994) removes few points in region of high curvature than in a low curvature region to maintain the accuracy of the curvature. Random point sampling (Martin et al., 1996) removes the point based on the specified percentage of total points that need to be reduced. Uniform sampling (Lee et al., 2001) uniformly reduces the number of points in a point set by subdivided the model space into equally sized cubic cells and deletes all but remained one point from each cell.
4.0
EVALUATION ON DATA REDUCTION PROCEDURE
Flynn 2005). The commercial laser scanning modeling software, RapidForm2004 was used to evaluate the proposed data reduction procedures.
Figure 1: Sample model 1 Figure 2: Sample model 2
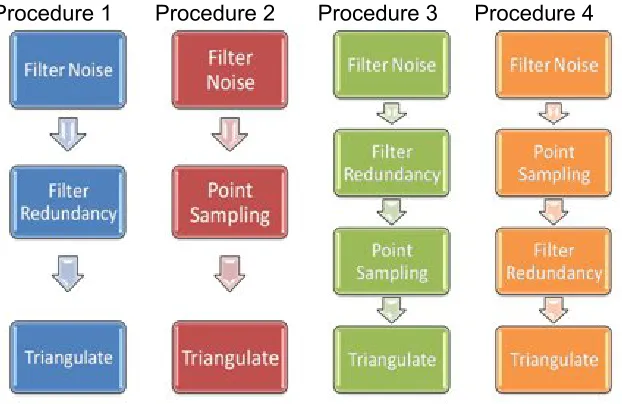
This paper evaluated four difference procedures (Figure 3). All procedures comprising of filter noise, filter redundancy, point sampling and triangulate process. The main difference between the techniques is the process applied in every tested procedure. Procedure 1 comprises of filter noise, filter redundancy and triangulate process for creating model surface. In Procedure 2, the point sampling method replaces filter redundancy in Technique 1. Procedure 3 and Procedure 4 apply both filter redundancy and point sampling methods. However, Procedure 3 performs the filter redundancy method first followed by point sampling, and vice versa in Procedure 4.
Procedure 1 Procedure 2 Procedure 3 Procedure 4
Figure 3: Tested data reduction procedures
5.0
EXPERIMENTAL RESULTS
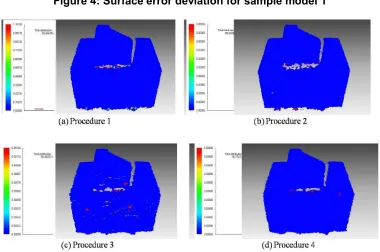
method (Figure 4(a) and Figure 5(a)) it also gives poor result in accuracy for freeform shape point cloud. On the other hand, point sampling method is very practical on eliminating redundant point on sample model (Procedure 2), thus gives good accuracy. Applying uniform point sampling method alone indicated that large amount of point cloud still remained in both sample models (Table 1 and Table 2). Moreover, the output gives poor quality created surface (Figure 4(b) and Figure 5(b)). Procedure 3, however dramatically reduced the number of point on both sample data. However, performing point sampling method on the reduced sample data resulted in poor accuracy and surface created. On the contrary, performing the point sampling first and followed by filter redundancy method (Procedure 4) reduced the number of point into smaller amount of point with good accuracy. The number of point clouds is dramatically reduced (about 77% for sample model 1 and 74% for sample model 2 from original data) and gives small deviation of the test data. Referring to surface error deviation (Figure 4 (d) and Figure 5 (d)), and applying the filter redundancy on sampling point data created good surface with minimal error deviation. The results show that the error ranges of the point cloud for sample model 1 and sample model 2 can be minimized by performing filter redundancy on point sampling data.
Table 1: Summary of deviation for sample model 1
Original 171 607 Procedure 1 Procedure 2 Procedure 3 Procedure 4
Number of point 53 495 110 398 35 655 38 816
Minimum deviation
(mm) 0.000 0.000 0.000 0.000
Maximum deviation
(mm) 33.101 35.050 35.124 34.821
Average deviation
(mm) 0.118 0.066 0.151 0.063
Standard deviation
(mm) 1.383 0.964 1.535 0.861
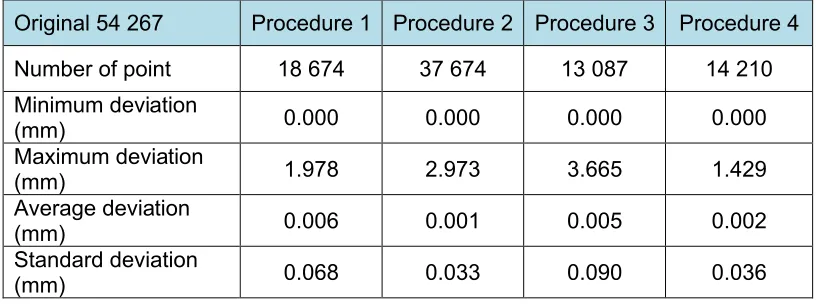
Table 2: Summary of deviation for sample model 2
Original 54 267 Procedure 1 Procedure 2 Procedure 3 Procedure 4
Number of point 18 674 37 674 13 087 14 210
Minimum deviation
(mm) 0.000 0.000 0.000 0.000
Maximum deviation
(mm) 1.978 2.973 3.665 1.429
Average deviation
(mm) 0.006 0.001 0.005 0.002
Standard deviation
Figure 4: Surface error deviation for sample model 1
Figure 5: Surface error deviation for sample model 2
6.0
CONCLUSION
surface. The surface model generated from this proposed reduction procedures can be used in further modeling processes (e.g. registration, meshing and segmentation) in order to generated fine 3D model and perfect CAD model. For further research, the point reduction will be tested on 3D model generated from merging the mesh polygon using the procedure in this study.
ACKNOWLEDGMENTS
The authors acknowledge financial assistance for this research from Universiti Teknologi MARA (UiTM) and Ministry of Higher Education (MOHE) Malaysia, for Young Lecturer Scheme Scholarship, Universiti Teknologi Malaysia for research activities and e-science fund vote number 79141.
REFERENCES
Blasi, F., Monno, G. and Uva, A. E. 2001. Implicit surfaces modeling for objects reconstruction from scattered 3D points clouds. XII ADM International Conference. Rimini, Italy.
Böehler, W. and Marbs, A. 2002. 3D Scanning Instruments. Proc. of the CIPA WG6 Int. Workshop on scanning for cultural heritage recording
Boehnen, C. and Flynn, P. 2005. Accuracy of 3D Scanning Technologies in a Face Scanning Scenario. Paper presented at the Fifth International Conference on 3-D Digital Imaging and Modeling (3DIM’05).
Bradley, C. and Currie, B. 2005. Advances in the Field of Reverse Engineering. Computer-Aided Design andApplications, 2(5), 697-706
Chen, Y. H., Ng, C. T. and Wang, Y. Z. 1999. Data reduction in integrated reverse engineering and rapid prototyping. International Journal of Computer Integrated Manufacturing, 12((2)), 97-103
Floater, M. and Iske, A. 1998. Thinning Algorithms for Scattered Data Interpolation. BIT Numerical Mathematics, 38(4), 705-720
Fröhlich, C. and Mettenleiter, M. 2004. Terrestrial Laser Scanning– New Perspectives in 3D Surveying. International Archives of Photogrammetry, Remote Sensing and Spatial Information Sciences, XXXVI - 8/W2
Fujimoto, M. and Kariya, K. 1993. An Improved method for digitized data reduction using an angel parameter. Journal of the International Measurement Confederation, 12(1993), 113-112
Hamann, B. 1994. A data reduction scheme for triangulation surfaces. Computer Aided Geometric Design, 11((2)), 197-214
Hamann, B. and Chen, J. 1994. Data point selection for piecewise linear curve approximation. Computer Aided Geometric Design, 11(1994), 289-301
Lee, K. H., Woo, H. and Suk, T. 2001. Point Data Reduction Using 3D Grids. Int J Adv Manuf Technol, 18. 2001, 201–210
Martin, R. R., Stroud, I. A. and Marshall, A. D. 1996. Data reduction for reverse engineering, RECCAD, Deliverable Document 1 Data Reduction Methods for Reverse Engineering 743 COPERUNICUS project, No. 1068: Computer and Automation Institute of Hungarian Academy of Science.
Pham, D. T. and Hieu, L. C. 2008. Reverse Engineering-Hardware and Software. In V. Raja, andK. J. Fernandes (Eds.) Reverse Engineering: An Industrial Perspective (pp. 33-70): Springer-Verlag London Limited.
Raja, V. and Fernandes, K. J. (Eds.). 2008. Reverse Engineering: An Industrial Perspective: Springer-Verlag London Limited.
Remondino, F. 2003. From Point Cloud to Surface: The Modeling And Visualization Problem International Archives of Photogrammetry, Remote Sensing and Spatial Information Sciences International Workshop on Visualization and Animation of Reality-based 3D Models XXXIV-5/W10
Roca-Pardinas, J., Lorenzo, H., Arias, P. and Armestob, J. 2008. From laser point clouds to surfaces: Statistical nonparametric methods for three-dimensional reconstruction. Computer-Aided Design 40, 646–652
Schreiber, T. 1993. Clustering for Data Reduction and Approximation. Int. Conf. on Computer Graphics and Visualization. S. Petersburg, Russia.
Sun, W., Bradley, C., Zhang, Y. F. and Loh, H. T. 2001. Cloud data modelling employing a unifed, non-redundant triangular mesh. Computer-Aided Design 33. 2001. 183-193
Tai, C. and Huang, M. 2000. The processing of data points basing on design intent in reverse engineering. International Journal of Machine Tools and Manufacture 40, pp. 1913-1927.
Varady, T., Martin, R. R. and Cox, J. 1997. Reverse engineering of geometric models-an introduction Computer-Aided Design, 29(4), 255-268
Woo, H., Kang, E., Wang, S. and Lee, K. H. 2002. A new segmentation method for point cloud data. International Journal of Machine Tools andManufacture, 42, 167–178.167
AUTHORS
Khairulazhar Zainuddin, born in 1981. Graduated in 2002 as Dipl. in Geomatics Science and obtaining B. Sc. Surveying Science and Geomatics in 2004, both from Universiti Teknologi MARA, Malaysia. Currently post-graduate student (M.Sc.) since 2007 at Universiti Teknologi Malaysia.
Prof. Dr. Halim Setan, born in 1957. Graduated in 1978 as Dipl. Land Surveying from Universiti Teknologi Malaysia. Obtaining doctoral degree in 1995 from The City University, London, England. Professor at department of Geomatic Engineering Universiti Teknologi Malaysia.